

Key Insights
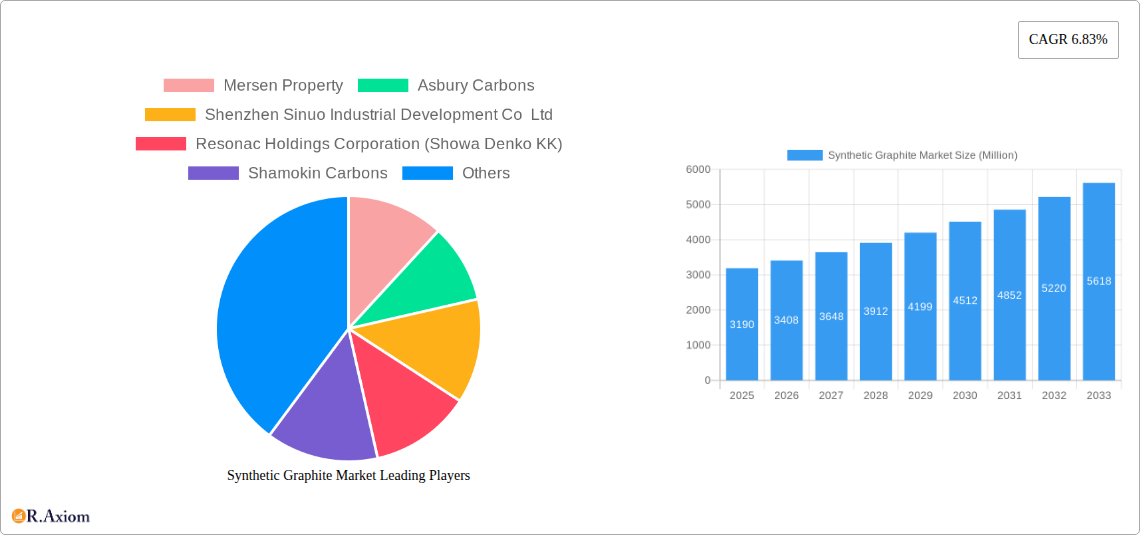
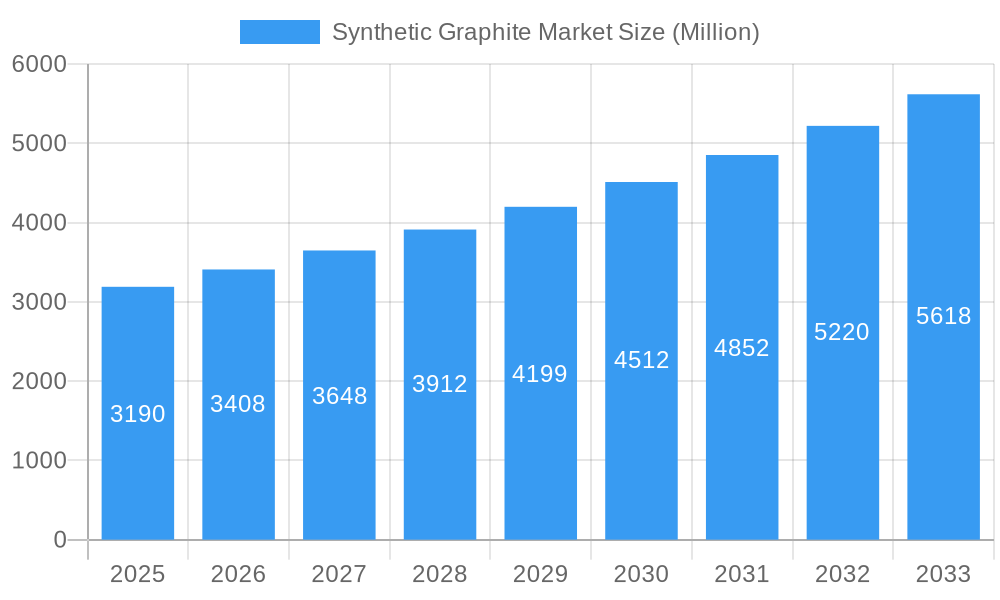
The global synthetic graphite market, valued at $3.19 billion in 2025, is projected to experience robust growth, driven by a compound annual growth rate (CAGR) of 6.83% from 2025 to 2033. This expansion is primarily fueled by the burgeoning demand for electric vehicles (EVs), which rely heavily on synthetic graphite in their lithium-ion batteries. The increasing adoption of renewable energy technologies, particularly solar and wind power, further contributes to market growth, as synthetic graphite is crucial in energy storage solutions. Metallurgy and other industrial applications, including nuclear reactors and specialized parts manufacturing, also contribute significantly to market demand. Market segmentation reveals that graphite anodes for batteries hold the largest share, followed by graphite blocks for fine carbon applications. Regionally, the Asia-Pacific region, particularly China, India, and Japan, dominates the market due to significant manufacturing and consumption of synthetic graphite. However, North America and Europe are also experiencing considerable growth, driven by increasing investments in renewable energy and electric vehicle infrastructure. While supply chain constraints and price fluctuations in raw materials could pose challenges, technological advancements focused on improving graphite quality and enhancing battery performance are expected to mitigate these risks.
Synthetic Graphite Market Market Size (In Billion)
The competitive landscape is characterized by a mix of large multinational corporations and specialized regional players. Key players, such as Mersen Property, Asbury Carbons, and several prominent Japanese and Chinese companies, are investing heavily in research and development to improve production efficiency and develop advanced graphite materials tailored to specific applications. The market is expected to witness strategic mergers, acquisitions, and joint ventures as companies strive to consolidate their market share and gain access to new technologies and markets. The continued growth of the EV and renewable energy sectors, along with technological innovations, strongly indicates a positive outlook for the synthetic graphite market throughout the forecast period, though careful management of supply chain dynamics and resource sustainability will remain critical aspects of market success.
Synthetic Graphite Market Company Market Share
Synthetic Graphite Market: A Comprehensive Report (2019-2033)
This detailed report provides a comprehensive analysis of the Synthetic Graphite Market, covering market size, growth drivers, challenges, opportunities, and key players. The study period spans from 2019 to 2033, with 2025 serving as the base and estimated year. This report is essential for industry stakeholders, investors, and researchers seeking a deep understanding of this dynamic market.
Synthetic Graphite Market Market Concentration & Innovation
The global synthetic graphite market exhibits a moderately concentrated landscape, with a few major players holding significant market share. The exact market share distribution for 2025 is estimated at xx%, with the top five players accounting for approximately xx% of the total revenue. Innovation is a key driver, focusing on enhancing product performance (e.g., higher purity, improved electrical conductivity), exploring new applications, and optimizing production processes to reduce costs.
- Innovation Drivers: Advancements in materials science, rising demand for high-performance batteries, and the pursuit of sustainable manufacturing practices are driving innovation.
- Regulatory Frameworks: Environmental regulations, particularly concerning carbon emissions and waste management, significantly impact the industry. Stringent quality standards for specific applications (e.g., nuclear reactors) also influence market dynamics.
- Product Substitutes: While limited, alternative materials are being explored for specific applications. The competitive threat from substitutes remains relatively low at present, with synthetic graphite maintaining a strong position due to its unique properties.
- End-User Trends: The growing adoption of electric vehicles (EVs) and energy storage systems is a major driver of demand, leading to increased investment in synthetic graphite production capacity. The expanding renewable energy sector also presents significant opportunities.
- M&A Activities: The market has witnessed several mergers and acquisitions in recent years, with deal values ranging from USD xx Million to USD xx Million. These activities aim to consolidate market share, gain access to new technologies, and expand into new geographical markets. The total M&A deal value from 2019 to 2024 is estimated at USD xx Million.
Synthetic Graphite Market Industry Trends & Insights
The global synthetic graphite market is experiencing robust growth, primarily propelled by the surging demand from the electric vehicle (EV) and energy storage sectors. The market is anticipated to witness a Compound Annual Growth Rate (CAGR) of approximately 15-20% during the forecast period (2025-2033). This significant expansion is directly attributable to increasing global investments in renewable energy infrastructure and the escalating need for high-energy-density batteries to power these advancements. Continuous technological innovations in synthetic graphite production are yielding improved quality and enhanced cost-efficiency, further accelerating market growth. Key application segments, especially batteries, are experiencing substantial market penetration, a trend projected to persist throughout the forecast period. The competitive landscape is evolving with existing players actively engaged in capacity expansion and strategic innovation, while new entrants are also making their mark. Furthermore, a growing consumer preference for sustainable and ethically sourced materials is placing increasing emphasis on producers to adopt environmentally responsible manufacturing practices.
Dominant Markets & Segments in Synthetic Graphite Market
The Asia-Pacific region currently holds the dominant position in the global synthetic graphite market, largely driven by the robust demand originating from China, Japan, and South Korea. Within this market, the Battery application segment stands out as both the largest and fastest-growing segment, propelled by the exponential growth observed in the electric vehicle (EV) market.
Key Drivers by Region:
- Asia-Pacific: Characterized by a high demand from the burgeoning electronics and automotive industries, supportive government initiatives and policies, and a well-established, robust manufacturing base.
- Europe: Driven by the increasing adoption of renewable energy sources and the implementation of stringent environmental regulations that favor sustainable materials.
- North America: Experiencing growth due to rising investments in EV charging infrastructure and a burgeoning demand for advanced energy storage solutions.
Dominant Segments:
- Type: Graphite Anode commands the largest market share due to its ubiquitous and critical use in the manufacturing of lithium-ion batteries.
- Application: The battery segment is the most dynamic and rapidly expanding application area, a direct consequence of the escalating global demand for electric vehicles and sophisticated energy storage systems.
Synthetic Graphite Market Product Developments
Recent product developments focus on enhancing the performance characteristics of synthetic graphite, such as higher purity, improved electrical conductivity, and enhanced thermal stability. These advancements are aimed at meeting the growing demands of high-performance applications, especially in the EV and energy storage industries. Companies are also developing new production methods to reduce costs and improve efficiency. The market is seeing the introduction of specialized synthetic graphite grades tailored to specific applications, further enhancing their competitive advantage.
Report Scope & Segmentation Analysis
This comprehensive report meticulously segments the synthetic graphite market based on key product Type and diverse end-use Application categories.
Type:
- Graphite Anode: This segment is projected to exhibit a robust CAGR of approximately 18-22% during the forecast period, driven by its indispensable role in lithium-ion batteries. The market is characterized by a highly competitive environment featuring prominent global players.
- Graphite Block (Fine Carbon): This segment is anticipated to witness steady, moderate growth, primarily fueled by its critical use in various advanced metallurgical applications and industrial processes requiring high-performance carbon materials.
- Other Types (Graphite Electrode, etc.): This segment encompasses a wide array of niche applications and specialized forms of synthetic graphite, exhibiting consistent growth driven by the diverse and evolving requirements across multiple industrial sectors.
Application:
- Metallurgy: This segment is projected to maintain a consistent growth trajectory, underpinned by the continuous and essential demand for high-quality synthetic graphite materials in a spectrum of metallurgical processes, including steelmaking and aluminum production.
- Parts and Components: This segment demonstrates moderate growth, reflecting the increasing demand for specialized and high-performance graphite components utilized in various industrial machinery, aerospace, and advanced manufacturing applications.
- Batteries: This segment represents the fastest-growing area within the market, propelled by the unprecedented surge in demand for electric vehicles and grid-scale energy storage solutions.
- Nuclear: This segment showcases steady growth, attributed to the persistent and critical requirement for high-purity synthetic graphite materials in advanced nuclear reactor designs and other nuclear applications.
- Other Applications: This encompassing segment covers a broad range of miscellaneous industrial uses and displays consistent growth, benefiting from the overall expansion of the global industrial base and emerging technological applications.
Key Drivers of Synthetic Graphite Market Growth
The synthetic graphite market's impressive growth is propelled by a confluence of powerful factors. Chief among these is the burgeoning electric vehicle (EV) industry, which directly translates into an immense demand for high-performance graphite anodes essential for lithium-ion batteries. Complementing this is the rapidly expanding renewable energy sector, necessitating efficient and scalable energy storage solutions, further boosting the demand for synthetic graphite. Significant technological advancements in production methods are leading to the development of higher-quality and more cost-effective synthetic graphite, making it more accessible and attractive for various applications. Moreover, favorable government policies worldwide, actively supporting the transition to renewable energy and the widespread adoption of EVs, provide a crucial impetus for market expansion.
Challenges in the Synthetic Graphite Market Sector
Challenges include fluctuating raw material prices, potential supply chain disruptions, and intense competition among market players. Meeting stringent environmental regulations poses another hurdle, requiring manufacturers to adopt sustainable production practices. Furthermore, the development of alternative anode materials for batteries presents a potential long-term challenge to the continued dominance of synthetic graphite. The overall impact of these challenges is estimated to reduce the CAGR by approximately xx% during the forecast period.
Emerging Opportunities in Synthetic Graphite Market
Emerging opportunities lie in the development of next-generation battery technologies, including solid-state batteries and advanced lithium-ion battery systems. The increasing adoption of renewable energy solutions, requiring advanced energy storage systems, represents a significant growth avenue. Expansion into new application areas, such as fuel cells and advanced composites, presents further opportunities for market expansion. Moreover, the growing focus on sustainable and ethical sourcing practices could provide a competitive edge for companies implementing such initiatives.
Leading Players in the Synthetic Graphite Market Market
- Mersen Property
- Asbury Carbons
- Shenzhen Sinuo Industrial Development Co Ltd
- Resonac Holdings Corporation (Showa Denko KK)
- Shamokin Carbons
- Mitsubishi Chemical Corporation
- Nippon Carbon Co Ltd
- Jiangxi Zichen Technology Co Ltd
- Tokai Cobex GmbH
- GrafTech International
- BTR New Materials Group Co Ltd
- Imerys
- Shanghai Shanshan Technology Co Ltd
- Graphit Kropfmühl GmbH
- Graphite India Limited
- Lianyungang Jinli Carbon Co Ltd
Key Developments in Synthetic Graphite Market Industry
- October 2022: Imerys Graphite & Carbon Company's announcement of the EMILI Project marked a significant milestone. This landmark lithium exploitation project has the potential to substantially reduce lithium imports and support the production of approximately 700,000 electric vehicle batteries annually, profoundly influencing supply chain dynamics and overall market equilibrium.
- April 2022: Shanshan Corporation's successful acquisition of USD 477 million in investment underscores a strong vote of confidence in the lithium battery materials sector. This substantial funding injection is poised to significantly boost their production capacity, further solidifying their position and contributing to the robust growth of the lithium-ion battery ecosystem.
Strategic Outlook for Synthetic Graphite Market Market
The synthetic graphite market is poised for continued expansion driven by the growing adoption of EVs and renewable energy technologies. The focus on innovation and the development of sustainable production practices will be crucial for maintaining a competitive edge. Strategic partnerships and collaborations will be vital for securing raw materials and expanding into new markets. The market presents significant growth opportunities for companies that can adapt to the evolving technological landscape and consumer preferences.
Synthetic Graphite Market Segmentation
-
1. Type
- 1.1. Graphite Anode
- 1.2. Graphite Block (Fine Carbon)
- 1.3. Other Types (Graphite Electrode, etc.)
-
2. Application
- 2.1. Metallurgy
- 2.2. Parts and Components
- 2.3. Batteries
- 2.4. Nuclear
- 2.5. Other Applications
Synthetic Graphite Market Segmentation By Geography
-
1. Asia Pacific
- 1.1. China
- 1.2. India
- 1.3. Japan
- 1.4. South Korea
- 1.5. Asean Countries
- 1.6. Rest of Asia Pacific
-
2. North America
- 2.1. United States
- 2.2. Canada
- 2.3. Mexico
-
3. Europe
- 3.1. Germany
- 3.2. United Kingdom
- 3.3. Italy
- 3.4. France
- 3.5. Russia
- 3.6. Rest of Europe
-
4. South America
- 4.1. Brazil
- 4.2. Argentina
- 4.3. Rest of South America
-
5. Middle East and Africa
- 5.1. Saudi Arabia
- 5.2. South Africa
- 5.3. Rest of Middle East and Africa
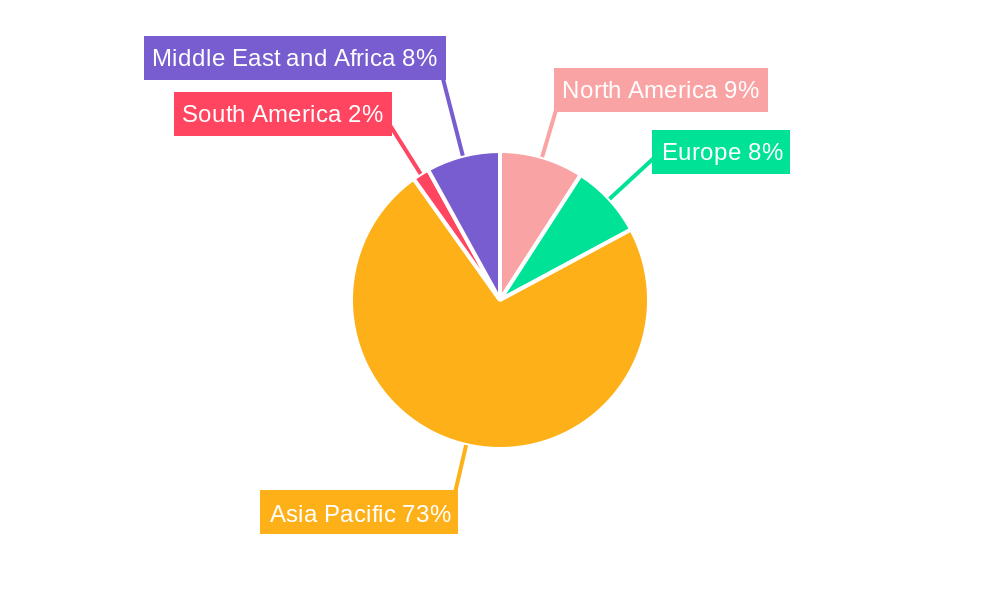
Synthetic Graphite Market Regional Market Share
Geographic Coverage of Synthetic Graphite Market
Synthetic Graphite Market REPORT HIGHLIGHTS
| Aspects | Details |
|---|---|
| Study Period | 2020-2034 |
| Base Year | 2025 |
| Estimated Year | 2026 |
| Forecast Period | 2026-2034 |
| Historical Period | 2020-2025 |
| Growth Rate | CAGR of 15.1% from 2020-2034 |
| Segmentation |
|
Table of Contents
- 1. Introduction
- 1.1. Research Scope
- 1.2. Market Segmentation
- 1.3. Research Objective
- 1.4. Definitions and Assumptions
- 2. Executive Summary
- 2.1. Market Snapshot
- 3. Market Dynamics
- 3.1. Market Drivers
- 3.2. Market Restrains
- 3.3. Market Trends
- 3.4. Market Opportunities
- 4. Market Factor Analysis
- 4.1. Porters Five Forces
- 4.1.1. Bargaining Power of Suppliers
- 4.1.2. Bargaining Power of Buyers
- 4.1.3. Threat of New Entrants
- 4.1.4. Threat of Substitutes
- 4.1.5. Competitive Rivalry
- 4.2. PESTEL analysis
- 4.3. BCG Analysis
- 4.3.1. Stars (High Growth, High Market Share)
- 4.3.2. Cash Cows (Low Growth, High Market Share)
- 4.3.3. Question Mark (High Growth, Low Market Share)
- 4.3.4. Dogs (Low Growth, Low Market Share)
- 4.4. Ansoff Matrix Analysis
- 4.5. Supply Chain Analysis
- 4.6. Regulatory Landscape
- 4.7. Current Market Potential and Opportunity Assessment (TAM–SAM–SOM Framework)
- 4.8. RAX Analyst Note
- 4.1. Porters Five Forces
- 5. Market Analysis, Insights and Forecast 2021-2033
- 5.1. Market Analysis, Insights and Forecast - by Type
- 5.1.1. Graphite Anode
- 5.1.2. Graphite Block (Fine Carbon)
- 5.1.3. Other Types (Graphite Electrode, etc.)
- 5.2. Market Analysis, Insights and Forecast - by Application
- 5.2.1. Metallurgy
- 5.2.2. Parts and Components
- 5.2.3. Batteries
- 5.2.4. Nuclear
- 5.2.5. Other Applications
- 5.3. Market Analysis, Insights and Forecast - by Region
- 5.3.1. Asia Pacific
- 5.3.2. North America
- 5.3.3. Europe
- 5.3.4. South America
- 5.3.5. Middle East and Africa
- 5.1. Market Analysis, Insights and Forecast - by Type
- 6. Global Synthetic Graphite Market Analysis, Insights and Forecast, 2021-2033
- 6.1. Market Analysis, Insights and Forecast - by Type
- 6.1.1. Graphite Anode
- 6.1.2. Graphite Block (Fine Carbon)
- 6.1.3. Other Types (Graphite Electrode, etc.)
- 6.2. Market Analysis, Insights and Forecast - by Application
- 6.2.1. Metallurgy
- 6.2.2. Parts and Components
- 6.2.3. Batteries
- 6.2.4. Nuclear
- 6.2.5. Other Applications
- 6.1. Market Analysis, Insights and Forecast - by Type
- 7. Asia Pacific Synthetic Graphite Market Analysis, Insights and Forecast, 2020-2032
- 7.1. Market Analysis, Insights and Forecast - by Type
- 7.1.1. Graphite Anode
- 7.1.2. Graphite Block (Fine Carbon)
- 7.1.3. Other Types (Graphite Electrode, etc.)
- 7.2. Market Analysis, Insights and Forecast - by Application
- 7.2.1. Metallurgy
- 7.2.2. Parts and Components
- 7.2.3. Batteries
- 7.2.4. Nuclear
- 7.2.5. Other Applications
- 7.1. Market Analysis, Insights and Forecast - by Type
- 8. North America Synthetic Graphite Market Analysis, Insights and Forecast, 2020-2032
- 8.1. Market Analysis, Insights and Forecast - by Type
- 8.1.1. Graphite Anode
- 8.1.2. Graphite Block (Fine Carbon)
- 8.1.3. Other Types (Graphite Electrode, etc.)
- 8.2. Market Analysis, Insights and Forecast - by Application
- 8.2.1. Metallurgy
- 8.2.2. Parts and Components
- 8.2.3. Batteries
- 8.2.4. Nuclear
- 8.2.5. Other Applications
- 8.1. Market Analysis, Insights and Forecast - by Type
- 9. Europe Synthetic Graphite Market Analysis, Insights and Forecast, 2020-2032
- 9.1. Market Analysis, Insights and Forecast - by Type
- 9.1.1. Graphite Anode
- 9.1.2. Graphite Block (Fine Carbon)
- 9.1.3. Other Types (Graphite Electrode, etc.)
- 9.2. Market Analysis, Insights and Forecast - by Application
- 9.2.1. Metallurgy
- 9.2.2. Parts and Components
- 9.2.3. Batteries
- 9.2.4. Nuclear
- 9.2.5. Other Applications
- 9.1. Market Analysis, Insights and Forecast - by Type
- 10. South America Synthetic Graphite Market Analysis, Insights and Forecast, 2020-2032
- 10.1. Market Analysis, Insights and Forecast - by Type
- 10.1.1. Graphite Anode
- 10.1.2. Graphite Block (Fine Carbon)
- 10.1.3. Other Types (Graphite Electrode, etc.)
- 10.2. Market Analysis, Insights and Forecast - by Application
- 10.2.1. Metallurgy
- 10.2.2. Parts and Components
- 10.2.3. Batteries
- 10.2.4. Nuclear
- 10.2.5. Other Applications
- 10.1. Market Analysis, Insights and Forecast - by Type
- 11. Middle East and Africa Synthetic Graphite Market Analysis, Insights and Forecast, 2020-2032
- 11.1. Market Analysis, Insights and Forecast - by Type
- 11.1.1. Graphite Anode
- 11.1.2. Graphite Block (Fine Carbon)
- 11.1.3. Other Types (Graphite Electrode, etc.)
- 11.2. Market Analysis, Insights and Forecast - by Application
- 11.2.1. Metallurgy
- 11.2.2. Parts and Components
- 11.2.3. Batteries
- 11.2.4. Nuclear
- 11.2.5. Other Applications
- 11.1. Market Analysis, Insights and Forecast - by Type
- 12. Competitive Analysis
- 12.1. Company Profiles
- 12.1.1 Mersen Property
- 12.1.1.1. Company Overview
- 12.1.1.2. Products
- 12.1.1.3. Company Financials
- 12.1.1.4. SWOT Analysis
- 12.1.2 Asbury Carbons
- 12.1.2.1. Company Overview
- 12.1.2.2. Products
- 12.1.2.3. Company Financials
- 12.1.2.4. SWOT Analysis
- 12.1.3 Shenzhen Sinuo Industrial Development Co Ltd
- 12.1.3.1. Company Overview
- 12.1.3.2. Products
- 12.1.3.3. Company Financials
- 12.1.3.4. SWOT Analysis
- 12.1.4 Resonac Holdings Corporation (Showa Denko KK)
- 12.1.4.1. Company Overview
- 12.1.4.2. Products
- 12.1.4.3. Company Financials
- 12.1.4.4. SWOT Analysis
- 12.1.5 Shamokin Carbons
- 12.1.5.1. Company Overview
- 12.1.5.2. Products
- 12.1.5.3. Company Financials
- 12.1.5.4. SWOT Analysis
- 12.1.6 Mitsubishi Chemical Corporation
- 12.1.6.1. Company Overview
- 12.1.6.2. Products
- 12.1.6.3. Company Financials
- 12.1.6.4. SWOT Analysis
- 12.1.7 Nippon Carbon Co Ltd
- 12.1.7.1. Company Overview
- 12.1.7.2. Products
- 12.1.7.3. Company Financials
- 12.1.7.4. SWOT Analysis
- 12.1.8 Jiangxi Zichen Technology Co Ltd
- 12.1.8.1. Company Overview
- 12.1.8.2. Products
- 12.1.8.3. Company Financials
- 12.1.8.4. SWOT Analysis
- 12.1.9 Tokai Cobex GmbH
- 12.1.9.1. Company Overview
- 12.1.9.2. Products
- 12.1.9.3. Company Financials
- 12.1.9.4. SWOT Analysis
- 12.1.10 GrafTech International
- 12.1.10.1. Company Overview
- 12.1.10.2. Products
- 12.1.10.3. Company Financials
- 12.1.10.4. SWOT Analysis
- 12.1.11 BTR New Materials Group Co Ltd
- 12.1.11.1. Company Overview
- 12.1.11.2. Products
- 12.1.11.3. Company Financials
- 12.1.11.4. SWOT Analysis
- 12.1.12 Imerys
- 12.1.12.1. Company Overview
- 12.1.12.2. Products
- 12.1.12.3. Company Financials
- 12.1.12.4. SWOT Analysis
- 12.1.13 Shanghai Shanshan Technology Co Ltd
- 12.1.13.1. Company Overview
- 12.1.13.2. Products
- 12.1.13.3. Company Financials
- 12.1.13.4. SWOT Analysis
- 12.1.14 Graphit Kropfmhl GmbH
- 12.1.14.1. Company Overview
- 12.1.14.2. Products
- 12.1.14.3. Company Financials
- 12.1.14.4. SWOT Analysis
- 12.1.15 Graphite India Limited
- 12.1.15.1. Company Overview
- 12.1.15.2. Products
- 12.1.15.3. Company Financials
- 12.1.15.4. SWOT Analysis
- 12.1.16 Lianyungang Jinli Carbon Co Ltd
- 12.1.16.1. Company Overview
- 12.1.16.2. Products
- 12.1.16.3. Company Financials
- 12.1.16.4. SWOT Analysis
- 12.1.1 Mersen Property
- 12.2. Market Entropy
- 12.2.1 Company's Key Areas Served
- 12.2.2 Recent Developments
- 12.3. Company Market Share Analysis 2025
- 12.3.1 Top 5 Companies Market Share Analysis
- 12.3.2 Top 3 Companies Market Share Analysis
- 12.4. List of Potential Customers
- 13. Research Methodology
List of Figures
- Figure 1: Global Synthetic Graphite Market Revenue Breakdown (billion, %) by Region 2025 & 2033
- Figure 2: Global Synthetic Graphite Market Volume Breakdown (K Tons, %) by Region 2025 & 2033
- Figure 3: Asia Pacific Synthetic Graphite Market Revenue (billion), by Type 2025 & 2033
- Figure 4: Asia Pacific Synthetic Graphite Market Volume (K Tons), by Type 2025 & 2033
- Figure 5: Asia Pacific Synthetic Graphite Market Revenue Share (%), by Type 2025 & 2033
- Figure 6: Asia Pacific Synthetic Graphite Market Volume Share (%), by Type 2025 & 2033
- Figure 7: Asia Pacific Synthetic Graphite Market Revenue (billion), by Application 2025 & 2033
- Figure 8: Asia Pacific Synthetic Graphite Market Volume (K Tons), by Application 2025 & 2033
- Figure 9: Asia Pacific Synthetic Graphite Market Revenue Share (%), by Application 2025 & 2033
- Figure 10: Asia Pacific Synthetic Graphite Market Volume Share (%), by Application 2025 & 2033
- Figure 11: Asia Pacific Synthetic Graphite Market Revenue (billion), by Country 2025 & 2033
- Figure 12: Asia Pacific Synthetic Graphite Market Volume (K Tons), by Country 2025 & 2033
- Figure 13: Asia Pacific Synthetic Graphite Market Revenue Share (%), by Country 2025 & 2033
- Figure 14: Asia Pacific Synthetic Graphite Market Volume Share (%), by Country 2025 & 2033
- Figure 15: North America Synthetic Graphite Market Revenue (billion), by Type 2025 & 2033
- Figure 16: North America Synthetic Graphite Market Volume (K Tons), by Type 2025 & 2033
- Figure 17: North America Synthetic Graphite Market Revenue Share (%), by Type 2025 & 2033
- Figure 18: North America Synthetic Graphite Market Volume Share (%), by Type 2025 & 2033
- Figure 19: North America Synthetic Graphite Market Revenue (billion), by Application 2025 & 2033
- Figure 20: North America Synthetic Graphite Market Volume (K Tons), by Application 2025 & 2033
- Figure 21: North America Synthetic Graphite Market Revenue Share (%), by Application 2025 & 2033
- Figure 22: North America Synthetic Graphite Market Volume Share (%), by Application 2025 & 2033
- Figure 23: North America Synthetic Graphite Market Revenue (billion), by Country 2025 & 2033
- Figure 24: North America Synthetic Graphite Market Volume (K Tons), by Country 2025 & 2033
- Figure 25: North America Synthetic Graphite Market Revenue Share (%), by Country 2025 & 2033
- Figure 26: North America Synthetic Graphite Market Volume Share (%), by Country 2025 & 2033
- Figure 27: Europe Synthetic Graphite Market Revenue (billion), by Type 2025 & 2033
- Figure 28: Europe Synthetic Graphite Market Volume (K Tons), by Type 2025 & 2033
- Figure 29: Europe Synthetic Graphite Market Revenue Share (%), by Type 2025 & 2033
- Figure 30: Europe Synthetic Graphite Market Volume Share (%), by Type 2025 & 2033
- Figure 31: Europe Synthetic Graphite Market Revenue (billion), by Application 2025 & 2033
- Figure 32: Europe Synthetic Graphite Market Volume (K Tons), by Application 2025 & 2033
- Figure 33: Europe Synthetic Graphite Market Revenue Share (%), by Application 2025 & 2033
- Figure 34: Europe Synthetic Graphite Market Volume Share (%), by Application 2025 & 2033
- Figure 35: Europe Synthetic Graphite Market Revenue (billion), by Country 2025 & 2033
- Figure 36: Europe Synthetic Graphite Market Volume (K Tons), by Country 2025 & 2033
- Figure 37: Europe Synthetic Graphite Market Revenue Share (%), by Country 2025 & 2033
- Figure 38: Europe Synthetic Graphite Market Volume Share (%), by Country 2025 & 2033
- Figure 39: South America Synthetic Graphite Market Revenue (billion), by Type 2025 & 2033
- Figure 40: South America Synthetic Graphite Market Volume (K Tons), by Type 2025 & 2033
- Figure 41: South America Synthetic Graphite Market Revenue Share (%), by Type 2025 & 2033
- Figure 42: South America Synthetic Graphite Market Volume Share (%), by Type 2025 & 2033
- Figure 43: South America Synthetic Graphite Market Revenue (billion), by Application 2025 & 2033
- Figure 44: South America Synthetic Graphite Market Volume (K Tons), by Application 2025 & 2033
- Figure 45: South America Synthetic Graphite Market Revenue Share (%), by Application 2025 & 2033
- Figure 46: South America Synthetic Graphite Market Volume Share (%), by Application 2025 & 2033
- Figure 47: South America Synthetic Graphite Market Revenue (billion), by Country 2025 & 2033
- Figure 48: South America Synthetic Graphite Market Volume (K Tons), by Country 2025 & 2033
- Figure 49: South America Synthetic Graphite Market Revenue Share (%), by Country 2025 & 2033
- Figure 50: South America Synthetic Graphite Market Volume Share (%), by Country 2025 & 2033
- Figure 51: Middle East and Africa Synthetic Graphite Market Revenue (billion), by Type 2025 & 2033
- Figure 52: Middle East and Africa Synthetic Graphite Market Volume (K Tons), by Type 2025 & 2033
- Figure 53: Middle East and Africa Synthetic Graphite Market Revenue Share (%), by Type 2025 & 2033
- Figure 54: Middle East and Africa Synthetic Graphite Market Volume Share (%), by Type 2025 & 2033
- Figure 55: Middle East and Africa Synthetic Graphite Market Revenue (billion), by Application 2025 & 2033
- Figure 56: Middle East and Africa Synthetic Graphite Market Volume (K Tons), by Application 2025 & 2033
- Figure 57: Middle East and Africa Synthetic Graphite Market Revenue Share (%), by Application 2025 & 2033
- Figure 58: Middle East and Africa Synthetic Graphite Market Volume Share (%), by Application 2025 & 2033
- Figure 59: Middle East and Africa Synthetic Graphite Market Revenue (billion), by Country 2025 & 2033
- Figure 60: Middle East and Africa Synthetic Graphite Market Volume (K Tons), by Country 2025 & 2033
- Figure 61: Middle East and Africa Synthetic Graphite Market Revenue Share (%), by Country 2025 & 2033
- Figure 62: Middle East and Africa Synthetic Graphite Market Volume Share (%), by Country 2025 & 2033
List of Tables
- Table 1: Global Synthetic Graphite Market Revenue billion Forecast, by Type 2020 & 2033
- Table 2: Global Synthetic Graphite Market Volume K Tons Forecast, by Type 2020 & 2033
- Table 3: Global Synthetic Graphite Market Revenue billion Forecast, by Application 2020 & 2033
- Table 4: Global Synthetic Graphite Market Volume K Tons Forecast, by Application 2020 & 2033
- Table 5: Global Synthetic Graphite Market Revenue billion Forecast, by Region 2020 & 2033
- Table 6: Global Synthetic Graphite Market Volume K Tons Forecast, by Region 2020 & 2033
- Table 7: Global Synthetic Graphite Market Revenue billion Forecast, by Type 2020 & 2033
- Table 8: Global Synthetic Graphite Market Volume K Tons Forecast, by Type 2020 & 2033
- Table 9: Global Synthetic Graphite Market Revenue billion Forecast, by Application 2020 & 2033
- Table 10: Global Synthetic Graphite Market Volume K Tons Forecast, by Application 2020 & 2033
- Table 11: Global Synthetic Graphite Market Revenue billion Forecast, by Country 2020 & 2033
- Table 12: Global Synthetic Graphite Market Volume K Tons Forecast, by Country 2020 & 2033
- Table 13: China Synthetic Graphite Market Revenue (billion) Forecast, by Application 2020 & 2033
- Table 14: China Synthetic Graphite Market Volume (K Tons) Forecast, by Application 2020 & 2033
- Table 15: India Synthetic Graphite Market Revenue (billion) Forecast, by Application 2020 & 2033
- Table 16: India Synthetic Graphite Market Volume (K Tons) Forecast, by Application 2020 & 2033
- Table 17: Japan Synthetic Graphite Market Revenue (billion) Forecast, by Application 2020 & 2033
- Table 18: Japan Synthetic Graphite Market Volume (K Tons) Forecast, by Application 2020 & 2033
- Table 19: South Korea Synthetic Graphite Market Revenue (billion) Forecast, by Application 2020 & 2033
- Table 20: South Korea Synthetic Graphite Market Volume (K Tons) Forecast, by Application 2020 & 2033
- Table 21: Asean Countries Synthetic Graphite Market Revenue (billion) Forecast, by Application 2020 & 2033
- Table 22: Asean Countries Synthetic Graphite Market Volume (K Tons) Forecast, by Application 2020 & 2033
- Table 23: Rest of Asia Pacific Synthetic Graphite Market Revenue (billion) Forecast, by Application 2020 & 2033
- Table 24: Rest of Asia Pacific Synthetic Graphite Market Volume (K Tons) Forecast, by Application 2020 & 2033
- Table 25: Global Synthetic Graphite Market Revenue billion Forecast, by Type 2020 & 2033
- Table 26: Global Synthetic Graphite Market Volume K Tons Forecast, by Type 2020 & 2033
- Table 27: Global Synthetic Graphite Market Revenue billion Forecast, by Application 2020 & 2033
- Table 28: Global Synthetic Graphite Market Volume K Tons Forecast, by Application 2020 & 2033
- Table 29: Global Synthetic Graphite Market Revenue billion Forecast, by Country 2020 & 2033
- Table 30: Global Synthetic Graphite Market Volume K Tons Forecast, by Country 2020 & 2033
- Table 31: United States Synthetic Graphite Market Revenue (billion) Forecast, by Application 2020 & 2033
- Table 32: United States Synthetic Graphite Market Volume (K Tons) Forecast, by Application 2020 & 2033
- Table 33: Canada Synthetic Graphite Market Revenue (billion) Forecast, by Application 2020 & 2033
- Table 34: Canada Synthetic Graphite Market Volume (K Tons) Forecast, by Application 2020 & 2033
- Table 35: Mexico Synthetic Graphite Market Revenue (billion) Forecast, by Application 2020 & 2033
- Table 36: Mexico Synthetic Graphite Market Volume (K Tons) Forecast, by Application 2020 & 2033
- Table 37: Global Synthetic Graphite Market Revenue billion Forecast, by Type 2020 & 2033
- Table 38: Global Synthetic Graphite Market Volume K Tons Forecast, by Type 2020 & 2033
- Table 39: Global Synthetic Graphite Market Revenue billion Forecast, by Application 2020 & 2033
- Table 40: Global Synthetic Graphite Market Volume K Tons Forecast, by Application 2020 & 2033
- Table 41: Global Synthetic Graphite Market Revenue billion Forecast, by Country 2020 & 2033
- Table 42: Global Synthetic Graphite Market Volume K Tons Forecast, by Country 2020 & 2033
- Table 43: Germany Synthetic Graphite Market Revenue (billion) Forecast, by Application 2020 & 2033
- Table 44: Germany Synthetic Graphite Market Volume (K Tons) Forecast, by Application 2020 & 2033
- Table 45: United Kingdom Synthetic Graphite Market Revenue (billion) Forecast, by Application 2020 & 2033
- Table 46: United Kingdom Synthetic Graphite Market Volume (K Tons) Forecast, by Application 2020 & 2033
- Table 47: Italy Synthetic Graphite Market Revenue (billion) Forecast, by Application 2020 & 2033
- Table 48: Italy Synthetic Graphite Market Volume (K Tons) Forecast, by Application 2020 & 2033
- Table 49: France Synthetic Graphite Market Revenue (billion) Forecast, by Application 2020 & 2033
- Table 50: France Synthetic Graphite Market Volume (K Tons) Forecast, by Application 2020 & 2033
- Table 51: Russia Synthetic Graphite Market Revenue (billion) Forecast, by Application 2020 & 2033
- Table 52: Russia Synthetic Graphite Market Volume (K Tons) Forecast, by Application 2020 & 2033
- Table 53: Rest of Europe Synthetic Graphite Market Revenue (billion) Forecast, by Application 2020 & 2033
- Table 54: Rest of Europe Synthetic Graphite Market Volume (K Tons) Forecast, by Application 2020 & 2033
- Table 55: Global Synthetic Graphite Market Revenue billion Forecast, by Type 2020 & 2033
- Table 56: Global Synthetic Graphite Market Volume K Tons Forecast, by Type 2020 & 2033
- Table 57: Global Synthetic Graphite Market Revenue billion Forecast, by Application 2020 & 2033
- Table 58: Global Synthetic Graphite Market Volume K Tons Forecast, by Application 2020 & 2033
- Table 59: Global Synthetic Graphite Market Revenue billion Forecast, by Country 2020 & 2033
- Table 60: Global Synthetic Graphite Market Volume K Tons Forecast, by Country 2020 & 2033
- Table 61: Brazil Synthetic Graphite Market Revenue (billion) Forecast, by Application 2020 & 2033
- Table 62: Brazil Synthetic Graphite Market Volume (K Tons) Forecast, by Application 2020 & 2033
- Table 63: Argentina Synthetic Graphite Market Revenue (billion) Forecast, by Application 2020 & 2033
- Table 64: Argentina Synthetic Graphite Market Volume (K Tons) Forecast, by Application 2020 & 2033
- Table 65: Rest of South America Synthetic Graphite Market Revenue (billion) Forecast, by Application 2020 & 2033
- Table 66: Rest of South America Synthetic Graphite Market Volume (K Tons) Forecast, by Application 2020 & 2033
- Table 67: Global Synthetic Graphite Market Revenue billion Forecast, by Type 2020 & 2033
- Table 68: Global Synthetic Graphite Market Volume K Tons Forecast, by Type 2020 & 2033
- Table 69: Global Synthetic Graphite Market Revenue billion Forecast, by Application 2020 & 2033
- Table 70: Global Synthetic Graphite Market Volume K Tons Forecast, by Application 2020 & 2033
- Table 71: Global Synthetic Graphite Market Revenue billion Forecast, by Country 2020 & 2033
- Table 72: Global Synthetic Graphite Market Volume K Tons Forecast, by Country 2020 & 2033
- Table 73: Saudi Arabia Synthetic Graphite Market Revenue (billion) Forecast, by Application 2020 & 2033
- Table 74: Saudi Arabia Synthetic Graphite Market Volume (K Tons) Forecast, by Application 2020 & 2033
- Table 75: South Africa Synthetic Graphite Market Revenue (billion) Forecast, by Application 2020 & 2033
- Table 76: South Africa Synthetic Graphite Market Volume (K Tons) Forecast, by Application 2020 & 2033
- Table 77: Rest of Middle East and Africa Synthetic Graphite Market Revenue (billion) Forecast, by Application 2020 & 2033
- Table 78: Rest of Middle East and Africa Synthetic Graphite Market Volume (K Tons) Forecast, by Application 2020 & 2033
Frequently Asked Questions
1. What is the projected Compound Annual Growth Rate (CAGR) of the Synthetic Graphite Market?
The projected CAGR is approximately 15.1%.
2. Which companies are prominent players in the Synthetic Graphite Market?
Key companies in the market include Mersen Property, Asbury Carbons, Shenzhen Sinuo Industrial Development Co Ltd, Resonac Holdings Corporation (Showa Denko KK), Shamokin Carbons, Mitsubishi Chemical Corporation, Nippon Carbon Co Ltd, Jiangxi Zichen Technology Co Ltd, Tokai Cobex GmbH, GrafTech International, BTR New Materials Group Co Ltd, Imerys, Shanghai Shanshan Technology Co Ltd, Graphit Kropfmhl GmbH, Graphite India Limited, Lianyungang Jinli Carbon Co Ltd.
3. What are the main segments of the Synthetic Graphite Market?
The market segments include Type, Application.
4. Can you provide details about the market size?
The market size is estimated to be USD 15.67 billion as of 2022.
5. What are some drivers contributing to market growth?
Increasing Demand for Electric Vehicles; Growing Utilization of Electric ARC Furnace Process for Steel Production.
6. What are the notable trends driving market growth?
Metallurgy Segment to Drive the Market.
7. Are there any restraints impacting market growth?
Stringent Environmental Regulations; Decreasing Production of Steel.
8. Can you provide examples of recent developments in the market?
October 2022: Imerys Imerys Graphite & Carbon Company announced the launch of a landmark lithium exploitation project ('the EMILI Project'). It may significantly reduce the need to import lithium and aid in producing nearly 700,000 electric vehicle batteries annually.
9. What pricing options are available for accessing the report?
Pricing options include single-user, multi-user, and enterprise licenses priced at USD 4750, USD 5250, and USD 8750 respectively.
10. Is the market size provided in terms of value or volume?
The market size is provided in terms of value, measured in billion and volume, measured in K Tons.
11. Are there any specific market keywords associated with the report?
Yes, the market keyword associated with the report is "Synthetic Graphite Market," which aids in identifying and referencing the specific market segment covered.
12. How do I determine which pricing option suits my needs best?
The pricing options vary based on user requirements and access needs. Individual users may opt for single-user licenses, while businesses requiring broader access may choose multi-user or enterprise licenses for cost-effective access to the report.
13. Are there any additional resources or data provided in the Synthetic Graphite Market report?
While the report offers comprehensive insights, it's advisable to review the specific contents or supplementary materials provided to ascertain if additional resources or data are available.
14. How can I stay updated on further developments or reports in the Synthetic Graphite Market?
To stay informed about further developments, trends, and reports in the Synthetic Graphite Market, consider subscribing to industry newsletters, following relevant companies and organizations, or regularly checking reputable industry news sources and publications.
Methodology
Step 1 - Identification of Relevant Samples Size from Population Database


Step 2 - Approaches for Defining Global Market Size (Value, Volume* & Price*)

Note*: In applicable scenarios
Step 3 - Data Sources
Primary Research
- Web Analytics
- Survey Reports
- Research Institute
- Latest Research Reports
- Opinion Leaders
Secondary Research
- Annual Reports
- White Paper
- Latest Press Release
- Industry Association
- Paid Database
- Investor Presentations

Step 4 - Data Triangulation
Involves using different sources of information in order to increase the validity of a study
These sources are likely to be stakeholders in a program - participants, other researchers, program staff, other community members, and so on.
Then we put all data in single framework & apply various statistical tools to find out the dynamic on the market.
During the analysis stage, feedback from the stakeholder groups would be compared to determine areas of agreement as well as areas of divergence