

Key Insights
The global Tall Oil Fatty Acid (TOFA) market is poised for significant expansion, with a projected Compound Annual Growth Rate (CAGR) of 4.66% between 2025 and 2033. This robust growth is primarily attributed to escalating demand from critical end-user sectors including paints & coatings, soaps & detergents, and the rapidly advancing bio-based chemicals industry. The growing consumer and industrial preference for sustainable and renewable materials is a key driver, positioning TOFA, a valuable byproduct of the pulp and paper industry, as an eco-friendly substitute for petroleum-based alternatives across diverse applications. Innovations in TOFA-based product development, offering enhanced biodegradability and superior viscosity, further bolster market expansion. Despite these positive trends, price volatility associated with raw material costs and pulp & paper industry fluctuations present ongoing challenges. Market segmentation highlights oleic acid and linoleic acid as dominant product types, while alkyd resins lead application segments. Geographically, North America and Europe currently command significant market shares, with the Asia-Pacific region expected to witness substantial growth driven by its burgeoning manufacturing and construction activities. The competitive environment comprises both large-scale multinational chemical corporations and agile regional players, with strategic collaborations and dedicated R&D investments being pivotal for product enhancement and market penetration.
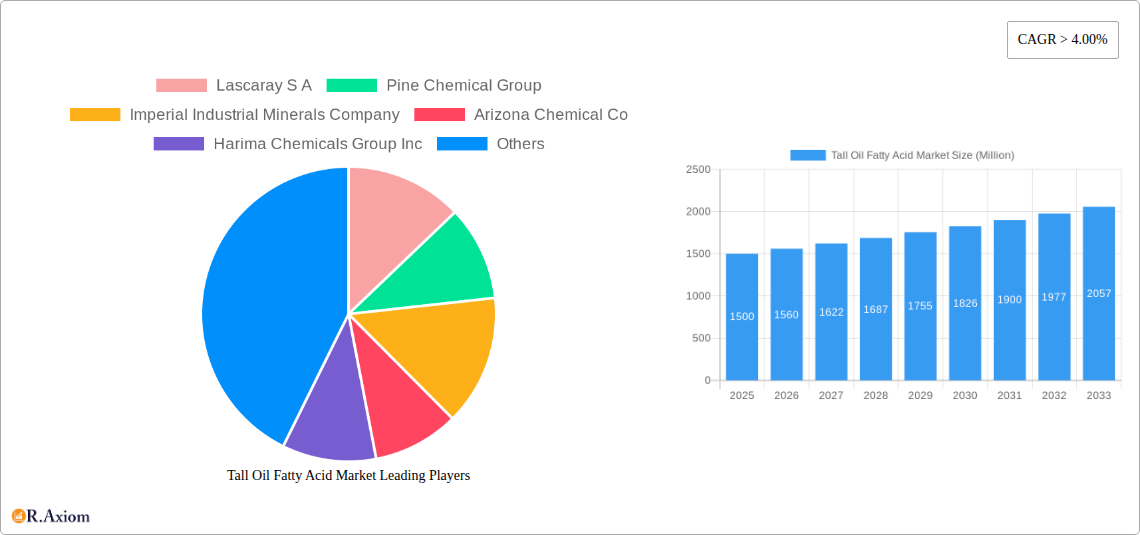
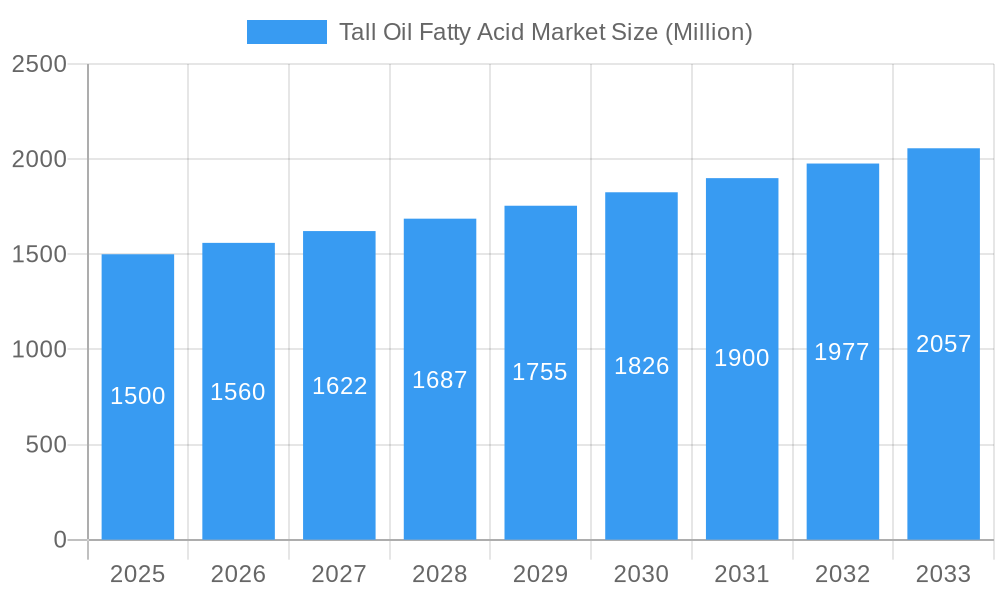
Tall Oil Fatty Acid Market Market Size (In Million)
The TOFA market's upward trajectory is underpinned by several key factors. The pervasive shift towards environmentally conscious products is a powerful catalyst for demand. Furthermore, continuous research and development into novel TOFA applications are expected to unlock new growth avenues. The increasing adoption of TOFA across various industries signals a sustained positive long-term outlook. However, effective management of raw material price volatility remains critical for ensuring sustained profitability. Moreover, technological advancements and forward-thinking product innovation will be instrumental for companies seeking to secure a competitive advantage in this dynamic market. Strategic regional expansion, particularly within the Asia-Pacific market, represents a significant opportunity for increased market share and overall growth. The current market size is estimated at 4.82 million, with the base year being 2025.
Tall Oil Fatty Acid Market Company Market Share
Comprehensive Report: Tall Oil Fatty Acid Market - A Deep Dive into Growth, Trends, and Opportunities (2019-2033)
This in-depth report provides a comprehensive analysis of the global Tall Oil Fatty Acid market, offering crucial insights for industry stakeholders, investors, and strategic decision-makers. The study period covers 2019-2033, with 2025 as the base and estimated year, and a forecast period of 2025-2033. The historical period analyzed is 2019-2024. This report leverages extensive primary and secondary research to deliver actionable intelligence, encompassing market size estimations, segment-wise analysis, competitive landscape, and future growth projections in Millions.
Tall Oil Fatty Acid Market Concentration & Innovation
This section analyzes the competitive landscape of the Tall Oil Fatty Acid market, exploring market concentration, innovation drivers, regulatory frameworks, product substitutes, end-user trends, and M&A activities. The market is characterized by a moderately concentrated structure, with the top five players holding an estimated xx% market share in 2025. Key players are constantly striving for innovation, focusing on developing sustainable and high-performance products.
- Market Concentration: The Herfindahl-Hirschman Index (HHI) is estimated at xx in 2025, indicating a moderately concentrated market.
- Innovation Drivers: The push for bio-based and renewable alternatives, coupled with stringent environmental regulations, is driving innovation in Tall Oil Fatty Acid production and application.
- Regulatory Frameworks: Regulations concerning the use of chemicals and sustainability are influencing product development and market dynamics. Compliance costs and evolving standards are significant factors.
- Product Substitutes: Competition arises from alternative fatty acids and bio-based materials. The report analyzes the impact of these substitutes on market share and pricing.
- End-User Trends: Growing demand from the paints and coatings, soaps and detergents, and automotive sectors are primary market drivers. Shifting preferences towards sustainable products are impacting market growth.
- M&A Activities: The report details recent mergers and acquisitions within the industry, analyzing their impact on market concentration and competitive dynamics. Total M&A deal value in the last five years is estimated at $xx Million. Key examples include [Specific examples of M&A activities with deal values if available].
Tall Oil Fatty Acid Market Industry Trends & Insights
This section delves into the key trends shaping the Tall Oil Fatty Acid market, including market growth drivers, technological disruptions, consumer preferences, and competitive dynamics. The global Tall Oil Fatty Acid market is projected to witness robust growth, with a CAGR of xx% during the forecast period (2025-2033). This growth is fueled by increasing demand from various end-use industries, particularly in emerging economies. Technological advancements are enhancing production efficiency and product performance, further contributing to market expansion. Consumer preference for environmentally friendly products is also positively impacting market growth. However, fluctuations in raw material prices and economic downturns pose potential challenges. Market penetration of Tall Oil Fatty Acids in specific applications such as bioplastics is also assessed, with projected penetration rates of xx% by 2033.
Dominant Markets & Segments in Tall Oil Fatty Acid Market
This section identifies the dominant regions, countries, and segments within the Tall Oil Fatty Acid market.
By Product Type:
- Oleic Acid: This segment holds the largest market share, driven by its versatile applications across various industries.
- Linoleic Acid: Demand for Linoleic Acid is significant due to its use in specific applications.
- Linolenic Acid: This segment experiences moderate growth, fueled by its unique properties.
- Palmitic Acid: The market for Palmitic Acid exhibits steady growth.
- Other Product Types: This segment comprises various other fatty acids and displays promising growth potential.
By Application:
- Alkyd Resins: This application accounts for a significant portion of the market share.
- Dimer Acids: Growing demand from the coatings industry drives the growth of this segment.
- Fatty Acid Ester: This segment witnesses consistent growth, driven by its applications in various industries.
- Other Applications: This segment includes niche applications with moderate growth potential.
By End-user Industry:
- Soaps and Detergents: This segment remains a major consumer of Tall Oil Fatty Acids.
- Paints and Coatings: Strong growth in this sector drives substantial demand.
- Automotive: Demand from the automotive industry is significant and projected to grow steadily.
- Metal Working Fluids: This application segment presents a stable market.
- Oil and Gas: This sector presents a niche application for Tall Oil Fatty Acids.
- Other End-user Industries: This segment encompasses various other industries with moderate growth.
Dominant Regions: [Specify the leading region/country and provide detailed analysis of factors contributing to dominance. Include bullet points for key drivers like economic policies, infrastructure, etc.]. For example, North America currently holds a dominant position due to factors such as [specific reasons]. However, Asia-Pacific is projected to experience the fastest growth in the coming years driven by [specific reasons].
Tall Oil Fatty Acid Market Product Developments
Recent product innovations focus on enhancing the sustainability, biodegradability, and performance characteristics of Tall Oil Fatty Acids. Manufacturers are investing in advanced technologies to improve production efficiency and reduce environmental impact. This includes exploring novel extraction methods and developing tailored products to meet specific end-user requirements. New applications are constantly being explored, expanding the market reach of Tall Oil Fatty Acids. This also includes the development of high-performance variants catering to specific industrial needs and creating a competitive edge.
Report Scope & Segmentation Analysis
This report provides a detailed segmentation analysis of the Tall Oil Fatty Acid market based on product type (Oleic Acid, Linoleic Acid, Linolenic Acid, Palmitic Acid, Other Product Types), application (Alkyd Resins, Dimer Acids, Fatty Acid Ester, Other Applications), and end-user industry (Soaps and Detergents, Paints and Coatings, Automotive, Metal Working Fluids, Oil and Gas, Other End-user Industries). Each segment's growth projections, market size, and competitive dynamics are analyzed.
Key Drivers of Tall Oil Fatty Acid Market Growth
The Tall Oil Fatty Acid market's growth is primarily driven by several factors, including the increasing demand for bio-based and renewable materials, stringent environmental regulations promoting sustainable alternatives, and advancements in production technologies leading to cost-effective and efficient manufacturing processes. Furthermore, the growing demand from diverse end-use industries, such as paints and coatings, soaps and detergents, and automotive, further propels market expansion.
Challenges in the Tall Oil Fatty Acid Market Sector
The Tall Oil Fatty Acid market faces challenges such as fluctuations in raw material prices, competition from synthetic alternatives, and stringent regulatory compliance requirements. Supply chain disruptions and the impact of global economic conditions also pose significant risks to market stability. These factors can affect profitability and hamper market growth.
Emerging Opportunities in Tall Oil Fatty Acid Market
Emerging opportunities exist in developing sustainable and high-performance Tall Oil Fatty Acid derivatives for niche applications in the bioplastics, biofuels, and personal care industries. The market is ripe for innovation and product diversification to cater to the growing demand for eco-friendly alternatives.
Leading Players in the Tall Oil Fatty Acid Market Market
- Lascaray S A
- Pine Chemical Group
- Imperial Industrial Minerals Company
- Arizona Chemical Co
- Harima Chemicals Group Inc
- Eastman Chemical Company
- Ingevity
- Segezha-Group
- Forchem Oyj
- Ilim Group
- KRATON CORPORATION
- UNIVAR SOLUTIONS
- Shaxian Lixin Resin Co Ltd
- Foreverest Resources Ltd
- Pasand Speciality Chemicals
- Ataman Kimya
- G C Rutteman & Co B V
Key Developments in Tall Oil Fatty Acid Market Industry
- [List key developments with year/month, emphasizing their impact. Examples: New product launches, mergers and acquisitions, expansion into new markets, technological advancements.]
Strategic Outlook for Tall Oil Fatty Acid Market Market
The Tall Oil Fatty Acid market presents significant growth potential driven by increasing demand for sustainable and renewable materials. Continued innovation, focusing on product diversification and expansion into new applications, will be crucial for players to maintain a competitive edge. The market is expected to witness considerable expansion in the coming years, fueled by factors such as [mention specific catalysts].
Tall Oil Fatty Acid Market Segmentation
-
1. Product Type
- 1.1. Oleic Acid
- 1.2. Linoleic Acid
- 1.3. Linolenic Acid
- 1.4. Palmitic Acid
- 1.5. Other Product Types
-
2. Application
- 2.1. Alkyd Resins
- 2.2. Dimer Acids
- 2.3. Fatty Acid Ester
- 2.4. Other Applications
-
3. End-user Industry
- 3.1. Soaps and Detergents
- 3.2. Paints and Coatings
- 3.3. Automotive
- 3.4. Metal Working Fluids
- 3.5. Oil and Gas
- 3.6. Other End-user Industries
Tall Oil Fatty Acid Market Segmentation By Geography
-
1. Asia Pacific
- 1.1. China
- 1.2. India
- 1.3. Japan
- 1.4. South Korea
- 1.5. Rest of Asia Pacific
-
2. North America
- 2.1. United States
- 2.2. Canada
- 2.3. Mexico
-
3. Europe
- 3.1. Germany
- 3.2. United Kingdom
- 3.3. Italy
- 3.4. France
- 3.5. Rest of Europe
-
4. South America
- 4.1. Brazil
- 4.2. Argentina
- 4.3. Rest of South America
-
5. Middle East and Africa
- 5.1. Saudi Arabia
- 5.2. South Africa
- 5.3. Rest of Middle East and Africa
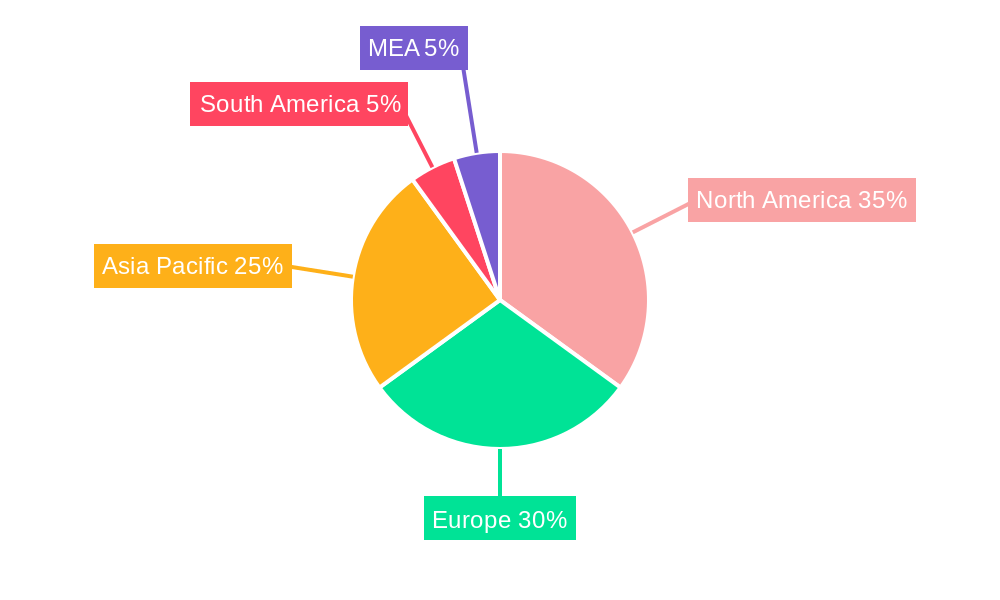
Tall Oil Fatty Acid Market Regional Market Share
Geographic Coverage of Tall Oil Fatty Acid Market
Tall Oil Fatty Acid Market REPORT HIGHLIGHTS
| Aspects | Details |
|---|---|
| Study Period | 2020-2034 |
| Base Year | 2025 |
| Estimated Year | 2026 |
| Forecast Period | 2026-2034 |
| Historical Period | 2020-2025 |
| Growth Rate | CAGR of 4.66% from 2020-2034 |
| Segmentation |
|
Table of Contents
- 1. Introduction
- 1.1. Research Scope
- 1.2. Market Segmentation
- 1.3. Research Objective
- 1.4. Definitions and Assumptions
- 2. Executive Summary
- 2.1. Market Snapshot
- 3. Market Dynamics
- 3.1. Market Drivers
- 3.2. Market Restrains
- 3.3. Market Trends
- 3.4. Market Opportunities
- 4. Market Factor Analysis
- 4.1. Porters Five Forces
- 4.1.1. Bargaining Power of Suppliers
- 4.1.2. Bargaining Power of Buyers
- 4.1.3. Threat of New Entrants
- 4.1.4. Threat of Substitutes
- 4.1.5. Competitive Rivalry
- 4.2. PESTEL analysis
- 4.3. BCG Analysis
- 4.3.1. Stars (High Growth, High Market Share)
- 4.3.2. Cash Cows (Low Growth, High Market Share)
- 4.3.3. Question Mark (High Growth, Low Market Share)
- 4.3.4. Dogs (Low Growth, Low Market Share)
- 4.4. Ansoff Matrix Analysis
- 4.5. Supply Chain Analysis
- 4.6. Regulatory Landscape
- 4.7. Current Market Potential and Opportunity Assessment (TAM–SAM–SOM Framework)
- 4.8. RAX Analyst Note
- 4.1. Porters Five Forces
- 5. Market Analysis, Insights and Forecast 2021-2033
- 5.1. Market Analysis, Insights and Forecast - by Product Type
- 5.1.1. Oleic Acid
- 5.1.2. Linoleic Acid
- 5.1.3. Linolenic Acid
- 5.1.4. Palmitic Acid
- 5.1.5. Other Product Types
- 5.2. Market Analysis, Insights and Forecast - by Application
- 5.2.1. Alkyd Resins
- 5.2.2. Dimer Acids
- 5.2.3. Fatty Acid Ester
- 5.2.4. Other Applications
- 5.3. Market Analysis, Insights and Forecast - by End-user Industry
- 5.3.1. Soaps and Detergents
- 5.3.2. Paints and Coatings
- 5.3.3. Automotive
- 5.3.4. Metal Working Fluids
- 5.3.5. Oil and Gas
- 5.3.6. Other End-user Industries
- 5.4. Market Analysis, Insights and Forecast - by Region
- 5.4.1. Asia Pacific
- 5.4.2. North America
- 5.4.3. Europe
- 5.4.4. South America
- 5.4.5. Middle East and Africa
- 5.1. Market Analysis, Insights and Forecast - by Product Type
- 6. Global Tall Oil Fatty Acid Market Analysis, Insights and Forecast, 2021-2033
- 6.1. Market Analysis, Insights and Forecast - by Product Type
- 6.1.1. Oleic Acid
- 6.1.2. Linoleic Acid
- 6.1.3. Linolenic Acid
- 6.1.4. Palmitic Acid
- 6.1.5. Other Product Types
- 6.2. Market Analysis, Insights and Forecast - by Application
- 6.2.1. Alkyd Resins
- 6.2.2. Dimer Acids
- 6.2.3. Fatty Acid Ester
- 6.2.4. Other Applications
- 6.3. Market Analysis, Insights and Forecast - by End-user Industry
- 6.3.1. Soaps and Detergents
- 6.3.2. Paints and Coatings
- 6.3.3. Automotive
- 6.3.4. Metal Working Fluids
- 6.3.5. Oil and Gas
- 6.3.6. Other End-user Industries
- 6.1. Market Analysis, Insights and Forecast - by Product Type
- 7. Asia Pacific Tall Oil Fatty Acid Market Analysis, Insights and Forecast, 2020-2032
- 7.1. Market Analysis, Insights and Forecast - by Product Type
- 7.1.1. Oleic Acid
- 7.1.2. Linoleic Acid
- 7.1.3. Linolenic Acid
- 7.1.4. Palmitic Acid
- 7.1.5. Other Product Types
- 7.2. Market Analysis, Insights and Forecast - by Application
- 7.2.1. Alkyd Resins
- 7.2.2. Dimer Acids
- 7.2.3. Fatty Acid Ester
- 7.2.4. Other Applications
- 7.3. Market Analysis, Insights and Forecast - by End-user Industry
- 7.3.1. Soaps and Detergents
- 7.3.2. Paints and Coatings
- 7.3.3. Automotive
- 7.3.4. Metal Working Fluids
- 7.3.5. Oil and Gas
- 7.3.6. Other End-user Industries
- 7.1. Market Analysis, Insights and Forecast - by Product Type
- 8. North America Tall Oil Fatty Acid Market Analysis, Insights and Forecast, 2020-2032
- 8.1. Market Analysis, Insights and Forecast - by Product Type
- 8.1.1. Oleic Acid
- 8.1.2. Linoleic Acid
- 8.1.3. Linolenic Acid
- 8.1.4. Palmitic Acid
- 8.1.5. Other Product Types
- 8.2. Market Analysis, Insights and Forecast - by Application
- 8.2.1. Alkyd Resins
- 8.2.2. Dimer Acids
- 8.2.3. Fatty Acid Ester
- 8.2.4. Other Applications
- 8.3. Market Analysis, Insights and Forecast - by End-user Industry
- 8.3.1. Soaps and Detergents
- 8.3.2. Paints and Coatings
- 8.3.3. Automotive
- 8.3.4. Metal Working Fluids
- 8.3.5. Oil and Gas
- 8.3.6. Other End-user Industries
- 8.1. Market Analysis, Insights and Forecast - by Product Type
- 9. Europe Tall Oil Fatty Acid Market Analysis, Insights and Forecast, 2020-2032
- 9.1. Market Analysis, Insights and Forecast - by Product Type
- 9.1.1. Oleic Acid
- 9.1.2. Linoleic Acid
- 9.1.3. Linolenic Acid
- 9.1.4. Palmitic Acid
- 9.1.5. Other Product Types
- 9.2. Market Analysis, Insights and Forecast - by Application
- 9.2.1. Alkyd Resins
- 9.2.2. Dimer Acids
- 9.2.3. Fatty Acid Ester
- 9.2.4. Other Applications
- 9.3. Market Analysis, Insights and Forecast - by End-user Industry
- 9.3.1. Soaps and Detergents
- 9.3.2. Paints and Coatings
- 9.3.3. Automotive
- 9.3.4. Metal Working Fluids
- 9.3.5. Oil and Gas
- 9.3.6. Other End-user Industries
- 9.1. Market Analysis, Insights and Forecast - by Product Type
- 10. South America Tall Oil Fatty Acid Market Analysis, Insights and Forecast, 2020-2032
- 10.1. Market Analysis, Insights and Forecast - by Product Type
- 10.1.1. Oleic Acid
- 10.1.2. Linoleic Acid
- 10.1.3. Linolenic Acid
- 10.1.4. Palmitic Acid
- 10.1.5. Other Product Types
- 10.2. Market Analysis, Insights and Forecast - by Application
- 10.2.1. Alkyd Resins
- 10.2.2. Dimer Acids
- 10.2.3. Fatty Acid Ester
- 10.2.4. Other Applications
- 10.3. Market Analysis, Insights and Forecast - by End-user Industry
- 10.3.1. Soaps and Detergents
- 10.3.2. Paints and Coatings
- 10.3.3. Automotive
- 10.3.4. Metal Working Fluids
- 10.3.5. Oil and Gas
- 10.3.6. Other End-user Industries
- 10.1. Market Analysis, Insights and Forecast - by Product Type
- 11. Middle East and Africa Tall Oil Fatty Acid Market Analysis, Insights and Forecast, 2020-2032
- 11.1. Market Analysis, Insights and Forecast - by Product Type
- 11.1.1. Oleic Acid
- 11.1.2. Linoleic Acid
- 11.1.3. Linolenic Acid
- 11.1.4. Palmitic Acid
- 11.1.5. Other Product Types
- 11.2. Market Analysis, Insights and Forecast - by Application
- 11.2.1. Alkyd Resins
- 11.2.2. Dimer Acids
- 11.2.3. Fatty Acid Ester
- 11.2.4. Other Applications
- 11.3. Market Analysis, Insights and Forecast - by End-user Industry
- 11.3.1. Soaps and Detergents
- 11.3.2. Paints and Coatings
- 11.3.3. Automotive
- 11.3.4. Metal Working Fluids
- 11.3.5. Oil and Gas
- 11.3.6. Other End-user Industries
- 11.1. Market Analysis, Insights and Forecast - by Product Type
- 12. Competitive Analysis
- 12.1. Company Profiles
- 12.1.1 Lascaray S A
- 12.1.1.1. Company Overview
- 12.1.1.2. Products
- 12.1.1.3. Company Financials
- 12.1.1.4. SWOT Analysis
- 12.1.2 Pine Chemical Group
- 12.1.2.1. Company Overview
- 12.1.2.2. Products
- 12.1.2.3. Company Financials
- 12.1.2.4. SWOT Analysis
- 12.1.3 Imperial Industrial Minerals Company
- 12.1.3.1. Company Overview
- 12.1.3.2. Products
- 12.1.3.3. Company Financials
- 12.1.3.4. SWOT Analysis
- 12.1.4 Arizona Chemical Co
- 12.1.4.1. Company Overview
- 12.1.4.2. Products
- 12.1.4.3. Company Financials
- 12.1.4.4. SWOT Analysis
- 12.1.5 Harima Chemicals Group Inc
- 12.1.5.1. Company Overview
- 12.1.5.2. Products
- 12.1.5.3. Company Financials
- 12.1.5.4. SWOT Analysis
- 12.1.6 Eastman Chemical Company
- 12.1.6.1. Company Overview
- 12.1.6.2. Products
- 12.1.6.3. Company Financials
- 12.1.6.4. SWOT Analysis
- 12.1.7 Ingevity
- 12.1.7.1. Company Overview
- 12.1.7.2. Products
- 12.1.7.3. Company Financials
- 12.1.7.4. SWOT Analysis
- 12.1.8 Segezha-Group
- 12.1.8.1. Company Overview
- 12.1.8.2. Products
- 12.1.8.3. Company Financials
- 12.1.8.4. SWOT Analysis
- 12.1.9 Forchem Oyj
- 12.1.9.1. Company Overview
- 12.1.9.2. Products
- 12.1.9.3. Company Financials
- 12.1.9.4. SWOT Analysis
- 12.1.10 Ilim Group
- 12.1.10.1. Company Overview
- 12.1.10.2. Products
- 12.1.10.3. Company Financials
- 12.1.10.4. SWOT Analysis
- 12.1.11 KRATON CORPORATION
- 12.1.11.1. Company Overview
- 12.1.11.2. Products
- 12.1.11.3. Company Financials
- 12.1.11.4. SWOT Analysis
- 12.1.12 UNIVAR SOLUTIONS
- 12.1.12.1. Company Overview
- 12.1.12.2. Products
- 12.1.12.3. Company Financials
- 12.1.12.4. SWOT Analysis
- 12.1.13 Shaxian Lixin Resin Co Ltd
- 12.1.13.1. Company Overview
- 12.1.13.2. Products
- 12.1.13.3. Company Financials
- 12.1.13.4. SWOT Analysis
- 12.1.14 Foreverest Resources Ltd
- 12.1.14.1. Company Overview
- 12.1.14.2. Products
- 12.1.14.3. Company Financials
- 12.1.14.4. SWOT Analysis
- 12.1.15 Pasand Speciality Chemicals
- 12.1.15.1. Company Overview
- 12.1.15.2. Products
- 12.1.15.3. Company Financials
- 12.1.15.4. SWOT Analysis
- 12.1.16 Ataman Kimya
- 12.1.16.1. Company Overview
- 12.1.16.2. Products
- 12.1.16.3. Company Financials
- 12.1.16.4. SWOT Analysis
- 12.1.17 G C Rutteman & Co B V
- 12.1.17.1. Company Overview
- 12.1.17.2. Products
- 12.1.17.3. Company Financials
- 12.1.17.4. SWOT Analysis
- 12.1.1 Lascaray S A
- 12.2. Market Entropy
- 12.2.1 Company's Key Areas Served
- 12.2.2 Recent Developments
- 12.3. Company Market Share Analysis 2025
- 12.3.1 Top 5 Companies Market Share Analysis
- 12.3.2 Top 3 Companies Market Share Analysis
- 12.4. List of Potential Customers
- 13. Research Methodology
List of Figures
- Figure 1: Global Tall Oil Fatty Acid Market Revenue Breakdown (million, %) by Region 2025 & 2033
- Figure 2: Global Tall Oil Fatty Acid Market Volume Breakdown (K Tons, %) by Region 2025 & 2033
- Figure 3: Asia Pacific Tall Oil Fatty Acid Market Revenue (million), by Product Type 2025 & 2033
- Figure 4: Asia Pacific Tall Oil Fatty Acid Market Volume (K Tons), by Product Type 2025 & 2033
- Figure 5: Asia Pacific Tall Oil Fatty Acid Market Revenue Share (%), by Product Type 2025 & 2033
- Figure 6: Asia Pacific Tall Oil Fatty Acid Market Volume Share (%), by Product Type 2025 & 2033
- Figure 7: Asia Pacific Tall Oil Fatty Acid Market Revenue (million), by Application 2025 & 2033
- Figure 8: Asia Pacific Tall Oil Fatty Acid Market Volume (K Tons), by Application 2025 & 2033
- Figure 9: Asia Pacific Tall Oil Fatty Acid Market Revenue Share (%), by Application 2025 & 2033
- Figure 10: Asia Pacific Tall Oil Fatty Acid Market Volume Share (%), by Application 2025 & 2033
- Figure 11: Asia Pacific Tall Oil Fatty Acid Market Revenue (million), by End-user Industry 2025 & 2033
- Figure 12: Asia Pacific Tall Oil Fatty Acid Market Volume (K Tons), by End-user Industry 2025 & 2033
- Figure 13: Asia Pacific Tall Oil Fatty Acid Market Revenue Share (%), by End-user Industry 2025 & 2033
- Figure 14: Asia Pacific Tall Oil Fatty Acid Market Volume Share (%), by End-user Industry 2025 & 2033
- Figure 15: Asia Pacific Tall Oil Fatty Acid Market Revenue (million), by Country 2025 & 2033
- Figure 16: Asia Pacific Tall Oil Fatty Acid Market Volume (K Tons), by Country 2025 & 2033
- Figure 17: Asia Pacific Tall Oil Fatty Acid Market Revenue Share (%), by Country 2025 & 2033
- Figure 18: Asia Pacific Tall Oil Fatty Acid Market Volume Share (%), by Country 2025 & 2033
- Figure 19: North America Tall Oil Fatty Acid Market Revenue (million), by Product Type 2025 & 2033
- Figure 20: North America Tall Oil Fatty Acid Market Volume (K Tons), by Product Type 2025 & 2033
- Figure 21: North America Tall Oil Fatty Acid Market Revenue Share (%), by Product Type 2025 & 2033
- Figure 22: North America Tall Oil Fatty Acid Market Volume Share (%), by Product Type 2025 & 2033
- Figure 23: North America Tall Oil Fatty Acid Market Revenue (million), by Application 2025 & 2033
- Figure 24: North America Tall Oil Fatty Acid Market Volume (K Tons), by Application 2025 & 2033
- Figure 25: North America Tall Oil Fatty Acid Market Revenue Share (%), by Application 2025 & 2033
- Figure 26: North America Tall Oil Fatty Acid Market Volume Share (%), by Application 2025 & 2033
- Figure 27: North America Tall Oil Fatty Acid Market Revenue (million), by End-user Industry 2025 & 2033
- Figure 28: North America Tall Oil Fatty Acid Market Volume (K Tons), by End-user Industry 2025 & 2033
- Figure 29: North America Tall Oil Fatty Acid Market Revenue Share (%), by End-user Industry 2025 & 2033
- Figure 30: North America Tall Oil Fatty Acid Market Volume Share (%), by End-user Industry 2025 & 2033
- Figure 31: North America Tall Oil Fatty Acid Market Revenue (million), by Country 2025 & 2033
- Figure 32: North America Tall Oil Fatty Acid Market Volume (K Tons), by Country 2025 & 2033
- Figure 33: North America Tall Oil Fatty Acid Market Revenue Share (%), by Country 2025 & 2033
- Figure 34: North America Tall Oil Fatty Acid Market Volume Share (%), by Country 2025 & 2033
- Figure 35: Europe Tall Oil Fatty Acid Market Revenue (million), by Product Type 2025 & 2033
- Figure 36: Europe Tall Oil Fatty Acid Market Volume (K Tons), by Product Type 2025 & 2033
- Figure 37: Europe Tall Oil Fatty Acid Market Revenue Share (%), by Product Type 2025 & 2033
- Figure 38: Europe Tall Oil Fatty Acid Market Volume Share (%), by Product Type 2025 & 2033
- Figure 39: Europe Tall Oil Fatty Acid Market Revenue (million), by Application 2025 & 2033
- Figure 40: Europe Tall Oil Fatty Acid Market Volume (K Tons), by Application 2025 & 2033
- Figure 41: Europe Tall Oil Fatty Acid Market Revenue Share (%), by Application 2025 & 2033
- Figure 42: Europe Tall Oil Fatty Acid Market Volume Share (%), by Application 2025 & 2033
- Figure 43: Europe Tall Oil Fatty Acid Market Revenue (million), by End-user Industry 2025 & 2033
- Figure 44: Europe Tall Oil Fatty Acid Market Volume (K Tons), by End-user Industry 2025 & 2033
- Figure 45: Europe Tall Oil Fatty Acid Market Revenue Share (%), by End-user Industry 2025 & 2033
- Figure 46: Europe Tall Oil Fatty Acid Market Volume Share (%), by End-user Industry 2025 & 2033
- Figure 47: Europe Tall Oil Fatty Acid Market Revenue (million), by Country 2025 & 2033
- Figure 48: Europe Tall Oil Fatty Acid Market Volume (K Tons), by Country 2025 & 2033
- Figure 49: Europe Tall Oil Fatty Acid Market Revenue Share (%), by Country 2025 & 2033
- Figure 50: Europe Tall Oil Fatty Acid Market Volume Share (%), by Country 2025 & 2033
- Figure 51: South America Tall Oil Fatty Acid Market Revenue (million), by Product Type 2025 & 2033
- Figure 52: South America Tall Oil Fatty Acid Market Volume (K Tons), by Product Type 2025 & 2033
- Figure 53: South America Tall Oil Fatty Acid Market Revenue Share (%), by Product Type 2025 & 2033
- Figure 54: South America Tall Oil Fatty Acid Market Volume Share (%), by Product Type 2025 & 2033
- Figure 55: South America Tall Oil Fatty Acid Market Revenue (million), by Application 2025 & 2033
- Figure 56: South America Tall Oil Fatty Acid Market Volume (K Tons), by Application 2025 & 2033
- Figure 57: South America Tall Oil Fatty Acid Market Revenue Share (%), by Application 2025 & 2033
- Figure 58: South America Tall Oil Fatty Acid Market Volume Share (%), by Application 2025 & 2033
- Figure 59: South America Tall Oil Fatty Acid Market Revenue (million), by End-user Industry 2025 & 2033
- Figure 60: South America Tall Oil Fatty Acid Market Volume (K Tons), by End-user Industry 2025 & 2033
- Figure 61: South America Tall Oil Fatty Acid Market Revenue Share (%), by End-user Industry 2025 & 2033
- Figure 62: South America Tall Oil Fatty Acid Market Volume Share (%), by End-user Industry 2025 & 2033
- Figure 63: South America Tall Oil Fatty Acid Market Revenue (million), by Country 2025 & 2033
- Figure 64: South America Tall Oil Fatty Acid Market Volume (K Tons), by Country 2025 & 2033
- Figure 65: South America Tall Oil Fatty Acid Market Revenue Share (%), by Country 2025 & 2033
- Figure 66: South America Tall Oil Fatty Acid Market Volume Share (%), by Country 2025 & 2033
- Figure 67: Middle East and Africa Tall Oil Fatty Acid Market Revenue (million), by Product Type 2025 & 2033
- Figure 68: Middle East and Africa Tall Oil Fatty Acid Market Volume (K Tons), by Product Type 2025 & 2033
- Figure 69: Middle East and Africa Tall Oil Fatty Acid Market Revenue Share (%), by Product Type 2025 & 2033
- Figure 70: Middle East and Africa Tall Oil Fatty Acid Market Volume Share (%), by Product Type 2025 & 2033
- Figure 71: Middle East and Africa Tall Oil Fatty Acid Market Revenue (million), by Application 2025 & 2033
- Figure 72: Middle East and Africa Tall Oil Fatty Acid Market Volume (K Tons), by Application 2025 & 2033
- Figure 73: Middle East and Africa Tall Oil Fatty Acid Market Revenue Share (%), by Application 2025 & 2033
- Figure 74: Middle East and Africa Tall Oil Fatty Acid Market Volume Share (%), by Application 2025 & 2033
- Figure 75: Middle East and Africa Tall Oil Fatty Acid Market Revenue (million), by End-user Industry 2025 & 2033
- Figure 76: Middle East and Africa Tall Oil Fatty Acid Market Volume (K Tons), by End-user Industry 2025 & 2033
- Figure 77: Middle East and Africa Tall Oil Fatty Acid Market Revenue Share (%), by End-user Industry 2025 & 2033
- Figure 78: Middle East and Africa Tall Oil Fatty Acid Market Volume Share (%), by End-user Industry 2025 & 2033
- Figure 79: Middle East and Africa Tall Oil Fatty Acid Market Revenue (million), by Country 2025 & 2033
- Figure 80: Middle East and Africa Tall Oil Fatty Acid Market Volume (K Tons), by Country 2025 & 2033
- Figure 81: Middle East and Africa Tall Oil Fatty Acid Market Revenue Share (%), by Country 2025 & 2033
- Figure 82: Middle East and Africa Tall Oil Fatty Acid Market Volume Share (%), by Country 2025 & 2033
List of Tables
- Table 1: Global Tall Oil Fatty Acid Market Revenue million Forecast, by Product Type 2020 & 2033
- Table 2: Global Tall Oil Fatty Acid Market Volume K Tons Forecast, by Product Type 2020 & 2033
- Table 3: Global Tall Oil Fatty Acid Market Revenue million Forecast, by Application 2020 & 2033
- Table 4: Global Tall Oil Fatty Acid Market Volume K Tons Forecast, by Application 2020 & 2033
- Table 5: Global Tall Oil Fatty Acid Market Revenue million Forecast, by End-user Industry 2020 & 2033
- Table 6: Global Tall Oil Fatty Acid Market Volume K Tons Forecast, by End-user Industry 2020 & 2033
- Table 7: Global Tall Oil Fatty Acid Market Revenue million Forecast, by Region 2020 & 2033
- Table 8: Global Tall Oil Fatty Acid Market Volume K Tons Forecast, by Region 2020 & 2033
- Table 9: Global Tall Oil Fatty Acid Market Revenue million Forecast, by Product Type 2020 & 2033
- Table 10: Global Tall Oil Fatty Acid Market Volume K Tons Forecast, by Product Type 2020 & 2033
- Table 11: Global Tall Oil Fatty Acid Market Revenue million Forecast, by Application 2020 & 2033
- Table 12: Global Tall Oil Fatty Acid Market Volume K Tons Forecast, by Application 2020 & 2033
- Table 13: Global Tall Oil Fatty Acid Market Revenue million Forecast, by End-user Industry 2020 & 2033
- Table 14: Global Tall Oil Fatty Acid Market Volume K Tons Forecast, by End-user Industry 2020 & 2033
- Table 15: Global Tall Oil Fatty Acid Market Revenue million Forecast, by Country 2020 & 2033
- Table 16: Global Tall Oil Fatty Acid Market Volume K Tons Forecast, by Country 2020 & 2033
- Table 17: China Tall Oil Fatty Acid Market Revenue (million) Forecast, by Application 2020 & 2033
- Table 18: China Tall Oil Fatty Acid Market Volume (K Tons) Forecast, by Application 2020 & 2033
- Table 19: India Tall Oil Fatty Acid Market Revenue (million) Forecast, by Application 2020 & 2033
- Table 20: India Tall Oil Fatty Acid Market Volume (K Tons) Forecast, by Application 2020 & 2033
- Table 21: Japan Tall Oil Fatty Acid Market Revenue (million) Forecast, by Application 2020 & 2033
- Table 22: Japan Tall Oil Fatty Acid Market Volume (K Tons) Forecast, by Application 2020 & 2033
- Table 23: South Korea Tall Oil Fatty Acid Market Revenue (million) Forecast, by Application 2020 & 2033
- Table 24: South Korea Tall Oil Fatty Acid Market Volume (K Tons) Forecast, by Application 2020 & 2033
- Table 25: Rest of Asia Pacific Tall Oil Fatty Acid Market Revenue (million) Forecast, by Application 2020 & 2033
- Table 26: Rest of Asia Pacific Tall Oil Fatty Acid Market Volume (K Tons) Forecast, by Application 2020 & 2033
- Table 27: Global Tall Oil Fatty Acid Market Revenue million Forecast, by Product Type 2020 & 2033
- Table 28: Global Tall Oil Fatty Acid Market Volume K Tons Forecast, by Product Type 2020 & 2033
- Table 29: Global Tall Oil Fatty Acid Market Revenue million Forecast, by Application 2020 & 2033
- Table 30: Global Tall Oil Fatty Acid Market Volume K Tons Forecast, by Application 2020 & 2033
- Table 31: Global Tall Oil Fatty Acid Market Revenue million Forecast, by End-user Industry 2020 & 2033
- Table 32: Global Tall Oil Fatty Acid Market Volume K Tons Forecast, by End-user Industry 2020 & 2033
- Table 33: Global Tall Oil Fatty Acid Market Revenue million Forecast, by Country 2020 & 2033
- Table 34: Global Tall Oil Fatty Acid Market Volume K Tons Forecast, by Country 2020 & 2033
- Table 35: United States Tall Oil Fatty Acid Market Revenue (million) Forecast, by Application 2020 & 2033
- Table 36: United States Tall Oil Fatty Acid Market Volume (K Tons) Forecast, by Application 2020 & 2033
- Table 37: Canada Tall Oil Fatty Acid Market Revenue (million) Forecast, by Application 2020 & 2033
- Table 38: Canada Tall Oil Fatty Acid Market Volume (K Tons) Forecast, by Application 2020 & 2033
- Table 39: Mexico Tall Oil Fatty Acid Market Revenue (million) Forecast, by Application 2020 & 2033
- Table 40: Mexico Tall Oil Fatty Acid Market Volume (K Tons) Forecast, by Application 2020 & 2033
- Table 41: Global Tall Oil Fatty Acid Market Revenue million Forecast, by Product Type 2020 & 2033
- Table 42: Global Tall Oil Fatty Acid Market Volume K Tons Forecast, by Product Type 2020 & 2033
- Table 43: Global Tall Oil Fatty Acid Market Revenue million Forecast, by Application 2020 & 2033
- Table 44: Global Tall Oil Fatty Acid Market Volume K Tons Forecast, by Application 2020 & 2033
- Table 45: Global Tall Oil Fatty Acid Market Revenue million Forecast, by End-user Industry 2020 & 2033
- Table 46: Global Tall Oil Fatty Acid Market Volume K Tons Forecast, by End-user Industry 2020 & 2033
- Table 47: Global Tall Oil Fatty Acid Market Revenue million Forecast, by Country 2020 & 2033
- Table 48: Global Tall Oil Fatty Acid Market Volume K Tons Forecast, by Country 2020 & 2033
- Table 49: Germany Tall Oil Fatty Acid Market Revenue (million) Forecast, by Application 2020 & 2033
- Table 50: Germany Tall Oil Fatty Acid Market Volume (K Tons) Forecast, by Application 2020 & 2033
- Table 51: United Kingdom Tall Oil Fatty Acid Market Revenue (million) Forecast, by Application 2020 & 2033
- Table 52: United Kingdom Tall Oil Fatty Acid Market Volume (K Tons) Forecast, by Application 2020 & 2033
- Table 53: Italy Tall Oil Fatty Acid Market Revenue (million) Forecast, by Application 2020 & 2033
- Table 54: Italy Tall Oil Fatty Acid Market Volume (K Tons) Forecast, by Application 2020 & 2033
- Table 55: France Tall Oil Fatty Acid Market Revenue (million) Forecast, by Application 2020 & 2033
- Table 56: France Tall Oil Fatty Acid Market Volume (K Tons) Forecast, by Application 2020 & 2033
- Table 57: Rest of Europe Tall Oil Fatty Acid Market Revenue (million) Forecast, by Application 2020 & 2033
- Table 58: Rest of Europe Tall Oil Fatty Acid Market Volume (K Tons) Forecast, by Application 2020 & 2033
- Table 59: Global Tall Oil Fatty Acid Market Revenue million Forecast, by Product Type 2020 & 2033
- Table 60: Global Tall Oil Fatty Acid Market Volume K Tons Forecast, by Product Type 2020 & 2033
- Table 61: Global Tall Oil Fatty Acid Market Revenue million Forecast, by Application 2020 & 2033
- Table 62: Global Tall Oil Fatty Acid Market Volume K Tons Forecast, by Application 2020 & 2033
- Table 63: Global Tall Oil Fatty Acid Market Revenue million Forecast, by End-user Industry 2020 & 2033
- Table 64: Global Tall Oil Fatty Acid Market Volume K Tons Forecast, by End-user Industry 2020 & 2033
- Table 65: Global Tall Oil Fatty Acid Market Revenue million Forecast, by Country 2020 & 2033
- Table 66: Global Tall Oil Fatty Acid Market Volume K Tons Forecast, by Country 2020 & 2033
- Table 67: Brazil Tall Oil Fatty Acid Market Revenue (million) Forecast, by Application 2020 & 2033
- Table 68: Brazil Tall Oil Fatty Acid Market Volume (K Tons) Forecast, by Application 2020 & 2033
- Table 69: Argentina Tall Oil Fatty Acid Market Revenue (million) Forecast, by Application 2020 & 2033
- Table 70: Argentina Tall Oil Fatty Acid Market Volume (K Tons) Forecast, by Application 2020 & 2033
- Table 71: Rest of South America Tall Oil Fatty Acid Market Revenue (million) Forecast, by Application 2020 & 2033
- Table 72: Rest of South America Tall Oil Fatty Acid Market Volume (K Tons) Forecast, by Application 2020 & 2033
- Table 73: Global Tall Oil Fatty Acid Market Revenue million Forecast, by Product Type 2020 & 2033
- Table 74: Global Tall Oil Fatty Acid Market Volume K Tons Forecast, by Product Type 2020 & 2033
- Table 75: Global Tall Oil Fatty Acid Market Revenue million Forecast, by Application 2020 & 2033
- Table 76: Global Tall Oil Fatty Acid Market Volume K Tons Forecast, by Application 2020 & 2033
- Table 77: Global Tall Oil Fatty Acid Market Revenue million Forecast, by End-user Industry 2020 & 2033
- Table 78: Global Tall Oil Fatty Acid Market Volume K Tons Forecast, by End-user Industry 2020 & 2033
- Table 79: Global Tall Oil Fatty Acid Market Revenue million Forecast, by Country 2020 & 2033
- Table 80: Global Tall Oil Fatty Acid Market Volume K Tons Forecast, by Country 2020 & 2033
- Table 81: Saudi Arabia Tall Oil Fatty Acid Market Revenue (million) Forecast, by Application 2020 & 2033
- Table 82: Saudi Arabia Tall Oil Fatty Acid Market Volume (K Tons) Forecast, by Application 2020 & 2033
- Table 83: South Africa Tall Oil Fatty Acid Market Revenue (million) Forecast, by Application 2020 & 2033
- Table 84: South Africa Tall Oil Fatty Acid Market Volume (K Tons) Forecast, by Application 2020 & 2033
- Table 85: Rest of Middle East and Africa Tall Oil Fatty Acid Market Revenue (million) Forecast, by Application 2020 & 2033
- Table 86: Rest of Middle East and Africa Tall Oil Fatty Acid Market Volume (K Tons) Forecast, by Application 2020 & 2033
Frequently Asked Questions
1. What is the projected Compound Annual Growth Rate (CAGR) of the Tall Oil Fatty Acid Market?
The projected CAGR is approximately 4.66%.
2. Which companies are prominent players in the Tall Oil Fatty Acid Market?
Key companies in the market include Lascaray S A, Pine Chemical Group, Imperial Industrial Minerals Company, Arizona Chemical Co, Harima Chemicals Group Inc, Eastman Chemical Company, Ingevity, Segezha-Group, Forchem Oyj, Ilim Group, KRATON CORPORATION, UNIVAR SOLUTIONS, Shaxian Lixin Resin Co Ltd, Foreverest Resources Ltd, Pasand Speciality Chemicals, Ataman Kimya, G C Rutteman & Co B V.
3. What are the main segments of the Tall Oil Fatty Acid Market?
The market segments include Product Type, Application, End-user Industry.
4. Can you provide details about the market size?
The market size is estimated to be USD 4.82 million as of 2022.
5. What are some drivers contributing to market growth?
Increasing Demand for Bio-based Lubricants in Several Industries; Other Drivers.
6. What are the notable trends driving market growth?
Increasing Usage in the Automotive Industry.
7. Are there any restraints impacting market growth?
Restrictions on Cutting of Trees by Various Governments Across the Globe; Other Restraints.
8. Can you provide examples of recent developments in the market?
N/A
9. What pricing options are available for accessing the report?
Pricing options include single-user, multi-user, and enterprise licenses priced at USD 4750, USD 5250, and USD 8750 respectively.
10. Is the market size provided in terms of value or volume?
The market size is provided in terms of value, measured in million and volume, measured in K Tons.
11. Are there any specific market keywords associated with the report?
Yes, the market keyword associated with the report is "Tall Oil Fatty Acid Market," which aids in identifying and referencing the specific market segment covered.
12. How do I determine which pricing option suits my needs best?
The pricing options vary based on user requirements and access needs. Individual users may opt for single-user licenses, while businesses requiring broader access may choose multi-user or enterprise licenses for cost-effective access to the report.
13. Are there any additional resources or data provided in the Tall Oil Fatty Acid Market report?
While the report offers comprehensive insights, it's advisable to review the specific contents or supplementary materials provided to ascertain if additional resources or data are available.
14. How can I stay updated on further developments or reports in the Tall Oil Fatty Acid Market?
To stay informed about further developments, trends, and reports in the Tall Oil Fatty Acid Market, consider subscribing to industry newsletters, following relevant companies and organizations, or regularly checking reputable industry news sources and publications.
Methodology
Step 1 - Identification of Relevant Samples Size from Population Database


Step 2 - Approaches for Defining Global Market Size (Value, Volume* & Price*)

Note*: In applicable scenarios
Step 3 - Data Sources
Primary Research
- Web Analytics
- Survey Reports
- Research Institute
- Latest Research Reports
- Opinion Leaders
Secondary Research
- Annual Reports
- White Paper
- Latest Press Release
- Industry Association
- Paid Database
- Investor Presentations

Step 4 - Data Triangulation
Involves using different sources of information in order to increase the validity of a study
These sources are likely to be stakeholders in a program - participants, other researchers, program staff, other community members, and so on.
Then we put all data in single framework & apply various statistical tools to find out the dynamic on the market.
During the analysis stage, feedback from the stakeholder groups would be compared to determine areas of agreement as well as areas of divergence