

Key Insights
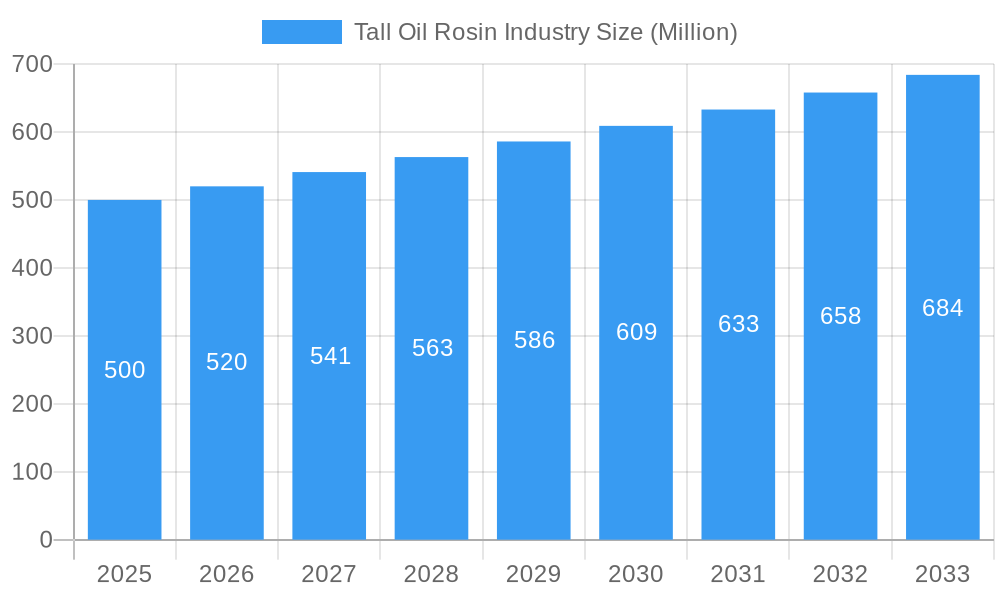
The Tall Oil Rosin (TOR) market is projected for significant expansion from 2019 to 2033. The historical period (2019-2024) likely saw steady demand increases, particularly from the adhesives, inks, and coatings sectors. In the base year 2025, the market is valued at 709.2 million. With an estimated Compound Annual Growth Rate (CAGR) of 4.1%, the TOR market is poised for substantial growth through 2033. Key growth drivers include advancements in TOR production, enhancing efficiency and cost-effectiveness, alongside emerging applications in bio-based materials and renewable energy. Geographic market dynamics will reflect industrialization and construction trends, with regions experiencing rapid development likely exhibiting higher demand.
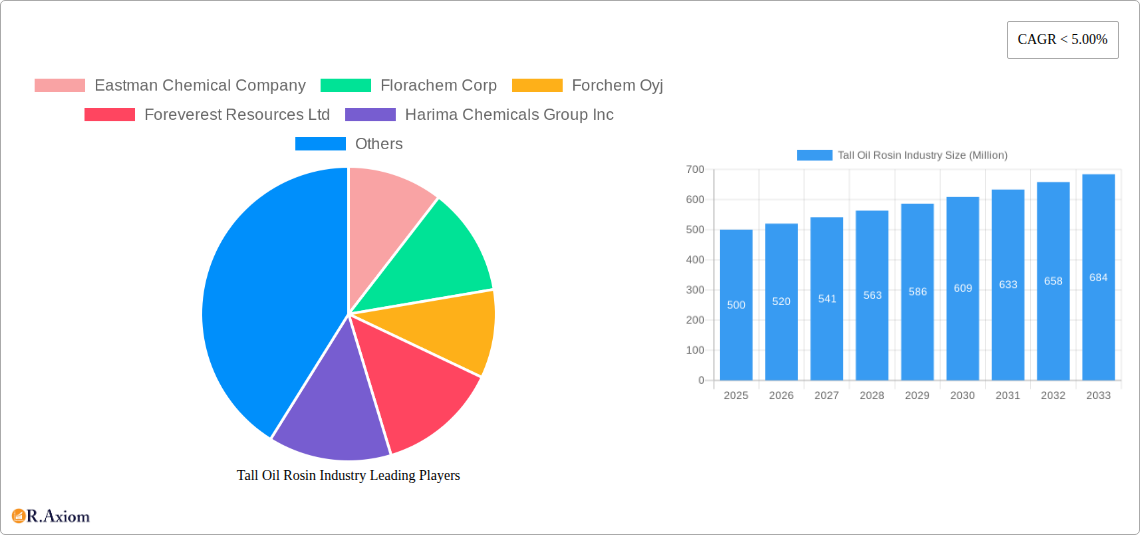
Tall Oil Rosin Industry Market Size (In Million)
This projected growth presents considerable investment prospects within the TOR market. However, navigating challenges such as raw material price volatility and evolving environmental regulations is critical. Sustainable sourcing and production will be paramount for sustained market competitiveness. Continuous research and development focused on improving TOR properties and expanding its applications will be vital for future expansion. Intense competition among key players will likely center on product innovation and differentiation. Strategic downstream application focus and value chain collaborations are essential for managing market complexities and achieving enduring growth.
Tall Oil Rosin Industry Company Market Share
Tall Oil Rosin Industry: A Comprehensive Market Report (2019-2033)
This comprehensive report provides a detailed analysis of the global Tall Oil Rosin industry, offering in-depth insights into market trends, competitive dynamics, and future growth prospects. The study period spans from 2019 to 2033, with 2025 serving as the base and estimated year. The report leverages extensive primary and secondary research to provide actionable intelligence for industry stakeholders, including manufacturers, suppliers, distributors, and investors.
Tall Oil Rosin Industry Market Concentration & Innovation
This section analyzes the competitive landscape of the Tall Oil Rosin market, focusing on market concentration, innovation drivers, regulatory frameworks, product substitutes, end-user trends, and mergers & acquisitions (M&A) activities.
The global Tall Oil Rosin market exhibits a moderately concentrated structure, with several major players holding significant market share. While precise market share figures for individual companies are proprietary and vary by segment, Eastman Chemical Company, Ingevity Corporation, and Kraton Corporation are considered key players. The overall market concentration is estimated at xx%, indicating the presence of both large multinational corporations and smaller, regional players.
Innovation Drivers: Key innovation drivers include the development of bio-based alternatives, improved sustainability practices, and the creation of specialized rosin derivatives for niche applications.
Regulatory Frameworks: Environmental regulations concerning the sustainable sourcing of raw materials and the reduction of emissions significantly influence industry operations.
Product Substitutes: The market faces competition from synthetic resins and other alternatives, particularly in specific applications. This competitive pressure pushes innovation and efficiency improvements.
End-User Trends: Growing demand from the adhesives, coatings, and paper industries drives market growth. Shifting consumer preferences toward environmentally friendly products are also impacting the demand for sustainably sourced Tall Oil Rosin.
M&A Activities: The industry has witnessed several M&A activities in recent years, although precise deal values are often confidential. These activities are driven by a desire to expand market reach, access new technologies, and consolidate market share. The total value of M&A transactions in the Tall Oil Rosin industry during the historical period (2019-2024) is estimated at $xx Million.
Tall Oil Rosin Industry Industry Trends & Insights
The global Tall Oil Rosin market is experiencing significant growth, driven by several key factors. The Compound Annual Growth Rate (CAGR) during the forecast period (2025-2033) is projected to be xx%, significantly influenced by increasing demand from key end-use sectors. Market penetration in emerging economies, particularly in Asia, is also expected to drive substantial growth.
Technological disruptions, such as the development of novel rosin derivatives with improved properties, are reshaping the industry landscape. Consumer preferences for sustainable and environmentally friendly products are increasingly shaping product development and sourcing strategies. Competitive dynamics are characterized by price competition, product differentiation, and strategic partnerships. The market is witnessing a shift towards greater vertical integration as companies seek to control their supply chains and reduce costs. The impact of price increases announced by major players like Ingevity Corporation and Kraton Corporation in recent years has reinforced the need for efficient production and strategic pricing strategies.
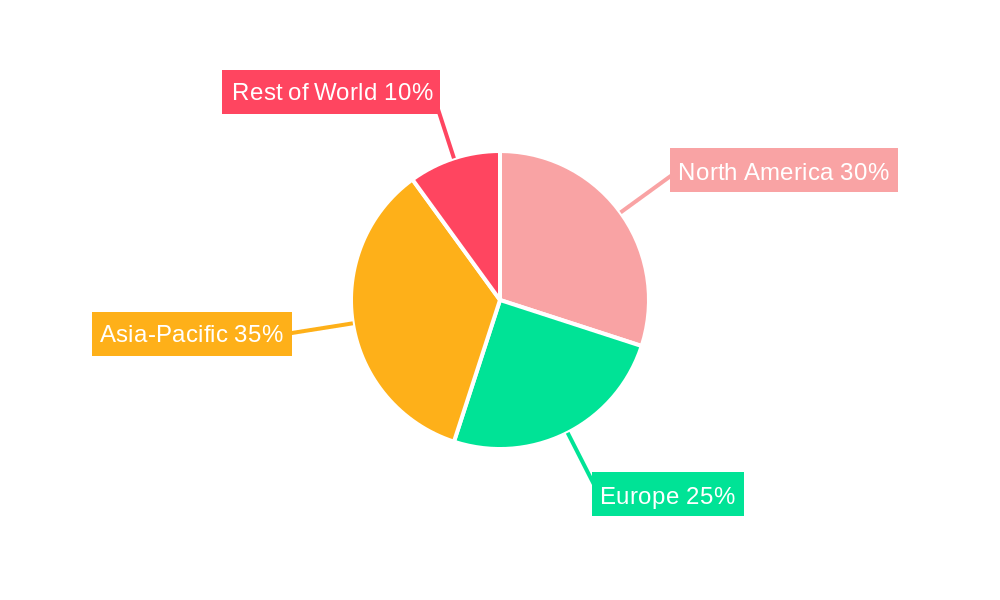
Dominant Markets & Segments in Tall Oil Rosin Industry
The North American region currently dominates the global Tall Oil Rosin market, driven by robust demand from the paper, adhesives, and coatings industries. This dominance is supported by well-established production facilities, efficient logistics networks, and a strong industrial base.
Key Drivers of North American Market Dominance:
- Abundant availability of raw materials (pine trees)
- Established industrial infrastructure
- Strong demand from major end-use industries
- Government support for sustainable forestry practices.
While North America holds a leading position, the Asia-Pacific region is anticipated to witness substantial growth over the forecast period. This growth is fueled by rapid industrialization, increasing construction activity, and a rising demand for adhesives and coatings in emerging economies such as China and India.
Tall Oil Rosin Industry Product Developments
Recent product developments focus on creating higher-performance rosin derivatives with enhanced properties such as improved adhesion, water resistance, and heat resistance. These advancements cater to the growing demand for specialized products in niche applications. Technological trends include the use of nanotechnology to enhance product performance and the development of bio-based rosin alternatives to meet sustainability goals. The market fit for these new products is strong, given the increasing demand for higher-performing and environmentally friendly materials in various industries.
Report Scope & Segmentation Analysis
This report segments the Tall Oil Rosin market based on several factors including product type (e.g., tall oil rosin, tall oil fatty acids, distilled tall oil), application (e.g., adhesives, coatings, paper, inks), and geography (North America, Europe, Asia-Pacific, Rest of the World). Growth projections vary by segment, with the adhesives and coatings segments anticipated to witness above-average growth. Market sizes for each segment are provided in the full report, along with detailed competitive analyses, reflecting market share and revenue projections in Million USD.
Key Drivers of Tall Oil Rosin Industry Growth
The Tall Oil Rosin industry's growth is primarily driven by the robust demand from key end-use sectors, notably the adhesives, coatings, and paper industries. The increasing construction activity globally, particularly in emerging economies, further fuels this demand. Technological advancements resulting in the development of superior rosin derivatives enhance the product's versatility and appeal. Furthermore, government initiatives supporting sustainable forestry practices ensure the consistent supply of raw materials.
Challenges in the Tall Oil Rosin Industry Sector
The Tall Oil Rosin industry faces challenges related to fluctuating raw material prices and supply chain disruptions. Environmental regulations and increasing sustainability concerns also impact production costs and operational efficiency. Competitive pressures from synthetic resin alternatives and the need for continuous product innovation represent ongoing obstacles. These factors collectively impact industry profitability and necessitate strategic planning to mitigate risks. The estimated negative impact of these challenges on overall market growth is estimated at xx% over the forecast period.
Emerging Opportunities in Tall Oil Rosin Industry
Emerging opportunities lie in the development of bio-based and sustainable rosin alternatives, catering to the growing environmental concerns. Expansion into new and emerging markets, particularly in developing economies, presents significant growth potential. Exploring novel applications of rosin derivatives in high-growth sectors like renewable energy and biomaterials opens new avenues for innovation and market expansion.
Leading Players in the Tall Oil Rosin Industry Market
- Eastman Chemical Company
- Florachem Corp
- Forchem Oyj
- Foreverest Resources Ltd
- Harima Chemicals Group Inc
- Ilim Group
- Ingevity Corporation
- Kraton Corporation
- OOO Torgoviy Dom Lesokhimik
- Pine Chemical Group
- Segezha-Group
- Songchuan Pine Chemicals Co Ltd
- Stora Enso *List Not Exhaustive
Key Developments in Tall Oil Rosin Industry Industry
- September 2022: Ingevity Corporation announced a general price increase for tall oil fatty acid and distilled tall oil products and derivatives, and rosin-based resins. This reflects increasing raw material costs and strong market demand.
- September 2021: Kraton Corp. increased prices by 10-15% across its crude tall oil refinery products and derivatives, indicating rising production costs and market dynamics.
Strategic Outlook for Tall Oil Rosin Industry Market
The Tall Oil Rosin market is poised for continued growth, driven by robust demand from key end-use sectors and the development of innovative, sustainable products. Opportunities exist in expanding into new markets, leveraging technological advancements, and focusing on sustainable sourcing practices. Companies that prioritize product innovation, efficient supply chain management, and a commitment to sustainability are best positioned to capitalize on the market's future potential. The market is expected to reach a value of $xx Million by 2033.
Tall Oil Rosin Industry Segmentation
-
1. Application
- 1.1. Pulp & Paper
- 1.2. Inks and Toners
- 1.3. Adhesives
- 1.4. Paints and Coatings
- 1.5. Electronics
- 1.6. Hygiene Products
- 1.7. Rubber
- 1.8. Other Applications
-
2. End-user Industry
- 2.1. Printing
- 2.2. Automotive
- 2.3. Building and Construction
- 2.4. Chemicals
- 2.5. Electronics and Electrical
- 2.6. Mining
- 2.7. Other End-user Industries
Tall Oil Rosin Industry Segmentation By Geography
-
1. Asia Pacific
- 1.1. China
- 1.2. India
- 1.3. Japan
- 1.4. South Korea
- 1.5. Rest of Asia Pacific
-
2. North America
- 2.1. United States
- 2.2. Canada
- 2.3. Mexico
-
3. Europe
- 3.1. Germany
- 3.2. United Kingdom
- 3.3. Italy
- 3.4. France
- 3.5. Rest of Europe
-
4. South America
- 4.1. Brazil
- 4.2. Argentina
- 4.3. Rest of South America
-
5. Middle East and Africa
- 5.1. Saudi Arabia
- 5.2. South Africa
- 5.3. Rest of Middle East and Africa
Tall Oil Rosin Industry Regional Market Share
Geographic Coverage of Tall Oil Rosin Industry
Tall Oil Rosin Industry REPORT HIGHLIGHTS
| Aspects | Details |
|---|---|
| Study Period | 2020-2034 |
| Base Year | 2025 |
| Estimated Year | 2026 |
| Forecast Period | 2026-2034 |
| Historical Period | 2020-2025 |
| Growth Rate | CAGR of 4.1% from 2020-2034 |
| Segmentation |
|
Table of Contents
- 1. Introduction
- 1.1. Research Scope
- 1.2. Market Segmentation
- 1.3. Research Objective
- 1.4. Definitions and Assumptions
- 2. Executive Summary
- 2.1. Market Snapshot
- 3. Market Dynamics
- 3.1. Market Drivers
- 3.2. Market Restrains
- 3.3. Market Trends
- 3.4. Market Opportunities
- 4. Market Factor Analysis
- 4.1. Porters Five Forces
- 4.1.1. Bargaining Power of Suppliers
- 4.1.2. Bargaining Power of Buyers
- 4.1.3. Threat of New Entrants
- 4.1.4. Threat of Substitutes
- 4.1.5. Competitive Rivalry
- 4.2. PESTEL analysis
- 4.3. BCG Analysis
- 4.3.1. Stars (High Growth, High Market Share)
- 4.3.2. Cash Cows (Low Growth, High Market Share)
- 4.3.3. Question Mark (High Growth, Low Market Share)
- 4.3.4. Dogs (Low Growth, Low Market Share)
- 4.4. Ansoff Matrix Analysis
- 4.5. Supply Chain Analysis
- 4.6. Regulatory Landscape
- 4.7. Current Market Potential and Opportunity Assessment (TAM–SAM–SOM Framework)
- 4.8. RAX Analyst Note
- 4.1. Porters Five Forces
- 5. Market Analysis, Insights and Forecast 2021-2033
- 5.1. Market Analysis, Insights and Forecast - by Application
- 5.1.1. Pulp & Paper
- 5.1.2. Inks and Toners
- 5.1.3. Adhesives
- 5.1.4. Paints and Coatings
- 5.1.5. Electronics
- 5.1.6. Hygiene Products
- 5.1.7. Rubber
- 5.1.8. Other Applications
- 5.2. Market Analysis, Insights and Forecast - by End-user Industry
- 5.2.1. Printing
- 5.2.2. Automotive
- 5.2.3. Building and Construction
- 5.2.4. Chemicals
- 5.2.5. Electronics and Electrical
- 5.2.6. Mining
- 5.2.7. Other End-user Industries
- 5.3. Market Analysis, Insights and Forecast - by Region
- 5.3.1. Asia Pacific
- 5.3.2. North America
- 5.3.3. Europe
- 5.3.4. South America
- 5.3.5. Middle East and Africa
- 5.1. Market Analysis, Insights and Forecast - by Application
- 6. Global Tall Oil Rosin Industry Analysis, Insights and Forecast, 2021-2033
- 6.1. Market Analysis, Insights and Forecast - by Application
- 6.1.1. Pulp & Paper
- 6.1.2. Inks and Toners
- 6.1.3. Adhesives
- 6.1.4. Paints and Coatings
- 6.1.5. Electronics
- 6.1.6. Hygiene Products
- 6.1.7. Rubber
- 6.1.8. Other Applications
- 6.2. Market Analysis, Insights and Forecast - by End-user Industry
- 6.2.1. Printing
- 6.2.2. Automotive
- 6.2.3. Building and Construction
- 6.2.4. Chemicals
- 6.2.5. Electronics and Electrical
- 6.2.6. Mining
- 6.2.7. Other End-user Industries
- 6.1. Market Analysis, Insights and Forecast - by Application
- 7. Asia Pacific Tall Oil Rosin Industry Analysis, Insights and Forecast, 2020-2032
- 7.1. Market Analysis, Insights and Forecast - by Application
- 7.1.1. Pulp & Paper
- 7.1.2. Inks and Toners
- 7.1.3. Adhesives
- 7.1.4. Paints and Coatings
- 7.1.5. Electronics
- 7.1.6. Hygiene Products
- 7.1.7. Rubber
- 7.1.8. Other Applications
- 7.2. Market Analysis, Insights and Forecast - by End-user Industry
- 7.2.1. Printing
- 7.2.2. Automotive
- 7.2.3. Building and Construction
- 7.2.4. Chemicals
- 7.2.5. Electronics and Electrical
- 7.2.6. Mining
- 7.2.7. Other End-user Industries
- 7.1. Market Analysis, Insights and Forecast - by Application
- 8. North America Tall Oil Rosin Industry Analysis, Insights and Forecast, 2020-2032
- 8.1. Market Analysis, Insights and Forecast - by Application
- 8.1.1. Pulp & Paper
- 8.1.2. Inks and Toners
- 8.1.3. Adhesives
- 8.1.4. Paints and Coatings
- 8.1.5. Electronics
- 8.1.6. Hygiene Products
- 8.1.7. Rubber
- 8.1.8. Other Applications
- 8.2. Market Analysis, Insights and Forecast - by End-user Industry
- 8.2.1. Printing
- 8.2.2. Automotive
- 8.2.3. Building and Construction
- 8.2.4. Chemicals
- 8.2.5. Electronics and Electrical
- 8.2.6. Mining
- 8.2.7. Other End-user Industries
- 8.1. Market Analysis, Insights and Forecast - by Application
- 9. Europe Tall Oil Rosin Industry Analysis, Insights and Forecast, 2020-2032
- 9.1. Market Analysis, Insights and Forecast - by Application
- 9.1.1. Pulp & Paper
- 9.1.2. Inks and Toners
- 9.1.3. Adhesives
- 9.1.4. Paints and Coatings
- 9.1.5. Electronics
- 9.1.6. Hygiene Products
- 9.1.7. Rubber
- 9.1.8. Other Applications
- 9.2. Market Analysis, Insights and Forecast - by End-user Industry
- 9.2.1. Printing
- 9.2.2. Automotive
- 9.2.3. Building and Construction
- 9.2.4. Chemicals
- 9.2.5. Electronics and Electrical
- 9.2.6. Mining
- 9.2.7. Other End-user Industries
- 9.1. Market Analysis, Insights and Forecast - by Application
- 10. South America Tall Oil Rosin Industry Analysis, Insights and Forecast, 2020-2032
- 10.1. Market Analysis, Insights and Forecast - by Application
- 10.1.1. Pulp & Paper
- 10.1.2. Inks and Toners
- 10.1.3. Adhesives
- 10.1.4. Paints and Coatings
- 10.1.5. Electronics
- 10.1.6. Hygiene Products
- 10.1.7. Rubber
- 10.1.8. Other Applications
- 10.2. Market Analysis, Insights and Forecast - by End-user Industry
- 10.2.1. Printing
- 10.2.2. Automotive
- 10.2.3. Building and Construction
- 10.2.4. Chemicals
- 10.2.5. Electronics and Electrical
- 10.2.6. Mining
- 10.2.7. Other End-user Industries
- 10.1. Market Analysis, Insights and Forecast - by Application
- 11. Middle East and Africa Tall Oil Rosin Industry Analysis, Insights and Forecast, 2020-2032
- 11.1. Market Analysis, Insights and Forecast - by Application
- 11.1.1. Pulp & Paper
- 11.1.2. Inks and Toners
- 11.1.3. Adhesives
- 11.1.4. Paints and Coatings
- 11.1.5. Electronics
- 11.1.6. Hygiene Products
- 11.1.7. Rubber
- 11.1.8. Other Applications
- 11.2. Market Analysis, Insights and Forecast - by End-user Industry
- 11.2.1. Printing
- 11.2.2. Automotive
- 11.2.3. Building and Construction
- 11.2.4. Chemicals
- 11.2.5. Electronics and Electrical
- 11.2.6. Mining
- 11.2.7. Other End-user Industries
- 11.1. Market Analysis, Insights and Forecast - by Application
- 12. Competitive Analysis
- 12.1. Company Profiles
- 12.1.1 Eastman Chemical Company
- 12.1.1.1. Company Overview
- 12.1.1.2. Products
- 12.1.1.3. Company Financials
- 12.1.1.4. SWOT Analysis
- 12.1.2 Florachem Corp
- 12.1.2.1. Company Overview
- 12.1.2.2. Products
- 12.1.2.3. Company Financials
- 12.1.2.4. SWOT Analysis
- 12.1.3 Forchem Oyj
- 12.1.3.1. Company Overview
- 12.1.3.2. Products
- 12.1.3.3. Company Financials
- 12.1.3.4. SWOT Analysis
- 12.1.4 Foreverest Resources Ltd
- 12.1.4.1. Company Overview
- 12.1.4.2. Products
- 12.1.4.3. Company Financials
- 12.1.4.4. SWOT Analysis
- 12.1.5 Harima Chemicals Group Inc
- 12.1.5.1. Company Overview
- 12.1.5.2. Products
- 12.1.5.3. Company Financials
- 12.1.5.4. SWOT Analysis
- 12.1.6 Ilim Group
- 12.1.6.1. Company Overview
- 12.1.6.2. Products
- 12.1.6.3. Company Financials
- 12.1.6.4. SWOT Analysis
- 12.1.7 Ingevity Corporation
- 12.1.7.1. Company Overview
- 12.1.7.2. Products
- 12.1.7.3. Company Financials
- 12.1.7.4. SWOT Analysis
- 12.1.8 Kraton Corporation
- 12.1.8.1. Company Overview
- 12.1.8.2. Products
- 12.1.8.3. Company Financials
- 12.1.8.4. SWOT Analysis
- 12.1.9 OOO Torgoviy Dom Lesokhimik
- 12.1.9.1. Company Overview
- 12.1.9.2. Products
- 12.1.9.3. Company Financials
- 12.1.9.4. SWOT Analysis
- 12.1.10 Pine Chemical Group
- 12.1.10.1. Company Overview
- 12.1.10.2. Products
- 12.1.10.3. Company Financials
- 12.1.10.4. SWOT Analysis
- 12.1.11 Segezha-Group
- 12.1.11.1. Company Overview
- 12.1.11.2. Products
- 12.1.11.3. Company Financials
- 12.1.11.4. SWOT Analysis
- 12.1.12 Songchuan Pine Chemicals Co Ltd
- 12.1.12.1. Company Overview
- 12.1.12.2. Products
- 12.1.12.3. Company Financials
- 12.1.12.4. SWOT Analysis
- 12.1.13 Stora Enso*List Not Exhaustive
- 12.1.13.1. Company Overview
- 12.1.13.2. Products
- 12.1.13.3. Company Financials
- 12.1.13.4. SWOT Analysis
- 12.1.1 Eastman Chemical Company
- 12.2. Market Entropy
- 12.2.1 Company's Key Areas Served
- 12.2.2 Recent Developments
- 12.3. Company Market Share Analysis 2025
- 12.3.1 Top 5 Companies Market Share Analysis
- 12.3.2 Top 3 Companies Market Share Analysis
- 12.4. List of Potential Customers
- 13. Research Methodology
List of Figures
- Figure 1: Global Tall Oil Rosin Industry Revenue Breakdown (million, %) by Region 2025 & 2033
- Figure 2: Asia Pacific Tall Oil Rosin Industry Revenue (million), by Application 2025 & 2033
- Figure 3: Asia Pacific Tall Oil Rosin Industry Revenue Share (%), by Application 2025 & 2033
- Figure 4: Asia Pacific Tall Oil Rosin Industry Revenue (million), by End-user Industry 2025 & 2033
- Figure 5: Asia Pacific Tall Oil Rosin Industry Revenue Share (%), by End-user Industry 2025 & 2033
- Figure 6: Asia Pacific Tall Oil Rosin Industry Revenue (million), by Country 2025 & 2033
- Figure 7: Asia Pacific Tall Oil Rosin Industry Revenue Share (%), by Country 2025 & 2033
- Figure 8: North America Tall Oil Rosin Industry Revenue (million), by Application 2025 & 2033
- Figure 9: North America Tall Oil Rosin Industry Revenue Share (%), by Application 2025 & 2033
- Figure 10: North America Tall Oil Rosin Industry Revenue (million), by End-user Industry 2025 & 2033
- Figure 11: North America Tall Oil Rosin Industry Revenue Share (%), by End-user Industry 2025 & 2033
- Figure 12: North America Tall Oil Rosin Industry Revenue (million), by Country 2025 & 2033
- Figure 13: North America Tall Oil Rosin Industry Revenue Share (%), by Country 2025 & 2033
- Figure 14: Europe Tall Oil Rosin Industry Revenue (million), by Application 2025 & 2033
- Figure 15: Europe Tall Oil Rosin Industry Revenue Share (%), by Application 2025 & 2033
- Figure 16: Europe Tall Oil Rosin Industry Revenue (million), by End-user Industry 2025 & 2033
- Figure 17: Europe Tall Oil Rosin Industry Revenue Share (%), by End-user Industry 2025 & 2033
- Figure 18: Europe Tall Oil Rosin Industry Revenue (million), by Country 2025 & 2033
- Figure 19: Europe Tall Oil Rosin Industry Revenue Share (%), by Country 2025 & 2033
- Figure 20: South America Tall Oil Rosin Industry Revenue (million), by Application 2025 & 2033
- Figure 21: South America Tall Oil Rosin Industry Revenue Share (%), by Application 2025 & 2033
- Figure 22: South America Tall Oil Rosin Industry Revenue (million), by End-user Industry 2025 & 2033
- Figure 23: South America Tall Oil Rosin Industry Revenue Share (%), by End-user Industry 2025 & 2033
- Figure 24: South America Tall Oil Rosin Industry Revenue (million), by Country 2025 & 2033
- Figure 25: South America Tall Oil Rosin Industry Revenue Share (%), by Country 2025 & 2033
- Figure 26: Middle East and Africa Tall Oil Rosin Industry Revenue (million), by Application 2025 & 2033
- Figure 27: Middle East and Africa Tall Oil Rosin Industry Revenue Share (%), by Application 2025 & 2033
- Figure 28: Middle East and Africa Tall Oil Rosin Industry Revenue (million), by End-user Industry 2025 & 2033
- Figure 29: Middle East and Africa Tall Oil Rosin Industry Revenue Share (%), by End-user Industry 2025 & 2033
- Figure 30: Middle East and Africa Tall Oil Rosin Industry Revenue (million), by Country 2025 & 2033
- Figure 31: Middle East and Africa Tall Oil Rosin Industry Revenue Share (%), by Country 2025 & 2033
List of Tables
- Table 1: Global Tall Oil Rosin Industry Revenue million Forecast, by Application 2020 & 2033
- Table 2: Global Tall Oil Rosin Industry Revenue million Forecast, by End-user Industry 2020 & 2033
- Table 3: Global Tall Oil Rosin Industry Revenue million Forecast, by Region 2020 & 2033
- Table 4: Global Tall Oil Rosin Industry Revenue million Forecast, by Application 2020 & 2033
- Table 5: Global Tall Oil Rosin Industry Revenue million Forecast, by End-user Industry 2020 & 2033
- Table 6: Global Tall Oil Rosin Industry Revenue million Forecast, by Country 2020 & 2033
- Table 7: China Tall Oil Rosin Industry Revenue (million) Forecast, by Application 2020 & 2033
- Table 8: India Tall Oil Rosin Industry Revenue (million) Forecast, by Application 2020 & 2033
- Table 9: Japan Tall Oil Rosin Industry Revenue (million) Forecast, by Application 2020 & 2033
- Table 10: South Korea Tall Oil Rosin Industry Revenue (million) Forecast, by Application 2020 & 2033
- Table 11: Rest of Asia Pacific Tall Oil Rosin Industry Revenue (million) Forecast, by Application 2020 & 2033
- Table 12: Global Tall Oil Rosin Industry Revenue million Forecast, by Application 2020 & 2033
- Table 13: Global Tall Oil Rosin Industry Revenue million Forecast, by End-user Industry 2020 & 2033
- Table 14: Global Tall Oil Rosin Industry Revenue million Forecast, by Country 2020 & 2033
- Table 15: United States Tall Oil Rosin Industry Revenue (million) Forecast, by Application 2020 & 2033
- Table 16: Canada Tall Oil Rosin Industry Revenue (million) Forecast, by Application 2020 & 2033
- Table 17: Mexico Tall Oil Rosin Industry Revenue (million) Forecast, by Application 2020 & 2033
- Table 18: Global Tall Oil Rosin Industry Revenue million Forecast, by Application 2020 & 2033
- Table 19: Global Tall Oil Rosin Industry Revenue million Forecast, by End-user Industry 2020 & 2033
- Table 20: Global Tall Oil Rosin Industry Revenue million Forecast, by Country 2020 & 2033
- Table 21: Germany Tall Oil Rosin Industry Revenue (million) Forecast, by Application 2020 & 2033
- Table 22: United Kingdom Tall Oil Rosin Industry Revenue (million) Forecast, by Application 2020 & 2033
- Table 23: Italy Tall Oil Rosin Industry Revenue (million) Forecast, by Application 2020 & 2033
- Table 24: France Tall Oil Rosin Industry Revenue (million) Forecast, by Application 2020 & 2033
- Table 25: Rest of Europe Tall Oil Rosin Industry Revenue (million) Forecast, by Application 2020 & 2033
- Table 26: Global Tall Oil Rosin Industry Revenue million Forecast, by Application 2020 & 2033
- Table 27: Global Tall Oil Rosin Industry Revenue million Forecast, by End-user Industry 2020 & 2033
- Table 28: Global Tall Oil Rosin Industry Revenue million Forecast, by Country 2020 & 2033
- Table 29: Brazil Tall Oil Rosin Industry Revenue (million) Forecast, by Application 2020 & 2033
- Table 30: Argentina Tall Oil Rosin Industry Revenue (million) Forecast, by Application 2020 & 2033
- Table 31: Rest of South America Tall Oil Rosin Industry Revenue (million) Forecast, by Application 2020 & 2033
- Table 32: Global Tall Oil Rosin Industry Revenue million Forecast, by Application 2020 & 2033
- Table 33: Global Tall Oil Rosin Industry Revenue million Forecast, by End-user Industry 2020 & 2033
- Table 34: Global Tall Oil Rosin Industry Revenue million Forecast, by Country 2020 & 2033
- Table 35: Saudi Arabia Tall Oil Rosin Industry Revenue (million) Forecast, by Application 2020 & 2033
- Table 36: South Africa Tall Oil Rosin Industry Revenue (million) Forecast, by Application 2020 & 2033
- Table 37: Rest of Middle East and Africa Tall Oil Rosin Industry Revenue (million) Forecast, by Application 2020 & 2033
Frequently Asked Questions
1. What is the projected Compound Annual Growth Rate (CAGR) of the Tall Oil Rosin Industry?
The projected CAGR is approximately 4.1%.
2. Which companies are prominent players in the Tall Oil Rosin Industry?
Key companies in the market include Eastman Chemical Company, Florachem Corp, Forchem Oyj, Foreverest Resources Ltd, Harima Chemicals Group Inc, Ilim Group, Ingevity Corporation, Kraton Corporation, OOO Torgoviy Dom Lesokhimik, Pine Chemical Group, Segezha-Group, Songchuan Pine Chemicals Co Ltd, Stora Enso*List Not Exhaustive.
3. What are the main segments of the Tall Oil Rosin Industry?
The market segments include Application, End-user Industry.
4. Can you provide details about the market size?
The market size is estimated to be USD 709.2 million as of 2022.
5. What are some drivers contributing to market growth?
Growing Need for Renewable Rosins; Increasing Demand for Cost-effective & Vegetarian-friendly Products.
6. What are the notable trends driving market growth?
Increasing Usage in the Pulp and Paper Industry.
7. Are there any restraints impacting market growth?
Growing Need for Renewable Rosins; Increasing Demand for Cost-effective & Vegetarian-friendly Products.
8. Can you provide examples of recent developments in the market?
In September 2022, Ingevity Corporation announced a general price increase for tall oil fatty acid and distilled tall oil products and derivatives, also for rosin-based resins associated with its industrial specialties portfolio.
9. What pricing options are available for accessing the report?
Pricing options include single-user, multi-user, and enterprise licenses priced at USD 4750, USD 5250, and USD 8750 respectively.
10. Is the market size provided in terms of value or volume?
The market size is provided in terms of value, measured in million.
11. Are there any specific market keywords associated with the report?
Yes, the market keyword associated with the report is "Tall Oil Rosin Industry," which aids in identifying and referencing the specific market segment covered.
12. How do I determine which pricing option suits my needs best?
The pricing options vary based on user requirements and access needs. Individual users may opt for single-user licenses, while businesses requiring broader access may choose multi-user or enterprise licenses for cost-effective access to the report.
13. Are there any additional resources or data provided in the Tall Oil Rosin Industry report?
While the report offers comprehensive insights, it's advisable to review the specific contents or supplementary materials provided to ascertain if additional resources or data are available.
14. How can I stay updated on further developments or reports in the Tall Oil Rosin Industry?
To stay informed about further developments, trends, and reports in the Tall Oil Rosin Industry, consider subscribing to industry newsletters, following relevant companies and organizations, or regularly checking reputable industry news sources and publications.
Methodology
Step 1 - Identification of Relevant Samples Size from Population Database


Step 2 - Approaches for Defining Global Market Size (Value, Volume* & Price*)

Note*: In applicable scenarios
Step 3 - Data Sources
Primary Research
- Web Analytics
- Survey Reports
- Research Institute
- Latest Research Reports
- Opinion Leaders
Secondary Research
- Annual Reports
- White Paper
- Latest Press Release
- Industry Association
- Paid Database
- Investor Presentations

Step 4 - Data Triangulation
Involves using different sources of information in order to increase the validity of a study
These sources are likely to be stakeholders in a program - participants, other researchers, program staff, other community members, and so on.
Then we put all data in single framework & apply various statistical tools to find out the dynamic on the market.
During the analysis stage, feedback from the stakeholder groups would be compared to determine areas of agreement as well as areas of divergence