

Key Insights
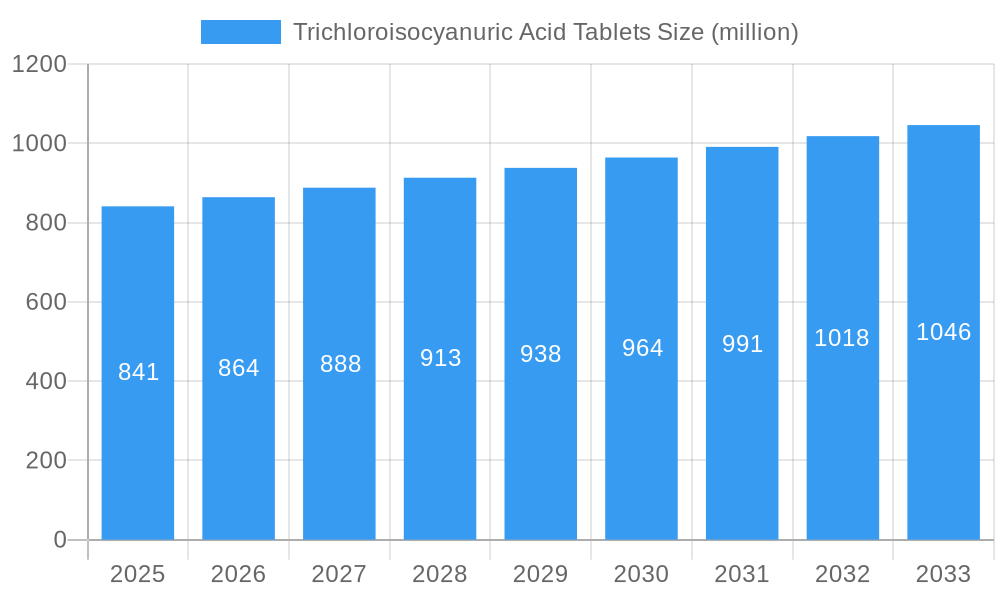
The global Trichloroisocyanuric Acid (TCCA) Tablets market, valued at $841 million in 2025, is projected to experience steady growth, driven by increasing demand from the swimming pool and spa industry, water treatment facilities, and sanitation applications. The 2.5% CAGR indicates a consistent, albeit moderate, expansion over the forecast period (2025-2033). Key drivers include the rising prevalence of private and public swimming pools, coupled with stringent water sanitation regulations globally. Growing awareness of hygiene and sanitation, especially in developing economies, further fuels market growth. While the market faces restraints such as the potential environmental concerns associated with TCCA and the emergence of alternative disinfectants, the overall demand remains robust. The market segmentation likely includes various tablet sizes and concentrations catering to different applications. Major players like OxyChem, Solenis (formerly Clearon), and several Asian chemical manufacturers dominate the market landscape, benefiting from established production capabilities and extensive distribution networks. The competitive landscape is characterized by both established players and regional manufacturers vying for market share, leading to price competitiveness and product innovation. Future growth hinges on technological advancements in TCCA production to enhance its efficiency and reduce environmental impact, as well as further penetration in developing regions with expanding sanitation needs.
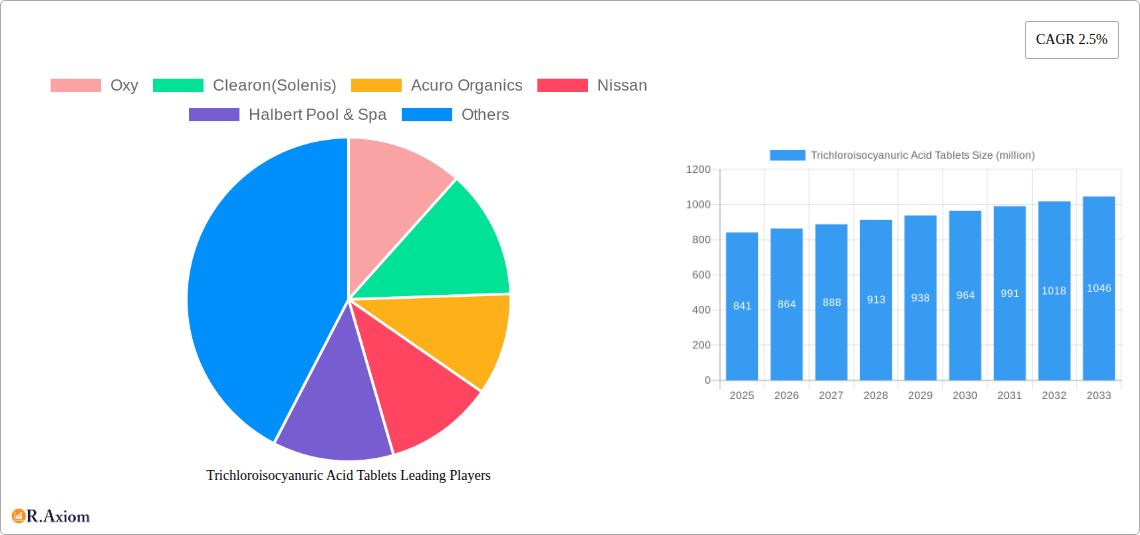
Trichloroisocyanuric Acid Tablets Market Size (In Million)
The competitive dynamics suggest a blend of global and regional players. The established players, such as OxyChem and Solenis, leverage their brand recognition and distribution channels to maintain a strong market presence. However, several regional players, particularly from Asia, contribute significantly to production and supply, reflecting a geographically diversified market. Future market growth will be impacted by factors including raw material costs, regulatory changes related to chemical usage in water treatment, and innovations in water treatment technologies. While precise regional market shares are unavailable, we can reasonably expect a significant share to be held by regions with high swimming pool density and developing economies undergoing sanitation upgrades. Continued emphasis on sustainable practices and environmentally friendly alternatives will influence the long-term growth trajectory of this market.
Trichloroisocyanuric Acid Tablets Company Market Share
Trichloroisocyanuric Acid Tablets Market Report: 2019-2033
This comprehensive report provides a detailed analysis of the global Trichloroisocyanuric Acid Tablets market, covering the period from 2019 to 2033. It offers in-depth insights into market size, growth drivers, challenges, opportunities, and key players, equipping stakeholders with actionable intelligence for strategic decision-making. The report uses 2025 as its base year and provides forecasts until 2033, drawing on historical data from 2019-2024. The global market size in 2025 is estimated to be $XX million.
Trichloroisocyanuric Acid Tablets Market Concentration & Innovation
This section analyzes the market's competitive landscape, highlighting concentration levels, innovation drivers, and regulatory influences. The global market exhibits a moderately concentrated structure, with the top five players, including Oxy, Clearon (Solenis), and Acuro Organics, holding an estimated XX% market share in 2025. Smaller players such as Nippon Soda and Shikoku Chem contribute significantly to overall market volume.
- Market Concentration: The Herfindahl-Hirschman Index (HHI) is estimated at XX, indicating a moderately concentrated market.
- Innovation Drivers: Focus on sustainable formulations, enhanced efficacy, and convenient packaging drives innovation. The development of slow-release tablets and eco-friendly alternatives is gaining traction.
- Regulatory Framework: Stringent regulations concerning water safety and environmental impact influence product formulations and manufacturing processes. Compliance costs represent a significant portion of operational expenditure, estimated at XX million annually for the top players.
- Product Substitutes: Alternative sanitizing agents such as chlorine dioxide and other halogen-based disinfectants pose competitive pressure, but the established cost-effectiveness of Trichloroisocyanuric Acid Tablets limits their market penetration.
- End-User Trends: Growing demand from the swimming pool and spa industry, along with increasing use in water treatment plants and industrial applications, fuels market growth.
- M&A Activities: The past five years witnessed XX major M&A deals, with a combined value exceeding $XX million, primarily driven by the pursuit of increased market share and product diversification. Smaller, niche players are being acquired by larger conglomerates to extend their reach.
Trichloroisocyanuric Acid Tablets Industry Trends & Insights
The Trichloroisocyanuric Acid Tablets market is witnessing robust growth, driven by several key factors. The estimated CAGR for the forecast period (2025-2033) is XX%, reflecting strong demand from various sectors. Market penetration is expected to increase by approximately XX% by 2033, particularly in developing economies.
Significant technological advancements, such as the development of more efficient and environmentally friendly formulations, are shaping market dynamics. Consumer preference for convenient and easy-to-use products is driving demand for pre-measured tablets. The industry is characterized by intense competition, with companies engaging in price wars, product innovation, and marketing strategies to enhance their market share. The industry is facing challenges related to fluctuating raw material prices and environmental concerns surrounding the use of chlorine-based products. However, these are mitigated through the adoption of sustainable manufacturing processes and responsible sourcing.
Dominant Markets & Segments in Trichloroisocyanuric Acid Tablets
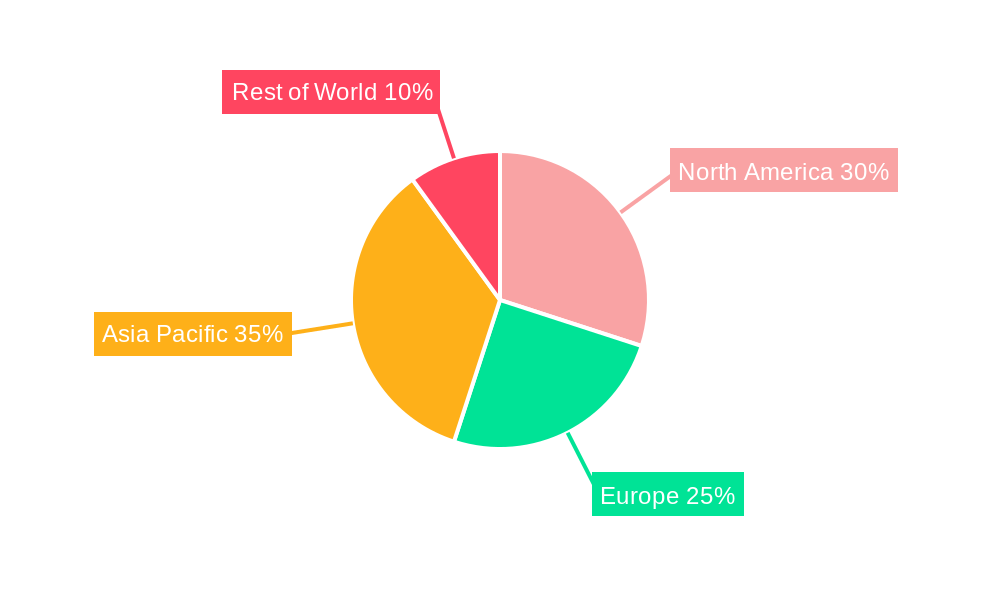
The North American region dominated the global market in 2025, accounting for approximately XX% of the total market volume. This dominance stems from several factors:
- Key Drivers:
- Strong demand from the residential and commercial swimming pool sector.
- Well-established distribution networks.
- Stringent water quality regulations, driving the adoption of effective sanitation solutions.
- High per capita income and spending on leisure activities.
Other significant markets include Europe and Asia-Pacific, both experiencing considerable growth. The market is largely segmented based on application (swimming pools, water treatment, industrial use), packaging (bulk, tablets), and end-user (residential, commercial). The residential sector accounted for the largest share in 2025 due to the increasing number of households with private swimming pools.
Trichloroisocyanuric Acid Tablets Product Developments
Recent product innovations focus on improved dissolution rates, enhanced stability, and the incorporation of additional functionalities like algaecides and flocculants. These developments aim to provide superior cleaning efficiency and ease of use, thus catering to evolving consumer preferences and industry demands. The focus on eco-friendly formulations is gaining momentum, with several manufacturers investing in the development of biodegradable and less environmentally damaging alternatives. This shift towards sustainability aligns with increasing regulatory scrutiny and consumer demand for environmentally responsible products.
Report Scope & Segmentation Analysis
This report segments the Trichloroisocyanuric Acid Tablets market based on geography (North America, Europe, Asia-Pacific, Rest of the World), application (swimming pools, water treatment, industrial applications), packaging (bulk, tablets), and end-user (residential, commercial, industrial). Each segment's growth trajectory, market size, and competitive landscape are analyzed separately, providing granular insights for informed business strategies. Detailed growth projections for each segment are presented in the full report, forecasting market values up to 2033. The competitive dynamics in each segment vary due to the differences in product requirements, regulatory frameworks, and pricing strategies.
Key Drivers of Trichloroisocyanuric Acid Tablets Growth
The growth of the Trichloroisocyanuric Acid Tablets market is driven by several factors: the increasing demand from the swimming pool and spa industry, expanding water treatment infrastructure, and the rising adoption of these tablets in various industrial applications. Technological advancements leading to more efficient and safer formulations further contribute to market growth. Furthermore, supportive government policies and regulations promoting water safety and hygiene provide a positive environment for market expansion.
Challenges in the Trichloroisocyanuric Acid Tablets Sector
The Trichloroisocyanuric Acid Tablets sector faces challenges such as fluctuating raw material prices, which impact production costs and profitability. Stringent environmental regulations require manufacturers to adopt sustainable practices, increasing operational expenses. Intense competition from substitute products and the presence of numerous players create pricing pressures. These challenges contribute to fluctuating profit margins in the industry. Furthermore, maintaining consistent supply chain operations amidst global uncertainties also presents a significant challenge for market players.
Emerging Opportunities in Trichloroisocyanuric Acid Tablets
Emerging opportunities lie in the expansion into developing economies, where water treatment infrastructure is still under development. The increasing demand for efficient and safe water sanitation solutions creates a significant growth potential. The development of innovative formulations, such as slow-release tablets and eco-friendly alternatives, also presents promising opportunities. Further, personalized packaging and targeted marketing strategies can unlock substantial market expansion.
Leading Players in the Trichloroisocyanuric Acid Tablets Market
- Oxy
- Clearon (Solenis)
- Acuro Organics
- Nissan
- Halbert Pool & Spa
- Fluidra
- Ercros
- Nankai Chem
- Nippon Soda
- Shikoku Chem
- Jiheng Chem
- Heze Huayi
- Zhucheng Taisheng
- Lantai Chem
- Juancheng Kangtai
- Ruibang Chem
- Shandong Goldenstar Water Environment Technology
- Shandong Daming
- KF Chem
Key Developments in Trichloroisocyanuric Acid Tablets Industry
- 2022-Q4: Oxy launched a new line of slow-release Trichloroisocyanuric Acid Tablets, emphasizing enhanced efficacy and reduced environmental impact.
- 2023-Q1: Solenis acquired a smaller competitor, expanding its market share and product portfolio.
- 2023-Q3: Several industry players announced price increases to offset rising raw material costs.
- 2024-Q2: New environmental regulations came into effect in several European countries, influencing product formulations and manufacturing processes. Further details on specific developments and their impact are included in the full report.
Strategic Outlook for Trichloroisocyanuric Acid Tablets Market
The Trichloroisocyanuric Acid Tablets market is poised for continued growth, driven by strong demand from key sectors and emerging opportunities in developing markets. Innovation in product formulations, sustainable manufacturing practices, and strategic partnerships will be critical for success. Companies focusing on environmentally friendly solutions and catering to evolving consumer preferences will gain a competitive edge. The long-term outlook is positive, with substantial growth potential across various segments and geographies.
Trichloroisocyanuric Acid Tablets Segmentation
-
1. Application
- 1.1. Water Treatment
- 1.2. Waste Water Treatment
- 1.3. Other
-
2. Type
- 2.1. 2g
- 2.2. 5g
- 2.3. 20g
- 2.4. 250g
- 2.5. Other
Trichloroisocyanuric Acid Tablets Segmentation By Geography
-
1. North America
- 1.1. United States
- 1.2. Canada
- 1.3. Mexico
-
2. South America
- 2.1. Brazil
- 2.2. Argentina
- 2.3. Rest of South America
-
3. Europe
- 3.1. United Kingdom
- 3.2. Germany
- 3.3. France
- 3.4. Italy
- 3.5. Spain
- 3.6. Russia
- 3.7. Benelux
- 3.8. Nordics
- 3.9. Rest of Europe
-
4. Middle East & Africa
- 4.1. Turkey
- 4.2. Israel
- 4.3. GCC
- 4.4. North Africa
- 4.5. South Africa
- 4.6. Rest of Middle East & Africa
-
5. Asia Pacific
- 5.1. China
- 5.2. India
- 5.3. Japan
- 5.4. South Korea
- 5.5. ASEAN
- 5.6. Oceania
- 5.7. Rest of Asia Pacific
Trichloroisocyanuric Acid Tablets Regional Market Share
Geographic Coverage of Trichloroisocyanuric Acid Tablets
Trichloroisocyanuric Acid Tablets REPORT HIGHLIGHTS
| Aspects | Details |
|---|---|
| Study Period | 2020-2034 |
| Base Year | 2025 |
| Estimated Year | 2026 |
| Forecast Period | 2026-2034 |
| Historical Period | 2020-2025 |
| Growth Rate | CAGR of 2.5% from 2020-2034 |
| Segmentation |
|
Table of Contents
- 1. Introduction
- 1.1. Research Scope
- 1.2. Market Segmentation
- 1.3. Research Objective
- 1.4. Definitions and Assumptions
- 2. Executive Summary
- 2.1. Market Snapshot
- 3. Market Dynamics
- 3.1. Market Drivers
- 3.2. Market Restrains
- 3.3. Market Trends
- 3.4. Market Opportunities
- 4. Market Factor Analysis
- 4.1. Porters Five Forces
- 4.1.1. Bargaining Power of Suppliers
- 4.1.2. Bargaining Power of Buyers
- 4.1.3. Threat of New Entrants
- 4.1.4. Threat of Substitutes
- 4.1.5. Competitive Rivalry
- 4.2. PESTEL analysis
- 4.3. BCG Analysis
- 4.3.1. Stars (High Growth, High Market Share)
- 4.3.2. Cash Cows (Low Growth, High Market Share)
- 4.3.3. Question Mark (High Growth, Low Market Share)
- 4.3.4. Dogs (Low Growth, Low Market Share)
- 4.4. Ansoff Matrix Analysis
- 4.5. Supply Chain Analysis
- 4.6. Regulatory Landscape
- 4.7. Current Market Potential and Opportunity Assessment (TAM–SAM–SOM Framework)
- 4.8. RAX Analyst Note
- 4.1. Porters Five Forces
- 5. Market Analysis, Insights and Forecast 2021-2033
- 5.1. Market Analysis, Insights and Forecast - by Application
- 5.1.1. Water Treatment
- 5.1.2. Waste Water Treatment
- 5.1.3. Other
- 5.2. Market Analysis, Insights and Forecast - by Type
- 5.2.1. 2g
- 5.2.2. 5g
- 5.2.3. 20g
- 5.2.4. 250g
- 5.2.5. Other
- 5.3. Market Analysis, Insights and Forecast - by Region
- 5.3.1. North America
- 5.3.2. South America
- 5.3.3. Europe
- 5.3.4. Middle East & Africa
- 5.3.5. Asia Pacific
- 5.1. Market Analysis, Insights and Forecast - by Application
- 6. Global Trichloroisocyanuric Acid Tablets Analysis, Insights and Forecast, 2021-2033
- 6.1. Market Analysis, Insights and Forecast - by Application
- 6.1.1. Water Treatment
- 6.1.2. Waste Water Treatment
- 6.1.3. Other
- 6.2. Market Analysis, Insights and Forecast - by Type
- 6.2.1. 2g
- 6.2.2. 5g
- 6.2.3. 20g
- 6.2.4. 250g
- 6.2.5. Other
- 6.1. Market Analysis, Insights and Forecast - by Application
- 7. North America Trichloroisocyanuric Acid Tablets Analysis, Insights and Forecast, 2020-2032
- 7.1. Market Analysis, Insights and Forecast - by Application
- 7.1.1. Water Treatment
- 7.1.2. Waste Water Treatment
- 7.1.3. Other
- 7.2. Market Analysis, Insights and Forecast - by Type
- 7.2.1. 2g
- 7.2.2. 5g
- 7.2.3. 20g
- 7.2.4. 250g
- 7.2.5. Other
- 7.1. Market Analysis, Insights and Forecast - by Application
- 8. South America Trichloroisocyanuric Acid Tablets Analysis, Insights and Forecast, 2020-2032
- 8.1. Market Analysis, Insights and Forecast - by Application
- 8.1.1. Water Treatment
- 8.1.2. Waste Water Treatment
- 8.1.3. Other
- 8.2. Market Analysis, Insights and Forecast - by Type
- 8.2.1. 2g
- 8.2.2. 5g
- 8.2.3. 20g
- 8.2.4. 250g
- 8.2.5. Other
- 8.1. Market Analysis, Insights and Forecast - by Application
- 9. Europe Trichloroisocyanuric Acid Tablets Analysis, Insights and Forecast, 2020-2032
- 9.1. Market Analysis, Insights and Forecast - by Application
- 9.1.1. Water Treatment
- 9.1.2. Waste Water Treatment
- 9.1.3. Other
- 9.2. Market Analysis, Insights and Forecast - by Type
- 9.2.1. 2g
- 9.2.2. 5g
- 9.2.3. 20g
- 9.2.4. 250g
- 9.2.5. Other
- 9.1. Market Analysis, Insights and Forecast - by Application
- 10. Middle East & Africa Trichloroisocyanuric Acid Tablets Analysis, Insights and Forecast, 2020-2032
- 10.1. Market Analysis, Insights and Forecast - by Application
- 10.1.1. Water Treatment
- 10.1.2. Waste Water Treatment
- 10.1.3. Other
- 10.2. Market Analysis, Insights and Forecast - by Type
- 10.2.1. 2g
- 10.2.2. 5g
- 10.2.3. 20g
- 10.2.4. 250g
- 10.2.5. Other
- 10.1. Market Analysis, Insights and Forecast - by Application
- 11. Asia Pacific Trichloroisocyanuric Acid Tablets Analysis, Insights and Forecast, 2020-2032
- 11.1. Market Analysis, Insights and Forecast - by Application
- 11.1.1. Water Treatment
- 11.1.2. Waste Water Treatment
- 11.1.3. Other
- 11.2. Market Analysis, Insights and Forecast - by Type
- 11.2.1. 2g
- 11.2.2. 5g
- 11.2.3. 20g
- 11.2.4. 250g
- 11.2.5. Other
- 11.1. Market Analysis, Insights and Forecast - by Application
- 12. Competitive Analysis
- 12.1. Company Profiles
- 12.1.1 Oxy
- 12.1.1.1. Company Overview
- 12.1.1.2. Products
- 12.1.1.3. Company Financials
- 12.1.1.4. SWOT Analysis
- 12.1.2 Clearon(Solenis)
- 12.1.2.1. Company Overview
- 12.1.2.2. Products
- 12.1.2.3. Company Financials
- 12.1.2.4. SWOT Analysis
- 12.1.3 Acuro Organics
- 12.1.3.1. Company Overview
- 12.1.3.2. Products
- 12.1.3.3. Company Financials
- 12.1.3.4. SWOT Analysis
- 12.1.4 Nissan
- 12.1.4.1. Company Overview
- 12.1.4.2. Products
- 12.1.4.3. Company Financials
- 12.1.4.4. SWOT Analysis
- 12.1.5 Halbert Pool & Spa
- 12.1.5.1. Company Overview
- 12.1.5.2. Products
- 12.1.5.3. Company Financials
- 12.1.5.4. SWOT Analysis
- 12.1.6 Fluidra
- 12.1.6.1. Company Overview
- 12.1.6.2. Products
- 12.1.6.3. Company Financials
- 12.1.6.4. SWOT Analysis
- 12.1.7 Ercros
- 12.1.7.1. Company Overview
- 12.1.7.2. Products
- 12.1.7.3. Company Financials
- 12.1.7.4. SWOT Analysis
- 12.1.8 Nankai Chem
- 12.1.8.1. Company Overview
- 12.1.8.2. Products
- 12.1.8.3. Company Financials
- 12.1.8.4. SWOT Analysis
- 12.1.9 Nippon Soda
- 12.1.9.1. Company Overview
- 12.1.9.2. Products
- 12.1.9.3. Company Financials
- 12.1.9.4. SWOT Analysis
- 12.1.10 Shikoku Chem
- 12.1.10.1. Company Overview
- 12.1.10.2. Products
- 12.1.10.3. Company Financials
- 12.1.10.4. SWOT Analysis
- 12.1.11 Jiheng Chem
- 12.1.11.1. Company Overview
- 12.1.11.2. Products
- 12.1.11.3. Company Financials
- 12.1.11.4. SWOT Analysis
- 12.1.12 Heze Huayi
- 12.1.12.1. Company Overview
- 12.1.12.2. Products
- 12.1.12.3. Company Financials
- 12.1.12.4. SWOT Analysis
- 12.1.13 Zhucheng Taisheng
- 12.1.13.1. Company Overview
- 12.1.13.2. Products
- 12.1.13.3. Company Financials
- 12.1.13.4. SWOT Analysis
- 12.1.14 Lantai Chem
- 12.1.14.1. Company Overview
- 12.1.14.2. Products
- 12.1.14.3. Company Financials
- 12.1.14.4. SWOT Analysis
- 12.1.15 Juancheng Kangtai
- 12.1.15.1. Company Overview
- 12.1.15.2. Products
- 12.1.15.3. Company Financials
- 12.1.15.4. SWOT Analysis
- 12.1.16 Ruibang Chem
- 12.1.16.1. Company Overview
- 12.1.16.2. Products
- 12.1.16.3. Company Financials
- 12.1.16.4. SWOT Analysis
- 12.1.17 Shandong Goldenstar Water Environment Technology
- 12.1.17.1. Company Overview
- 12.1.17.2. Products
- 12.1.17.3. Company Financials
- 12.1.17.4. SWOT Analysis
- 12.1.18 Shandong Daming
- 12.1.18.1. Company Overview
- 12.1.18.2. Products
- 12.1.18.3. Company Financials
- 12.1.18.4. SWOT Analysis
- 12.1.19 KF Chem
- 12.1.19.1. Company Overview
- 12.1.19.2. Products
- 12.1.19.3. Company Financials
- 12.1.19.4. SWOT Analysis
- 12.1.1 Oxy
- 12.2. Market Entropy
- 12.2.1 Company's Key Areas Served
- 12.2.2 Recent Developments
- 12.3. Company Market Share Analysis 2025
- 12.3.1 Top 5 Companies Market Share Analysis
- 12.3.2 Top 3 Companies Market Share Analysis
- 12.4. List of Potential Customers
- 13. Research Methodology
List of Figures
- Figure 1: Global Trichloroisocyanuric Acid Tablets Revenue Breakdown (million, %) by Region 2025 & 2033
- Figure 2: North America Trichloroisocyanuric Acid Tablets Revenue (million), by Application 2025 & 2033
- Figure 3: North America Trichloroisocyanuric Acid Tablets Revenue Share (%), by Application 2025 & 2033
- Figure 4: North America Trichloroisocyanuric Acid Tablets Revenue (million), by Type 2025 & 2033
- Figure 5: North America Trichloroisocyanuric Acid Tablets Revenue Share (%), by Type 2025 & 2033
- Figure 6: North America Trichloroisocyanuric Acid Tablets Revenue (million), by Country 2025 & 2033
- Figure 7: North America Trichloroisocyanuric Acid Tablets Revenue Share (%), by Country 2025 & 2033
- Figure 8: South America Trichloroisocyanuric Acid Tablets Revenue (million), by Application 2025 & 2033
- Figure 9: South America Trichloroisocyanuric Acid Tablets Revenue Share (%), by Application 2025 & 2033
- Figure 10: South America Trichloroisocyanuric Acid Tablets Revenue (million), by Type 2025 & 2033
- Figure 11: South America Trichloroisocyanuric Acid Tablets Revenue Share (%), by Type 2025 & 2033
- Figure 12: South America Trichloroisocyanuric Acid Tablets Revenue (million), by Country 2025 & 2033
- Figure 13: South America Trichloroisocyanuric Acid Tablets Revenue Share (%), by Country 2025 & 2033
- Figure 14: Europe Trichloroisocyanuric Acid Tablets Revenue (million), by Application 2025 & 2033
- Figure 15: Europe Trichloroisocyanuric Acid Tablets Revenue Share (%), by Application 2025 & 2033
- Figure 16: Europe Trichloroisocyanuric Acid Tablets Revenue (million), by Type 2025 & 2033
- Figure 17: Europe Trichloroisocyanuric Acid Tablets Revenue Share (%), by Type 2025 & 2033
- Figure 18: Europe Trichloroisocyanuric Acid Tablets Revenue (million), by Country 2025 & 2033
- Figure 19: Europe Trichloroisocyanuric Acid Tablets Revenue Share (%), by Country 2025 & 2033
- Figure 20: Middle East & Africa Trichloroisocyanuric Acid Tablets Revenue (million), by Application 2025 & 2033
- Figure 21: Middle East & Africa Trichloroisocyanuric Acid Tablets Revenue Share (%), by Application 2025 & 2033
- Figure 22: Middle East & Africa Trichloroisocyanuric Acid Tablets Revenue (million), by Type 2025 & 2033
- Figure 23: Middle East & Africa Trichloroisocyanuric Acid Tablets Revenue Share (%), by Type 2025 & 2033
- Figure 24: Middle East & Africa Trichloroisocyanuric Acid Tablets Revenue (million), by Country 2025 & 2033
- Figure 25: Middle East & Africa Trichloroisocyanuric Acid Tablets Revenue Share (%), by Country 2025 & 2033
- Figure 26: Asia Pacific Trichloroisocyanuric Acid Tablets Revenue (million), by Application 2025 & 2033
- Figure 27: Asia Pacific Trichloroisocyanuric Acid Tablets Revenue Share (%), by Application 2025 & 2033
- Figure 28: Asia Pacific Trichloroisocyanuric Acid Tablets Revenue (million), by Type 2025 & 2033
- Figure 29: Asia Pacific Trichloroisocyanuric Acid Tablets Revenue Share (%), by Type 2025 & 2033
- Figure 30: Asia Pacific Trichloroisocyanuric Acid Tablets Revenue (million), by Country 2025 & 2033
- Figure 31: Asia Pacific Trichloroisocyanuric Acid Tablets Revenue Share (%), by Country 2025 & 2033
List of Tables
- Table 1: Global Trichloroisocyanuric Acid Tablets Revenue million Forecast, by Application 2020 & 2033
- Table 2: Global Trichloroisocyanuric Acid Tablets Revenue million Forecast, by Type 2020 & 2033
- Table 3: Global Trichloroisocyanuric Acid Tablets Revenue million Forecast, by Region 2020 & 2033
- Table 4: Global Trichloroisocyanuric Acid Tablets Revenue million Forecast, by Application 2020 & 2033
- Table 5: Global Trichloroisocyanuric Acid Tablets Revenue million Forecast, by Type 2020 & 2033
- Table 6: Global Trichloroisocyanuric Acid Tablets Revenue million Forecast, by Country 2020 & 2033
- Table 7: United States Trichloroisocyanuric Acid Tablets Revenue (million) Forecast, by Application 2020 & 2033
- Table 8: Canada Trichloroisocyanuric Acid Tablets Revenue (million) Forecast, by Application 2020 & 2033
- Table 9: Mexico Trichloroisocyanuric Acid Tablets Revenue (million) Forecast, by Application 2020 & 2033
- Table 10: Global Trichloroisocyanuric Acid Tablets Revenue million Forecast, by Application 2020 & 2033
- Table 11: Global Trichloroisocyanuric Acid Tablets Revenue million Forecast, by Type 2020 & 2033
- Table 12: Global Trichloroisocyanuric Acid Tablets Revenue million Forecast, by Country 2020 & 2033
- Table 13: Brazil Trichloroisocyanuric Acid Tablets Revenue (million) Forecast, by Application 2020 & 2033
- Table 14: Argentina Trichloroisocyanuric Acid Tablets Revenue (million) Forecast, by Application 2020 & 2033
- Table 15: Rest of South America Trichloroisocyanuric Acid Tablets Revenue (million) Forecast, by Application 2020 & 2033
- Table 16: Global Trichloroisocyanuric Acid Tablets Revenue million Forecast, by Application 2020 & 2033
- Table 17: Global Trichloroisocyanuric Acid Tablets Revenue million Forecast, by Type 2020 & 2033
- Table 18: Global Trichloroisocyanuric Acid Tablets Revenue million Forecast, by Country 2020 & 2033
- Table 19: United Kingdom Trichloroisocyanuric Acid Tablets Revenue (million) Forecast, by Application 2020 & 2033
- Table 20: Germany Trichloroisocyanuric Acid Tablets Revenue (million) Forecast, by Application 2020 & 2033
- Table 21: France Trichloroisocyanuric Acid Tablets Revenue (million) Forecast, by Application 2020 & 2033
- Table 22: Italy Trichloroisocyanuric Acid Tablets Revenue (million) Forecast, by Application 2020 & 2033
- Table 23: Spain Trichloroisocyanuric Acid Tablets Revenue (million) Forecast, by Application 2020 & 2033
- Table 24: Russia Trichloroisocyanuric Acid Tablets Revenue (million) Forecast, by Application 2020 & 2033
- Table 25: Benelux Trichloroisocyanuric Acid Tablets Revenue (million) Forecast, by Application 2020 & 2033
- Table 26: Nordics Trichloroisocyanuric Acid Tablets Revenue (million) Forecast, by Application 2020 & 2033
- Table 27: Rest of Europe Trichloroisocyanuric Acid Tablets Revenue (million) Forecast, by Application 2020 & 2033
- Table 28: Global Trichloroisocyanuric Acid Tablets Revenue million Forecast, by Application 2020 & 2033
- Table 29: Global Trichloroisocyanuric Acid Tablets Revenue million Forecast, by Type 2020 & 2033
- Table 30: Global Trichloroisocyanuric Acid Tablets Revenue million Forecast, by Country 2020 & 2033
- Table 31: Turkey Trichloroisocyanuric Acid Tablets Revenue (million) Forecast, by Application 2020 & 2033
- Table 32: Israel Trichloroisocyanuric Acid Tablets Revenue (million) Forecast, by Application 2020 & 2033
- Table 33: GCC Trichloroisocyanuric Acid Tablets Revenue (million) Forecast, by Application 2020 & 2033
- Table 34: North Africa Trichloroisocyanuric Acid Tablets Revenue (million) Forecast, by Application 2020 & 2033
- Table 35: South Africa Trichloroisocyanuric Acid Tablets Revenue (million) Forecast, by Application 2020 & 2033
- Table 36: Rest of Middle East & Africa Trichloroisocyanuric Acid Tablets Revenue (million) Forecast, by Application 2020 & 2033
- Table 37: Global Trichloroisocyanuric Acid Tablets Revenue million Forecast, by Application 2020 & 2033
- Table 38: Global Trichloroisocyanuric Acid Tablets Revenue million Forecast, by Type 2020 & 2033
- Table 39: Global Trichloroisocyanuric Acid Tablets Revenue million Forecast, by Country 2020 & 2033
- Table 40: China Trichloroisocyanuric Acid Tablets Revenue (million) Forecast, by Application 2020 & 2033
- Table 41: India Trichloroisocyanuric Acid Tablets Revenue (million) Forecast, by Application 2020 & 2033
- Table 42: Japan Trichloroisocyanuric Acid Tablets Revenue (million) Forecast, by Application 2020 & 2033
- Table 43: South Korea Trichloroisocyanuric Acid Tablets Revenue (million) Forecast, by Application 2020 & 2033
- Table 44: ASEAN Trichloroisocyanuric Acid Tablets Revenue (million) Forecast, by Application 2020 & 2033
- Table 45: Oceania Trichloroisocyanuric Acid Tablets Revenue (million) Forecast, by Application 2020 & 2033
- Table 46: Rest of Asia Pacific Trichloroisocyanuric Acid Tablets Revenue (million) Forecast, by Application 2020 & 2033
Frequently Asked Questions
1. What is the projected Compound Annual Growth Rate (CAGR) of the Trichloroisocyanuric Acid Tablets?
The projected CAGR is approximately 2.5%.
2. Which companies are prominent players in the Trichloroisocyanuric Acid Tablets?
Key companies in the market include Oxy, Clearon(Solenis), Acuro Organics, Nissan, Halbert Pool & Spa, Fluidra, Ercros, Nankai Chem, Nippon Soda, Shikoku Chem, Jiheng Chem, Heze Huayi, Zhucheng Taisheng, Lantai Chem, Juancheng Kangtai, Ruibang Chem, Shandong Goldenstar Water Environment Technology, Shandong Daming, KF Chem.
3. What are the main segments of the Trichloroisocyanuric Acid Tablets?
The market segments include Application, Type.
4. Can you provide details about the market size?
The market size is estimated to be USD 841 million as of 2022.
5. What are some drivers contributing to market growth?
N/A
6. What are the notable trends driving market growth?
N/A
7. Are there any restraints impacting market growth?
N/A
8. Can you provide examples of recent developments in the market?
N/A
9. What pricing options are available for accessing the report?
Pricing options include single-user, multi-user, and enterprise licenses priced at USD 2900.00, USD 4350.00, and USD 5800.00 respectively.
10. Is the market size provided in terms of value or volume?
The market size is provided in terms of value, measured in million.
11. Are there any specific market keywords associated with the report?
Yes, the market keyword associated with the report is "Trichloroisocyanuric Acid Tablets," which aids in identifying and referencing the specific market segment covered.
12. How do I determine which pricing option suits my needs best?
The pricing options vary based on user requirements and access needs. Individual users may opt for single-user licenses, while businesses requiring broader access may choose multi-user or enterprise licenses for cost-effective access to the report.
13. Are there any additional resources or data provided in the Trichloroisocyanuric Acid Tablets report?
While the report offers comprehensive insights, it's advisable to review the specific contents or supplementary materials provided to ascertain if additional resources or data are available.
14. How can I stay updated on further developments or reports in the Trichloroisocyanuric Acid Tablets?
To stay informed about further developments, trends, and reports in the Trichloroisocyanuric Acid Tablets, consider subscribing to industry newsletters, following relevant companies and organizations, or regularly checking reputable industry news sources and publications.
Methodology
Step 1 - Identification of Relevant Samples Size from Population Database


Step 2 - Approaches for Defining Global Market Size (Value, Volume* & Price*)

Note*: In applicable scenarios
Step 3 - Data Sources
Primary Research
- Web Analytics
- Survey Reports
- Research Institute
- Latest Research Reports
- Opinion Leaders
Secondary Research
- Annual Reports
- White Paper
- Latest Press Release
- Industry Association
- Paid Database
- Investor Presentations

Step 4 - Data Triangulation
Involves using different sources of information in order to increase the validity of a study
These sources are likely to be stakeholders in a program - participants, other researchers, program staff, other community members, and so on.
Then we put all data in single framework & apply various statistical tools to find out the dynamic on the market.
During the analysis stage, feedback from the stakeholder groups would be compared to determine areas of agreement as well as areas of divergence