

Key Insights
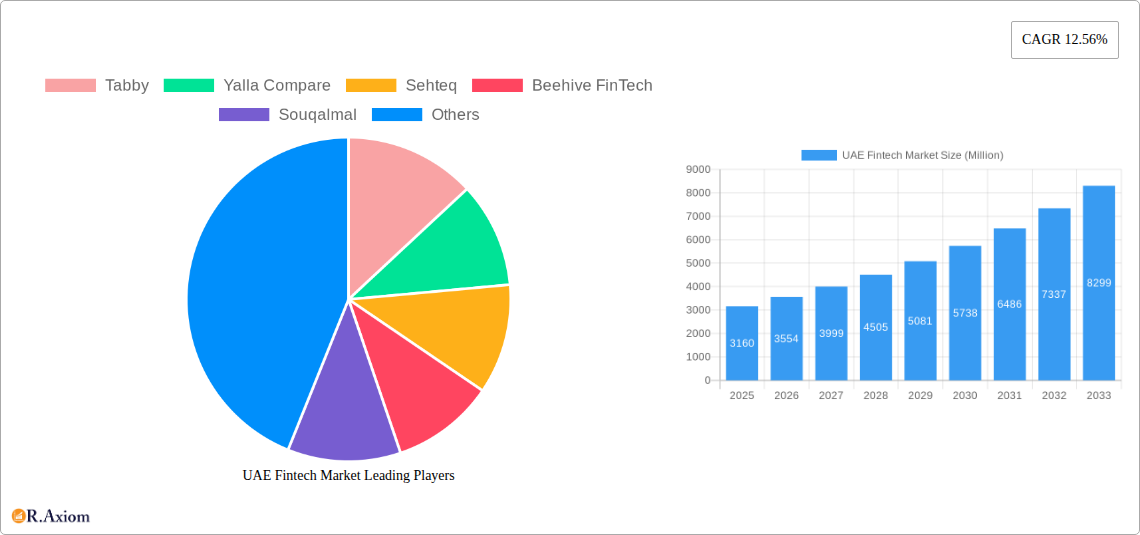
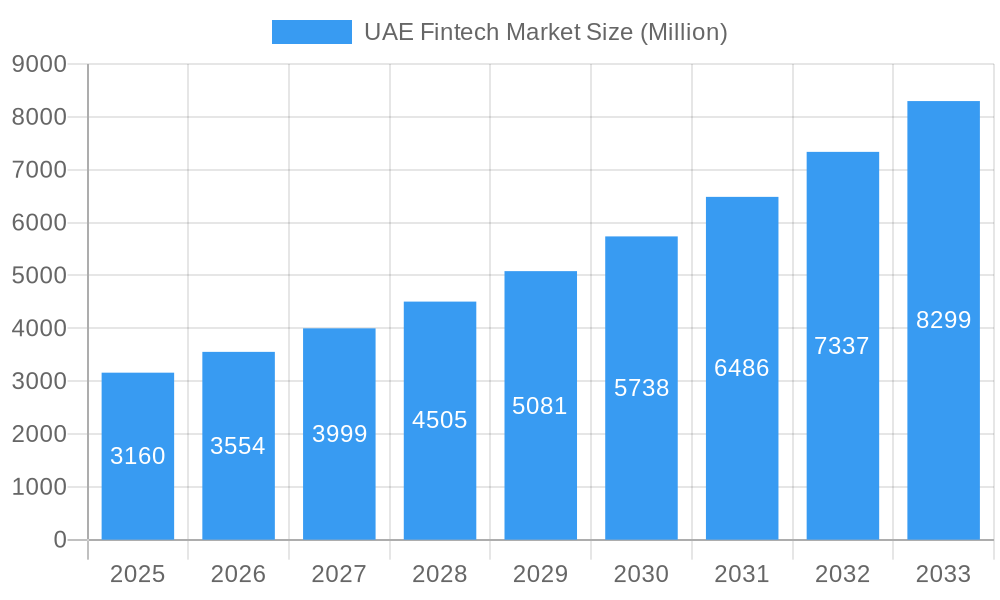
The UAE Fintech market, valued at $3.16 billion in 2025, is experiencing robust growth, projected to expand at a Compound Annual Growth Rate (CAGR) of 12.56% from 2025 to 2033. This surge is fueled by several key factors. The UAE's forward-thinking regulatory environment, fostering innovation and attracting substantial foreign investment, is a significant driver. The burgeoning adoption of smartphones and internet penetration, coupled with a young and tech-savvy population, creates a fertile ground for Fintech solutions. Furthermore, increasing demand for convenient and efficient financial services, particularly among the unbanked and underbanked segments, is significantly contributing to market expansion. Government initiatives promoting digital transformation and financial inclusion further accelerate this growth. Competition amongst established players like Tabby, Yalla Compare, and Sarwa, alongside the emergence of innovative startups, is driving product diversification and enhancing customer experience, leading to increased market penetration.
UAE Fintech Market Market Size (In Billion)
However, challenges remain. Maintaining robust cybersecurity measures and mitigating the risks associated with data breaches are crucial. Ensuring regulatory compliance and adapting to evolving technological landscapes also present ongoing hurdles for market participants. The competitive landscape requires continuous innovation and strategic partnerships to maintain a leading edge. Despite these challenges, the long-term outlook for the UAE Fintech market remains highly positive, driven by sustained economic growth, technological advancements, and the government's commitment to fostering a thriving digital ecosystem. The market is expected to reach significant heights by 2033, surpassing initial projections due to the aforementioned drivers and the consistently high adoption rates of fintech solutions within the UAE.
UAE Fintech Market Company Market Share
UAE Fintech Market: A Comprehensive Report (2019-2033)
This in-depth report provides a comprehensive analysis of the UAE Fintech market, covering its evolution from 2019 to 2024, the current state in 2025, and projections through 2033. It delves into market concentration, innovation, industry trends, dominant segments, product developments, and key players, offering invaluable insights for investors, stakeholders, and industry professionals. The report leverages extensive data and analysis to illuminate growth drivers, challenges, and emerging opportunities within this dynamic market. With a focus on actionable intelligence, this report is essential for navigating the complexities of the UAE Fintech landscape. The total market size in 2025 is estimated at xx Million, with a projected CAGR of xx% from 2025 to 2033.
UAE Fintech Market Market Concentration & Innovation
The UAE Fintech market exhibits a dynamic interplay between established players and emerging startups. Market concentration is moderate, with a few dominant players holding significant market share, but a considerable number of smaller firms driving innovation. Regulatory frameworks, while supportive of fintech growth, are constantly evolving, fostering a competitive landscape. The market witnesses substantial M&A activity, with deal values ranging from xx Million to xx Million, reflecting the increasing consolidation and strategic expansion within the sector. Innovation is fueled by several factors:
- Technological advancements: Blockchain, AI, and cloud computing are transforming financial services.
- Government initiatives: Supportive regulatory policies and digital transformation strategies are encouraging innovation.
- Rising consumer adoption: Increased smartphone penetration and digital literacy drive demand for fintech solutions.
- Foreign investment: Significant inflows of foreign capital are funding startups and driving expansion.
End-user trends show a strong preference for convenient, user-friendly, and secure digital financial services, pushing fintech companies to constantly improve their offerings.
UAE Fintech Market Industry Trends & Insights
The UAE Fintech market is experiencing robust growth, driven by several key factors. The consistently high CAGR demonstrates its potential. This growth is fueled by:
- Increased smartphone penetration and internet access: A digitally savvy population readily adopts new technologies.
- Government support for digital transformation: Initiatives like the UAE’s Vision 2021 are accelerating fintech adoption.
- Growing demand for convenient and accessible financial services: Fintech solutions address the needs of both individuals and businesses.
- Rising adoption of mobile payments and digital wallets: Cashless transactions are becoming increasingly prevalent.
- Expansion of financial inclusion: Fintech solutions are bridging the gap for underbanked populations.
- Competitive landscape: Intense competition drives innovation and efficiency.
Market penetration of various fintech solutions varies widely, with mobile payments exhibiting the highest penetration, followed by digital lending and investment platforms.
Dominant Markets & Segments in UAE Fintech Market
The UAE's Fintech market is dominated by the major urban centers, such as Dubai and Abu Dhabi, due to their robust infrastructure, concentration of financial institutions, and higher levels of digital literacy.
- Key Drivers for Dominance:
- Developed infrastructure: Reliable internet access and advanced digital infrastructure support fintech operations.
- Government support: Favorable regulatory frameworks and incentives encourage innovation and investment.
- Large and affluent population: High disposable incomes fuel demand for advanced financial services.
- Strategic location: The UAE's geographic location facilitates access to regional and international markets.
The payments segment is currently the most dominant, followed by lending and investment. Detailed dominance analysis demonstrates a correlation between economic growth, infrastructure development, and the success of specific fintech solutions.
UAE Fintech Market Product Developments
Recent product innovations in the UAE Fintech market showcase a focus on personalization, seamless integration, and enhanced security. New products emphasize intuitive user interfaces, AI-powered features (like personalized financial advice), and robust security protocols. The market is witnessing a surge in innovative solutions like embedded finance, open banking APIs, and blockchain-based applications, aligning with global technological trends and addressing specific market needs.
Report Scope & Segmentation Analysis
This report segments the UAE Fintech market based on several criteria:
- By product: Payments, lending, investments, insurance, wealth management. Each segment displays varying growth trajectories and competitive dynamics, with payments showing the strongest growth.
- By technology: Blockchain, AI, cloud computing, mobile payments. Technological advancements are reshaping the market and driving innovation.
- By user: Individuals, businesses (SMEs and enterprises). Different user needs influence the design and development of specific fintech solutions.
Market sizes and growth projections are provided for each segment, offering a granular understanding of the market's composition and future outlook. Competitive landscapes are analyzed within each segment to identify key players and their strategies.
Key Drivers of UAE Fintech Market Growth
The UAE Fintech market's robust growth is propelled by a convergence of factors:
- Government support: Initiatives aimed at digital transformation create a favorable environment for fintech.
- Technological advancements: Innovations in AI, blockchain, and big data enhance efficiency and security.
- Rising smartphone and internet penetration: Increased digital literacy fuels the adoption of fintech solutions.
- Favorable regulatory environment: A relatively open and supportive regulatory framework attracts investment.
- High disposable incomes: Growing affluence in the UAE drives demand for advanced financial services.
Challenges in the UAE Fintech Market Sector
Despite the significant growth, the UAE Fintech market faces challenges:
- Regulatory uncertainties: The evolving regulatory landscape requires constant adaptation.
- Cybersecurity threats: Protecting sensitive financial data is paramount in a digital environment.
- Competition: A highly competitive environment necessitates constant innovation and efficiency.
- Data privacy concerns: Maintaining customer trust requires stringent data protection measures.
- Financial literacy: Educating the population about fintech solutions remains crucial for wider adoption.
Emerging Opportunities in UAE Fintech Market
The UAE Fintech market presents several lucrative opportunities:
- Expansion into underserved segments: Reaching out to underbanked populations offers substantial growth potential.
- Adoption of new technologies: Leveraging AI, blockchain, and other innovations can create competitive advantages.
- Development of innovative financial products: Creating solutions to meet specific market needs.
- Cross-border payments: Facilitating seamless international transactions presents a significant opportunity.
- Growth of Islamic finance: Catering to the demands of the Islamic finance sector can open new avenues.
Leading Players in the UAE Fintech Market Market
- Tabby
- Yalla Compare
- Sehteq
- Beehive FinTech
- Souqalmal
- Sarwa
- Mamo Pay
- Channel VAS
- Zinna
- Now Money
Key Developments in UAE Fintech Market Industry
- August 2023: Tabby launched Tabby Shop, a comprehensive shopping app integrating over 500,000 products from 10,000+ brands, significantly enhancing its user experience and market reach.
- January 2023: Tabby secured USD 58 Million in Series C funding, raising its valuation to USD 660 Million, solidifying its position as a leading fintech startup in the MENA region.
Strategic Outlook for UAE Fintech Market Market
The UAE Fintech market is poised for continued strong growth, driven by ongoing technological innovation, supportive government policies, and increasing consumer demand for digital financial services. The expanding adoption of mobile payments, the growth of digital lending platforms, and the increasing popularity of investment apps will continue to drive market expansion. The future success will hinge on players’ ability to adapt to evolving regulatory frameworks, address cybersecurity concerns, and deliver innovative, customer-centric solutions.
UAE Fintech Market Segmentation
-
1. Service proposition
- 1.1. Money Transfer and Payments
- 1.2. Savings and Investments
- 1.3. Digital Lending & Lending Marketplaces
- 1.4. Online Insurance & Insurance Marketplaces
UAE Fintech Market Segmentation By Geography
-
1. North America
- 1.1. United States
- 1.2. Canada
- 1.3. Mexico
-
2. South America
- 2.1. Brazil
- 2.2. Argentina
- 2.3. Rest of South America
-
3. Europe
- 3.1. United Kingdom
- 3.2. Germany
- 3.3. France
- 3.4. Italy
- 3.5. Spain
- 3.6. Russia
- 3.7. Benelux
- 3.8. Nordics
- 3.9. Rest of Europe
-
4. Middle East & Africa
- 4.1. Turkey
- 4.2. Israel
- 4.3. GCC
- 4.4. North Africa
- 4.5. South Africa
- 4.6. Rest of Middle East & Africa
-
5. Asia Pacific
- 5.1. China
- 5.2. India
- 5.3. Japan
- 5.4. South Korea
- 5.5. ASEAN
- 5.6. Oceania
- 5.7. Rest of Asia Pacific
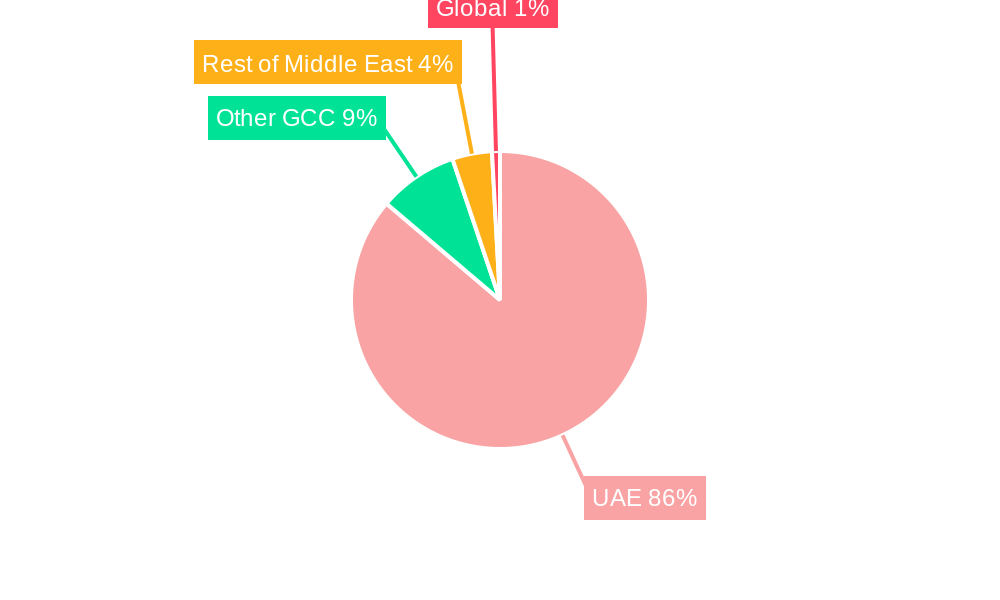
UAE Fintech Market Regional Market Share
Geographic Coverage of UAE Fintech Market
UAE Fintech Market REPORT HIGHLIGHTS
| Aspects | Details |
|---|---|
| Study Period | 2020-2034 |
| Base Year | 2025 |
| Estimated Year | 2026 |
| Forecast Period | 2026-2034 |
| Historical Period | 2020-2025 |
| Growth Rate | CAGR of 12.56% from 2020-2034 |
| Segmentation |
|
Table of Contents
- 1. Introduction
- 1.1. Research Scope
- 1.2. Market Segmentation
- 1.3. Research Objective
- 1.4. Definitions and Assumptions
- 2. Executive Summary
- 2.1. Market Snapshot
- 3. Market Dynamics
- 3.1. Market Drivers
- 3.2. Market Restrains
- 3.3. Market Trends
- 3.4. Market Opportunities
- 4. Market Factor Analysis
- 4.1. Porters Five Forces
- 4.1.1. Bargaining Power of Suppliers
- 4.1.2. Bargaining Power of Buyers
- 4.1.3. Threat of New Entrants
- 4.1.4. Threat of Substitutes
- 4.1.5. Competitive Rivalry
- 4.2. PESTEL analysis
- 4.3. BCG Analysis
- 4.3.1. Stars (High Growth, High Market Share)
- 4.3.2. Cash Cows (Low Growth, High Market Share)
- 4.3.3. Question Mark (High Growth, Low Market Share)
- 4.3.4. Dogs (Low Growth, Low Market Share)
- 4.4. Ansoff Matrix Analysis
- 4.5. Supply Chain Analysis
- 4.6. Regulatory Landscape
- 4.7. Current Market Potential and Opportunity Assessment (TAM–SAM–SOM Framework)
- 4.8. RAX Analyst Note
- 4.1. Porters Five Forces
- 5. Market Analysis, Insights and Forecast 2021-2033
- 5.1. Market Analysis, Insights and Forecast - by Service proposition
- 5.1.1. Money Transfer and Payments
- 5.1.2. Savings and Investments
- 5.1.3. Digital Lending & Lending Marketplaces
- 5.1.4. Online Insurance & Insurance Marketplaces
- 5.2. Market Analysis, Insights and Forecast - by Region
- 5.2.1. North America
- 5.2.2. South America
- 5.2.3. Europe
- 5.2.4. Middle East & Africa
- 5.2.5. Asia Pacific
- 5.1. Market Analysis, Insights and Forecast - by Service proposition
- 6. Global UAE Fintech Market Analysis, Insights and Forecast, 2021-2033
- 6.1. Market Analysis, Insights and Forecast - by Service proposition
- 6.1.1. Money Transfer and Payments
- 6.1.2. Savings and Investments
- 6.1.3. Digital Lending & Lending Marketplaces
- 6.1.4. Online Insurance & Insurance Marketplaces
- 6.1. Market Analysis, Insights and Forecast - by Service proposition
- 7. North America UAE Fintech Market Analysis, Insights and Forecast, 2020-2032
- 7.1. Market Analysis, Insights and Forecast - by Service proposition
- 7.1.1. Money Transfer and Payments
- 7.1.2. Savings and Investments
- 7.1.3. Digital Lending & Lending Marketplaces
- 7.1.4. Online Insurance & Insurance Marketplaces
- 7.1. Market Analysis, Insights and Forecast - by Service proposition
- 8. South America UAE Fintech Market Analysis, Insights and Forecast, 2020-2032
- 8.1. Market Analysis, Insights and Forecast - by Service proposition
- 8.1.1. Money Transfer and Payments
- 8.1.2. Savings and Investments
- 8.1.3. Digital Lending & Lending Marketplaces
- 8.1.4. Online Insurance & Insurance Marketplaces
- 8.1. Market Analysis, Insights and Forecast - by Service proposition
- 9. Europe UAE Fintech Market Analysis, Insights and Forecast, 2020-2032
- 9.1. Market Analysis, Insights and Forecast - by Service proposition
- 9.1.1. Money Transfer and Payments
- 9.1.2. Savings and Investments
- 9.1.3. Digital Lending & Lending Marketplaces
- 9.1.4. Online Insurance & Insurance Marketplaces
- 9.1. Market Analysis, Insights and Forecast - by Service proposition
- 10. Middle East & Africa UAE Fintech Market Analysis, Insights and Forecast, 2020-2032
- 10.1. Market Analysis, Insights and Forecast - by Service proposition
- 10.1.1. Money Transfer and Payments
- 10.1.2. Savings and Investments
- 10.1.3. Digital Lending & Lending Marketplaces
- 10.1.4. Online Insurance & Insurance Marketplaces
- 10.1. Market Analysis, Insights and Forecast - by Service proposition
- 11. Asia Pacific UAE Fintech Market Analysis, Insights and Forecast, 2020-2032
- 11.1. Market Analysis, Insights and Forecast - by Service proposition
- 11.1.1. Money Transfer and Payments
- 11.1.2. Savings and Investments
- 11.1.3. Digital Lending & Lending Marketplaces
- 11.1.4. Online Insurance & Insurance Marketplaces
- 11.1. Market Analysis, Insights and Forecast - by Service proposition
- 12. Competitive Analysis
- 12.1. Company Profiles
- 12.1.1 Tabby
- 12.1.1.1. Company Overview
- 12.1.1.2. Products
- 12.1.1.3. Company Financials
- 12.1.1.4. SWOT Analysis
- 12.1.2 Yalla Compare
- 12.1.2.1. Company Overview
- 12.1.2.2. Products
- 12.1.2.3. Company Financials
- 12.1.2.4. SWOT Analysis
- 12.1.3 Sehteq
- 12.1.3.1. Company Overview
- 12.1.3.2. Products
- 12.1.3.3. Company Financials
- 12.1.3.4. SWOT Analysis
- 12.1.4 Beehive FinTech
- 12.1.4.1. Company Overview
- 12.1.4.2. Products
- 12.1.4.3. Company Financials
- 12.1.4.4. SWOT Analysis
- 12.1.5 Souqalmal
- 12.1.5.1. Company Overview
- 12.1.5.2. Products
- 12.1.5.3. Company Financials
- 12.1.5.4. SWOT Analysis
- 12.1.6 Sarwa
- 12.1.6.1. Company Overview
- 12.1.6.2. Products
- 12.1.6.3. Company Financials
- 12.1.6.4. SWOT Analysis
- 12.1.7 Mamo Pay
- 12.1.7.1. Company Overview
- 12.1.7.2. Products
- 12.1.7.3. Company Financials
- 12.1.7.4. SWOT Analysis
- 12.1.8 Channel VAS
- 12.1.8.1. Company Overview
- 12.1.8.2. Products
- 12.1.8.3. Company Financials
- 12.1.8.4. SWOT Analysis
- 12.1.9 Zinna
- 12.1.9.1. Company Overview
- 12.1.9.2. Products
- 12.1.9.3. Company Financials
- 12.1.9.4. SWOT Analysis
- 12.1.10 Now Money**List Not Exhaustive
- 12.1.10.1. Company Overview
- 12.1.10.2. Products
- 12.1.10.3. Company Financials
- 12.1.10.4. SWOT Analysis
- 12.1.1 Tabby
- 12.2. Market Entropy
- 12.2.1 Company's Key Areas Served
- 12.2.2 Recent Developments
- 12.3. Company Market Share Analysis 2025
- 12.3.1 Top 5 Companies Market Share Analysis
- 12.3.2 Top 3 Companies Market Share Analysis
- 12.4. List of Potential Customers
- 13. Research Methodology
List of Figures
- Figure 1: Global UAE Fintech Market Revenue Breakdown (Million, %) by Region 2025 & 2033
- Figure 2: Global UAE Fintech Market Volume Breakdown (Billion, %) by Region 2025 & 2033
- Figure 3: North America UAE Fintech Market Revenue (Million), by Service proposition 2025 & 2033
- Figure 4: North America UAE Fintech Market Volume (Billion), by Service proposition 2025 & 2033
- Figure 5: North America UAE Fintech Market Revenue Share (%), by Service proposition 2025 & 2033
- Figure 6: North America UAE Fintech Market Volume Share (%), by Service proposition 2025 & 2033
- Figure 7: North America UAE Fintech Market Revenue (Million), by Country 2025 & 2033
- Figure 8: North America UAE Fintech Market Volume (Billion), by Country 2025 & 2033
- Figure 9: North America UAE Fintech Market Revenue Share (%), by Country 2025 & 2033
- Figure 10: North America UAE Fintech Market Volume Share (%), by Country 2025 & 2033
- Figure 11: South America UAE Fintech Market Revenue (Million), by Service proposition 2025 & 2033
- Figure 12: South America UAE Fintech Market Volume (Billion), by Service proposition 2025 & 2033
- Figure 13: South America UAE Fintech Market Revenue Share (%), by Service proposition 2025 & 2033
- Figure 14: South America UAE Fintech Market Volume Share (%), by Service proposition 2025 & 2033
- Figure 15: South America UAE Fintech Market Revenue (Million), by Country 2025 & 2033
- Figure 16: South America UAE Fintech Market Volume (Billion), by Country 2025 & 2033
- Figure 17: South America UAE Fintech Market Revenue Share (%), by Country 2025 & 2033
- Figure 18: South America UAE Fintech Market Volume Share (%), by Country 2025 & 2033
- Figure 19: Europe UAE Fintech Market Revenue (Million), by Service proposition 2025 & 2033
- Figure 20: Europe UAE Fintech Market Volume (Billion), by Service proposition 2025 & 2033
- Figure 21: Europe UAE Fintech Market Revenue Share (%), by Service proposition 2025 & 2033
- Figure 22: Europe UAE Fintech Market Volume Share (%), by Service proposition 2025 & 2033
- Figure 23: Europe UAE Fintech Market Revenue (Million), by Country 2025 & 2033
- Figure 24: Europe UAE Fintech Market Volume (Billion), by Country 2025 & 2033
- Figure 25: Europe UAE Fintech Market Revenue Share (%), by Country 2025 & 2033
- Figure 26: Europe UAE Fintech Market Volume Share (%), by Country 2025 & 2033
- Figure 27: Middle East & Africa UAE Fintech Market Revenue (Million), by Service proposition 2025 & 2033
- Figure 28: Middle East & Africa UAE Fintech Market Volume (Billion), by Service proposition 2025 & 2033
- Figure 29: Middle East & Africa UAE Fintech Market Revenue Share (%), by Service proposition 2025 & 2033
- Figure 30: Middle East & Africa UAE Fintech Market Volume Share (%), by Service proposition 2025 & 2033
- Figure 31: Middle East & Africa UAE Fintech Market Revenue (Million), by Country 2025 & 2033
- Figure 32: Middle East & Africa UAE Fintech Market Volume (Billion), by Country 2025 & 2033
- Figure 33: Middle East & Africa UAE Fintech Market Revenue Share (%), by Country 2025 & 2033
- Figure 34: Middle East & Africa UAE Fintech Market Volume Share (%), by Country 2025 & 2033
- Figure 35: Asia Pacific UAE Fintech Market Revenue (Million), by Service proposition 2025 & 2033
- Figure 36: Asia Pacific UAE Fintech Market Volume (Billion), by Service proposition 2025 & 2033
- Figure 37: Asia Pacific UAE Fintech Market Revenue Share (%), by Service proposition 2025 & 2033
- Figure 38: Asia Pacific UAE Fintech Market Volume Share (%), by Service proposition 2025 & 2033
- Figure 39: Asia Pacific UAE Fintech Market Revenue (Million), by Country 2025 & 2033
- Figure 40: Asia Pacific UAE Fintech Market Volume (Billion), by Country 2025 & 2033
- Figure 41: Asia Pacific UAE Fintech Market Revenue Share (%), by Country 2025 & 2033
- Figure 42: Asia Pacific UAE Fintech Market Volume Share (%), by Country 2025 & 2033
List of Tables
- Table 1: Global UAE Fintech Market Revenue Million Forecast, by Service proposition 2020 & 2033
- Table 2: Global UAE Fintech Market Volume Billion Forecast, by Service proposition 2020 & 2033
- Table 3: Global UAE Fintech Market Revenue Million Forecast, by Region 2020 & 2033
- Table 4: Global UAE Fintech Market Volume Billion Forecast, by Region 2020 & 2033
- Table 5: Global UAE Fintech Market Revenue Million Forecast, by Service proposition 2020 & 2033
- Table 6: Global UAE Fintech Market Volume Billion Forecast, by Service proposition 2020 & 2033
- Table 7: Global UAE Fintech Market Revenue Million Forecast, by Country 2020 & 2033
- Table 8: Global UAE Fintech Market Volume Billion Forecast, by Country 2020 & 2033
- Table 9: United States UAE Fintech Market Revenue (Million) Forecast, by Application 2020 & 2033
- Table 10: United States UAE Fintech Market Volume (Billion) Forecast, by Application 2020 & 2033
- Table 11: Canada UAE Fintech Market Revenue (Million) Forecast, by Application 2020 & 2033
- Table 12: Canada UAE Fintech Market Volume (Billion) Forecast, by Application 2020 & 2033
- Table 13: Mexico UAE Fintech Market Revenue (Million) Forecast, by Application 2020 & 2033
- Table 14: Mexico UAE Fintech Market Volume (Billion) Forecast, by Application 2020 & 2033
- Table 15: Global UAE Fintech Market Revenue Million Forecast, by Service proposition 2020 & 2033
- Table 16: Global UAE Fintech Market Volume Billion Forecast, by Service proposition 2020 & 2033
- Table 17: Global UAE Fintech Market Revenue Million Forecast, by Country 2020 & 2033
- Table 18: Global UAE Fintech Market Volume Billion Forecast, by Country 2020 & 2033
- Table 19: Brazil UAE Fintech Market Revenue (Million) Forecast, by Application 2020 & 2033
- Table 20: Brazil UAE Fintech Market Volume (Billion) Forecast, by Application 2020 & 2033
- Table 21: Argentina UAE Fintech Market Revenue (Million) Forecast, by Application 2020 & 2033
- Table 22: Argentina UAE Fintech Market Volume (Billion) Forecast, by Application 2020 & 2033
- Table 23: Rest of South America UAE Fintech Market Revenue (Million) Forecast, by Application 2020 & 2033
- Table 24: Rest of South America UAE Fintech Market Volume (Billion) Forecast, by Application 2020 & 2033
- Table 25: Global UAE Fintech Market Revenue Million Forecast, by Service proposition 2020 & 2033
- Table 26: Global UAE Fintech Market Volume Billion Forecast, by Service proposition 2020 & 2033
- Table 27: Global UAE Fintech Market Revenue Million Forecast, by Country 2020 & 2033
- Table 28: Global UAE Fintech Market Volume Billion Forecast, by Country 2020 & 2033
- Table 29: United Kingdom UAE Fintech Market Revenue (Million) Forecast, by Application 2020 & 2033
- Table 30: United Kingdom UAE Fintech Market Volume (Billion) Forecast, by Application 2020 & 2033
- Table 31: Germany UAE Fintech Market Revenue (Million) Forecast, by Application 2020 & 2033
- Table 32: Germany UAE Fintech Market Volume (Billion) Forecast, by Application 2020 & 2033
- Table 33: France UAE Fintech Market Revenue (Million) Forecast, by Application 2020 & 2033
- Table 34: France UAE Fintech Market Volume (Billion) Forecast, by Application 2020 & 2033
- Table 35: Italy UAE Fintech Market Revenue (Million) Forecast, by Application 2020 & 2033
- Table 36: Italy UAE Fintech Market Volume (Billion) Forecast, by Application 2020 & 2033
- Table 37: Spain UAE Fintech Market Revenue (Million) Forecast, by Application 2020 & 2033
- Table 38: Spain UAE Fintech Market Volume (Billion) Forecast, by Application 2020 & 2033
- Table 39: Russia UAE Fintech Market Revenue (Million) Forecast, by Application 2020 & 2033
- Table 40: Russia UAE Fintech Market Volume (Billion) Forecast, by Application 2020 & 2033
- Table 41: Benelux UAE Fintech Market Revenue (Million) Forecast, by Application 2020 & 2033
- Table 42: Benelux UAE Fintech Market Volume (Billion) Forecast, by Application 2020 & 2033
- Table 43: Nordics UAE Fintech Market Revenue (Million) Forecast, by Application 2020 & 2033
- Table 44: Nordics UAE Fintech Market Volume (Billion) Forecast, by Application 2020 & 2033
- Table 45: Rest of Europe UAE Fintech Market Revenue (Million) Forecast, by Application 2020 & 2033
- Table 46: Rest of Europe UAE Fintech Market Volume (Billion) Forecast, by Application 2020 & 2033
- Table 47: Global UAE Fintech Market Revenue Million Forecast, by Service proposition 2020 & 2033
- Table 48: Global UAE Fintech Market Volume Billion Forecast, by Service proposition 2020 & 2033
- Table 49: Global UAE Fintech Market Revenue Million Forecast, by Country 2020 & 2033
- Table 50: Global UAE Fintech Market Volume Billion Forecast, by Country 2020 & 2033
- Table 51: Turkey UAE Fintech Market Revenue (Million) Forecast, by Application 2020 & 2033
- Table 52: Turkey UAE Fintech Market Volume (Billion) Forecast, by Application 2020 & 2033
- Table 53: Israel UAE Fintech Market Revenue (Million) Forecast, by Application 2020 & 2033
- Table 54: Israel UAE Fintech Market Volume (Billion) Forecast, by Application 2020 & 2033
- Table 55: GCC UAE Fintech Market Revenue (Million) Forecast, by Application 2020 & 2033
- Table 56: GCC UAE Fintech Market Volume (Billion) Forecast, by Application 2020 & 2033
- Table 57: North Africa UAE Fintech Market Revenue (Million) Forecast, by Application 2020 & 2033
- Table 58: North Africa UAE Fintech Market Volume (Billion) Forecast, by Application 2020 & 2033
- Table 59: South Africa UAE Fintech Market Revenue (Million) Forecast, by Application 2020 & 2033
- Table 60: South Africa UAE Fintech Market Volume (Billion) Forecast, by Application 2020 & 2033
- Table 61: Rest of Middle East & Africa UAE Fintech Market Revenue (Million) Forecast, by Application 2020 & 2033
- Table 62: Rest of Middle East & Africa UAE Fintech Market Volume (Billion) Forecast, by Application 2020 & 2033
- Table 63: Global UAE Fintech Market Revenue Million Forecast, by Service proposition 2020 & 2033
- Table 64: Global UAE Fintech Market Volume Billion Forecast, by Service proposition 2020 & 2033
- Table 65: Global UAE Fintech Market Revenue Million Forecast, by Country 2020 & 2033
- Table 66: Global UAE Fintech Market Volume Billion Forecast, by Country 2020 & 2033
- Table 67: China UAE Fintech Market Revenue (Million) Forecast, by Application 2020 & 2033
- Table 68: China UAE Fintech Market Volume (Billion) Forecast, by Application 2020 & 2033
- Table 69: India UAE Fintech Market Revenue (Million) Forecast, by Application 2020 & 2033
- Table 70: India UAE Fintech Market Volume (Billion) Forecast, by Application 2020 & 2033
- Table 71: Japan UAE Fintech Market Revenue (Million) Forecast, by Application 2020 & 2033
- Table 72: Japan UAE Fintech Market Volume (Billion) Forecast, by Application 2020 & 2033
- Table 73: South Korea UAE Fintech Market Revenue (Million) Forecast, by Application 2020 & 2033
- Table 74: South Korea UAE Fintech Market Volume (Billion) Forecast, by Application 2020 & 2033
- Table 75: ASEAN UAE Fintech Market Revenue (Million) Forecast, by Application 2020 & 2033
- Table 76: ASEAN UAE Fintech Market Volume (Billion) Forecast, by Application 2020 & 2033
- Table 77: Oceania UAE Fintech Market Revenue (Million) Forecast, by Application 2020 & 2033
- Table 78: Oceania UAE Fintech Market Volume (Billion) Forecast, by Application 2020 & 2033
- Table 79: Rest of Asia Pacific UAE Fintech Market Revenue (Million) Forecast, by Application 2020 & 2033
- Table 80: Rest of Asia Pacific UAE Fintech Market Volume (Billion) Forecast, by Application 2020 & 2033
Frequently Asked Questions
1. What is the projected Compound Annual Growth Rate (CAGR) of the UAE Fintech Market?
The projected CAGR is approximately 12.56%.
2. Which companies are prominent players in the UAE Fintech Market?
Key companies in the market include Tabby, Yalla Compare, Sehteq, Beehive FinTech, Souqalmal, Sarwa, Mamo Pay, Channel VAS, Zinna, Now Money**List Not Exhaustive.
3. What are the main segments of the UAE Fintech Market?
The market segments include Service proposition.
4. Can you provide details about the market size?
The market size is estimated to be USD 3.16 Million as of 2022.
5. What are some drivers contributing to market growth?
Rise in the Number of Fintech Startups is Driving the Market; Favorable Regulatory Compliance Landscape is Promoting the Fintech Market.
6. What are the notable trends driving market growth?
The Market is Being Driven by the Development of New Technologies.
7. Are there any restraints impacting market growth?
Rise in the Number of Fintech Startups is Driving the Market; Favorable Regulatory Compliance Landscape is Promoting the Fintech Market.
8. Can you provide examples of recent developments in the market?
August 2023: MENA’s number one shopping and fintech app, Tabby, launched its latest all-in-one shopping tool, Tabby Shop. This is the biggest update to Tabby’s app since its inception. Tabi Shop is a comprehensive shopping app that brings together more than 500,000+ products from over 10,000+ brands in the Fashion, Beauty, Home, and Electronics categories. Tabby Shop offers several shopping tools, such as smarter search, better wishlists, deal notifications, and more.
9. What pricing options are available for accessing the report?
Pricing options include single-user, multi-user, and enterprise licenses priced at USD 3800, USD 4500, and USD 5800 respectively.
10. Is the market size provided in terms of value or volume?
The market size is provided in terms of value, measured in Million and volume, measured in Billion.
11. Are there any specific market keywords associated with the report?
Yes, the market keyword associated with the report is "UAE Fintech Market," which aids in identifying and referencing the specific market segment covered.
12. How do I determine which pricing option suits my needs best?
The pricing options vary based on user requirements and access needs. Individual users may opt for single-user licenses, while businesses requiring broader access may choose multi-user or enterprise licenses for cost-effective access to the report.
13. Are there any additional resources or data provided in the UAE Fintech Market report?
While the report offers comprehensive insights, it's advisable to review the specific contents or supplementary materials provided to ascertain if additional resources or data are available.
14. How can I stay updated on further developments or reports in the UAE Fintech Market?
To stay informed about further developments, trends, and reports in the UAE Fintech Market, consider subscribing to industry newsletters, following relevant companies and organizations, or regularly checking reputable industry news sources and publications.
Methodology
Step 1 - Identification of Relevant Samples Size from Population Database


Step 2 - Approaches for Defining Global Market Size (Value, Volume* & Price*)

Note*: In applicable scenarios
Step 3 - Data Sources
Primary Research
- Web Analytics
- Survey Reports
- Research Institute
- Latest Research Reports
- Opinion Leaders
Secondary Research
- Annual Reports
- White Paper
- Latest Press Release
- Industry Association
- Paid Database
- Investor Presentations

Step 4 - Data Triangulation
Involves using different sources of information in order to increase the validity of a study
These sources are likely to be stakeholders in a program - participants, other researchers, program staff, other community members, and so on.
Then we put all data in single framework & apply various statistical tools to find out the dynamic on the market.
During the analysis stage, feedback from the stakeholder groups would be compared to determine areas of agreement as well as areas of divergence