

Key Insights
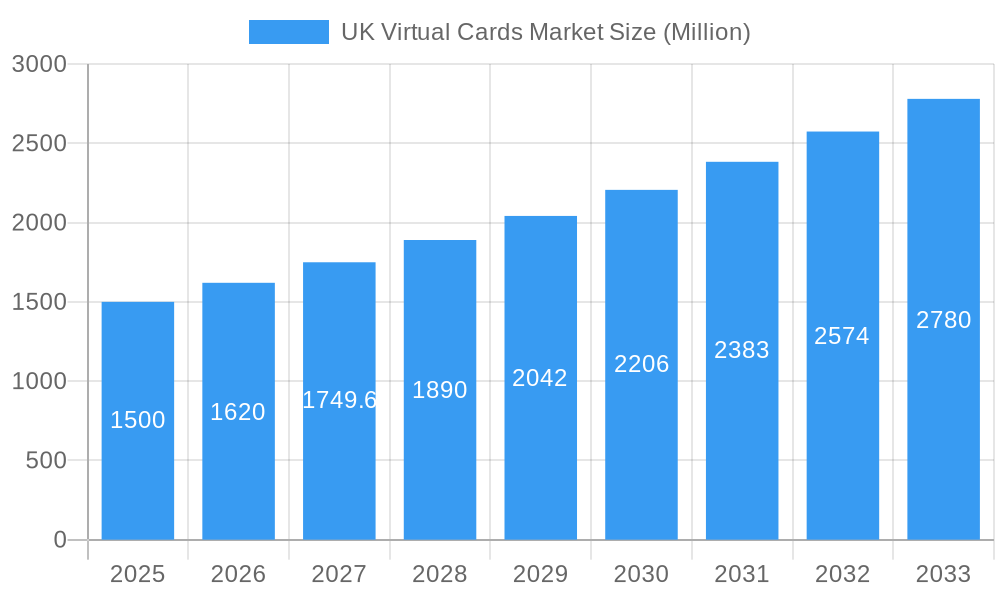
The UK virtual card market is experiencing robust growth, fueled by increasing digital adoption, the rise of e-commerce, and the demand for enhanced security and convenience in online transactions. The market's Compound Annual Growth Rate (CAGR) of 8% from 2019 to 2024 suggests a significant upward trajectory, indicating substantial market expansion and penetration. This growth is driven by several factors, including the increasing popularity of mobile payment solutions, the proliferation of subscription services requiring recurring payments, and the growing need for businesses to manage employee expenses efficiently through virtual card solutions. Furthermore, the increasing regulatory scrutiny on financial security and data privacy is inadvertently boosting the adoption of virtual cards as a secure alternative to traditional physical cards. Key players like Revolut, Monese, Monzo, Starling Bank, and others are aggressively competing for market share, introducing innovative features and services to attract customers. The segmentation within the market likely includes consumer, business-to-business (B2B), and business-to-consumer (B2C) segments, each exhibiting unique growth drivers. Competition is intense, requiring continuous innovation and strategic partnerships to maintain a competitive edge.
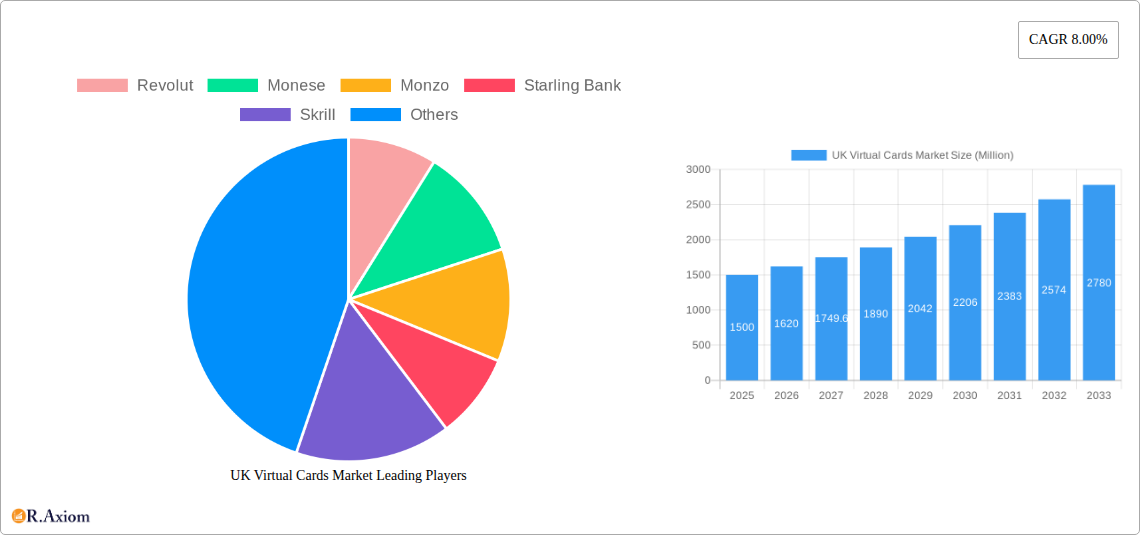
UK Virtual Cards Market Market Size (In Billion)
Looking forward to 2033, the UK virtual card market is poised for continued expansion. While specific regional data is absent, we can reasonably assume that London and other major urban centers will contribute most significantly to market growth, given higher levels of digital literacy and business activity. However, increasing penetration in rural areas is also anticipated as digital infrastructure continues to improve. Restraints on growth may include concerns about data security, the need for improved consumer education on virtual card usage, and the potential regulatory challenges in managing cross-border transactions. Nevertheless, the overall forecast remains optimistic, projecting consistent growth and sustained market value increases over the next decade. The market's success will depend on the continued adoption of digital payment technologies, ongoing innovation by existing players, and the entry of new market participants.
UK Virtual Cards Market Company Market Share
UK Virtual Cards Market: A Comprehensive Report (2019-2033)
This comprehensive report provides an in-depth analysis of the UK virtual cards market, encompassing historical data (2019-2024), current estimations (2025), and future projections (2025-2033). It offers actionable insights for industry stakeholders, investors, and businesses operating within this dynamic sector. The report leverages extensive market research to offer a 360° view, covering market size, segmentation, competitive landscape, technological advancements, and key growth drivers. The study period covers 2019-2033, with 2025 serving as the base and estimated year.
UK Virtual Cards Market Market Concentration & Innovation
The UK virtual cards market exhibits a moderately concentrated landscape, with several key players vying for market share. While precise market share figures for each company are proprietary, Revolut, Monese, Monzo, Starling Bank, Skrill, iCard, US Unlocked, Klarna, Pervesk, and Payoneer are prominent players. The market is characterized by intense competition, driven by continuous product innovation and strategic acquisitions.
- Market Concentration: The top five players likely hold approximately xx% of the market share in 2025, indicating a moderately concentrated but still competitive environment.
- Innovation Drivers: The demand for secure, flexible, and cost-effective payment solutions fuels innovation. Features such as enhanced security protocols, integration with existing financial systems, and personalized user experiences are key drivers.
- Regulatory Frameworks: The UK's regulatory environment, including PSD2 and FCA guidelines, significantly impacts the market. Compliance and security standards are paramount.
- Product Substitutes: Traditional physical cards and other digital payment methods pose competitive pressure. However, virtual cards offer distinct advantages in terms of convenience, security, and control.
- End-User Trends: The increasing adoption of mobile banking and online shopping, coupled with a preference for contactless payments, fuels the growth of the virtual cards market. SMEs are a particularly important segment.
- M&A Activities: The acquisition of Nobly POS by Revolut in November 2021 demonstrates the strategic importance of mergers and acquisitions in expanding market reach and capabilities. The deal value was undisclosed but likely in the range of xx Million.
UK Virtual Cards Market Industry Trends & Insights
The UK virtual cards market is experiencing robust growth, driven by several key factors. The market is projected to achieve a CAGR of xx% during the forecast period (2025-2033). Increased smartphone penetration and digital adoption contribute significantly. The growing preference for contactless and online transactions, particularly among younger demographics, is a major catalyst. Technological disruptions, such as the rise of embedded finance and open banking, are further accelerating market expansion. Market penetration is projected to reach xx% by 2033, indicating significant untapped potential. Competitive dynamics are intense, with established players and new entrants continuously vying for market share through product innovation and strategic partnerships. Consumer preferences are shifting towards more personalized and secure payment solutions.
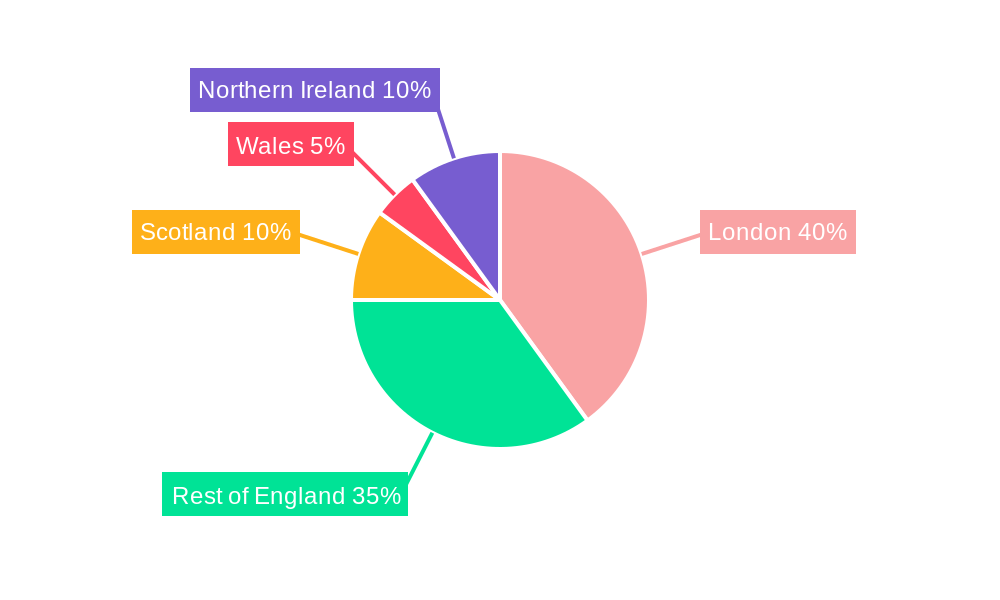
Dominant Markets & Segments in UK Virtual Cards Market
The UK virtual cards market is dominated by the urban areas, driven by higher internet and smartphone penetration, and a preference for digital payments. London and other major cities exhibit the highest adoption rates.
- Key Drivers:
- High Smartphone Penetration: High smartphone usage facilitates easy access to virtual card services.
- Developed Digital Infrastructure: Robust digital infrastructure ensures seamless transaction processing.
- Favourable Regulatory Environment: Supportive government policies and regulations are vital for market growth.
- High Online Shopping Rates: The prevalence of e-commerce directly translates to higher demand for virtual cards.
The dominance analysis reveals that larger cities contribute significantly to the market value, with smaller cities and rural areas exhibiting lower adoption rates. However, increasing internet access and smartphone ownership in these areas are expected to drive future growth.
UK Virtual Cards Market Product Developments
Recent product developments focus on enhancing security features, integrating with existing financial ecosystems, and improving user experience. Virtual cards are now frequently bundled with budgeting tools, expense tracking capabilities, and fraud protection mechanisms. The integration of AI-powered features for personalized spending recommendations and risk management adds another layer of sophistication. This focus on creating more comprehensive and user-friendly payment solutions caters to the evolving preferences of consumers and businesses.
Report Scope & Segmentation Analysis
This report segments the UK virtual cards market based on several key parameters:
- By Card Type: This includes prepaid virtual cards, business virtual cards, and other specialized offerings. The prepaid virtual card segment is projected to dominate due to its widespread appeal. Growth is estimated at xx Million by 2033.
- By End-User: This includes individuals, businesses (SMEs and large enterprises). The business segment is expected to exhibit strong growth. Value projections for each segment are available.
- By Application: This includes e-commerce, in-app purchases, subscription services, and travel. Each application segment holds distinct growth potential.
- By Payment Network: This considers various payment networks used by virtual cards. The market is segmented further by regions and specific demographics.
Key Drivers of UK Virtual Cards Market Growth
The UK virtual cards market is propelled by several key growth drivers:
- Technological Advancements: Innovations in mobile technology, digital payment systems, and improved security protocols facilitate market expansion.
- Increased Smartphone Penetration: The widespread adoption of smartphones enables seamless access to virtual card services.
- Rising E-commerce: The booming online shopping sector fuels demand for convenient and secure payment solutions.
- Government Initiatives: Supportive regulations and policies encourage the adoption of digital payment methods.
- Growing Preference for Contactless Payments: This trend enhances the appeal of virtual cards as a convenient payment method.
Challenges in the UK Virtual Cards Market Sector
Despite its growth potential, the UK virtual cards market faces several challenges:
- Security Concerns: Cybersecurity threats and data breaches are significant concerns that need to be addressed through robust security measures.
- Regulatory Compliance: Navigating complex regulations and ensuring compliance is crucial for market participants.
- Competition: Intense competition from established players and new entrants creates pressure on pricing and profitability.
- Integration Challenges: Seamless integration with existing financial systems and other applications can pose technical hurdles.
Emerging Opportunities in UK Virtual Cards Market
The UK virtual cards market presents several emerging opportunities:
- Expansion into Niche Markets: Targeting specific consumer segments and industries offers potential for growth.
- Integration with Open Banking: Leveraging open banking APIs can lead to enhanced functionalities and improved customer experience.
- Development of Innovative Features: Adding features like personalized spending limits, advanced fraud detection, and AI-powered insights is key to competitive advantage.
- International Expansion: The UK's virtual card market has the potential to expand to other European markets.
Key Developments in UK Virtual Cards Market Industry
- November 2021: Revolut acquired Nobly POS, expanding its offerings to the hospitality sector.
- April 2021: Monzo introduced new features for connected accounts and virtual cards, improving user experience and control.
Strategic Outlook for UK Virtual Cards Market Market
The UK virtual cards market is poised for sustained growth, driven by ongoing technological advancements, increasing digital adoption, and evolving consumer preferences. The market's future potential lies in expanding into new segments, fostering strategic partnerships, and developing innovative features that enhance security, convenience, and user experience. The market's evolution will continue to be shaped by regulatory developments and competitive dynamics.
UK Virtual Cards Market Segmentation
-
1. Product Type
- 1.1. B2B Virtual Cards
- 1.2. B2C Remote Payment Virtual Cards
- 1.3. B2C PoS Virtual Cards
-
2. End User
- 2.1. Consumer Use
- 2.2. Business Use
UK Virtual Cards Market Segmentation By Geography
-
1. North America
- 1.1. United States
- 1.2. Canada
- 1.3. Mexico
-
2. South America
- 2.1. Brazil
- 2.2. Argentina
- 2.3. Rest of South America
-
3. Europe
- 3.1. United Kingdom
- 3.2. Germany
- 3.3. France
- 3.4. Italy
- 3.5. Spain
- 3.6. Russia
- 3.7. Benelux
- 3.8. Nordics
- 3.9. Rest of Europe
-
4. Middle East & Africa
- 4.1. Turkey
- 4.2. Israel
- 4.3. GCC
- 4.4. North Africa
- 4.5. South Africa
- 4.6. Rest of Middle East & Africa
-
5. Asia Pacific
- 5.1. China
- 5.2. India
- 5.3. Japan
- 5.4. South Korea
- 5.5. ASEAN
- 5.6. Oceania
- 5.7. Rest of Asia Pacific
UK Virtual Cards Market Regional Market Share
Geographic Coverage of UK Virtual Cards Market
UK Virtual Cards Market REPORT HIGHLIGHTS
| Aspects | Details |
|---|---|
| Study Period | 2020-2034 |
| Base Year | 2025 |
| Estimated Year | 2026 |
| Forecast Period | 2026-2034 |
| Historical Period | 2020-2025 |
| Growth Rate | CAGR of 18.5% from 2020-2034 |
| Segmentation |
|
Table of Contents
- 1. Introduction
- 1.1. Research Scope
- 1.2. Market Segmentation
- 1.3. Research Objective
- 1.4. Definitions and Assumptions
- 2. Executive Summary
- 2.1. Market Snapshot
- 3. Market Dynamics
- 3.1. Market Drivers
- 3.2. Market Restrains
- 3.3. Market Trends
- 3.4. Market Opportunities
- 4. Market Factor Analysis
- 4.1. Porters Five Forces
- 4.1.1. Bargaining Power of Suppliers
- 4.1.2. Bargaining Power of Buyers
- 4.1.3. Threat of New Entrants
- 4.1.4. Threat of Substitutes
- 4.1.5. Competitive Rivalry
- 4.2. PESTEL analysis
- 4.3. BCG Analysis
- 4.3.1. Stars (High Growth, High Market Share)
- 4.3.2. Cash Cows (Low Growth, High Market Share)
- 4.3.3. Question Mark (High Growth, Low Market Share)
- 4.3.4. Dogs (Low Growth, Low Market Share)
- 4.4. Ansoff Matrix Analysis
- 4.5. Supply Chain Analysis
- 4.6. Regulatory Landscape
- 4.7. Current Market Potential and Opportunity Assessment (TAM–SAM–SOM Framework)
- 4.8. RAX Analyst Note
- 4.1. Porters Five Forces
- 5. Market Analysis, Insights and Forecast 2021-2033
- 5.1. Market Analysis, Insights and Forecast - by Product Type
- 5.1.1. B2B Virtual Cards
- 5.1.2. B2C Remote Payment Virtual Cards
- 5.1.3. B2C PoS Virtual Cards
- 5.2. Market Analysis, Insights and Forecast - by End User
- 5.2.1. Consumer Use
- 5.2.2. Business Use
- 5.3. Market Analysis, Insights and Forecast - by Region
- 5.3.1. North America
- 5.3.2. South America
- 5.3.3. Europe
- 5.3.4. Middle East & Africa
- 5.3.5. Asia Pacific
- 5.1. Market Analysis, Insights and Forecast - by Product Type
- 6. Global UK Virtual Cards Market Analysis, Insights and Forecast, 2021-2033
- 6.1. Market Analysis, Insights and Forecast - by Product Type
- 6.1.1. B2B Virtual Cards
- 6.1.2. B2C Remote Payment Virtual Cards
- 6.1.3. B2C PoS Virtual Cards
- 6.2. Market Analysis, Insights and Forecast - by End User
- 6.2.1. Consumer Use
- 6.2.2. Business Use
- 6.1. Market Analysis, Insights and Forecast - by Product Type
- 7. North America UK Virtual Cards Market Analysis, Insights and Forecast, 2020-2032
- 7.1. Market Analysis, Insights and Forecast - by Product Type
- 7.1.1. B2B Virtual Cards
- 7.1.2. B2C Remote Payment Virtual Cards
- 7.1.3. B2C PoS Virtual Cards
- 7.2. Market Analysis, Insights and Forecast - by End User
- 7.2.1. Consumer Use
- 7.2.2. Business Use
- 7.1. Market Analysis, Insights and Forecast - by Product Type
- 8. South America UK Virtual Cards Market Analysis, Insights and Forecast, 2020-2032
- 8.1. Market Analysis, Insights and Forecast - by Product Type
- 8.1.1. B2B Virtual Cards
- 8.1.2. B2C Remote Payment Virtual Cards
- 8.1.3. B2C PoS Virtual Cards
- 8.2. Market Analysis, Insights and Forecast - by End User
- 8.2.1. Consumer Use
- 8.2.2. Business Use
- 8.1. Market Analysis, Insights and Forecast - by Product Type
- 9. Europe UK Virtual Cards Market Analysis, Insights and Forecast, 2020-2032
- 9.1. Market Analysis, Insights and Forecast - by Product Type
- 9.1.1. B2B Virtual Cards
- 9.1.2. B2C Remote Payment Virtual Cards
- 9.1.3. B2C PoS Virtual Cards
- 9.2. Market Analysis, Insights and Forecast - by End User
- 9.2.1. Consumer Use
- 9.2.2. Business Use
- 9.1. Market Analysis, Insights and Forecast - by Product Type
- 10. Middle East & Africa UK Virtual Cards Market Analysis, Insights and Forecast, 2020-2032
- 10.1. Market Analysis, Insights and Forecast - by Product Type
- 10.1.1. B2B Virtual Cards
- 10.1.2. B2C Remote Payment Virtual Cards
- 10.1.3. B2C PoS Virtual Cards
- 10.2. Market Analysis, Insights and Forecast - by End User
- 10.2.1. Consumer Use
- 10.2.2. Business Use
- 10.1. Market Analysis, Insights and Forecast - by Product Type
- 11. Asia Pacific UK Virtual Cards Market Analysis, Insights and Forecast, 2020-2032
- 11.1. Market Analysis, Insights and Forecast - by Product Type
- 11.1.1. B2B Virtual Cards
- 11.1.2. B2C Remote Payment Virtual Cards
- 11.1.3. B2C PoS Virtual Cards
- 11.2. Market Analysis, Insights and Forecast - by End User
- 11.2.1. Consumer Use
- 11.2.2. Business Use
- 11.1. Market Analysis, Insights and Forecast - by Product Type
- 12. Competitive Analysis
- 12.1. Company Profiles
- 12.1.1 Revolut
- 12.1.1.1. Company Overview
- 12.1.1.2. Products
- 12.1.1.3. Company Financials
- 12.1.1.4. SWOT Analysis
- 12.1.2 Monese
- 12.1.2.1. Company Overview
- 12.1.2.2. Products
- 12.1.2.3. Company Financials
- 12.1.2.4. SWOT Analysis
- 12.1.3 Monzo
- 12.1.3.1. Company Overview
- 12.1.3.2. Products
- 12.1.3.3. Company Financials
- 12.1.3.4. SWOT Analysis
- 12.1.4 Starling Bank
- 12.1.4.1. Company Overview
- 12.1.4.2. Products
- 12.1.4.3. Company Financials
- 12.1.4.4. SWOT Analysis
- 12.1.5 Skrill
- 12.1.5.1. Company Overview
- 12.1.5.2. Products
- 12.1.5.3. Company Financials
- 12.1.5.4. SWOT Analysis
- 12.1.6 iCard
- 12.1.6.1. Company Overview
- 12.1.6.2. Products
- 12.1.6.3. Company Financials
- 12.1.6.4. SWOT Analysis
- 12.1.7 US Unlocked
- 12.1.7.1. Company Overview
- 12.1.7.2. Products
- 12.1.7.3. Company Financials
- 12.1.7.4. SWOT Analysis
- 12.1.8 Klarna
- 12.1.8.1. Company Overview
- 12.1.8.2. Products
- 12.1.8.3. Company Financials
- 12.1.8.4. SWOT Analysis
- 12.1.9 Pervesk
- 12.1.9.1. Company Overview
- 12.1.9.2. Products
- 12.1.9.3. Company Financials
- 12.1.9.4. SWOT Analysis
- 12.1.10 Payoneer**List Not Exhaustive
- 12.1.10.1. Company Overview
- 12.1.10.2. Products
- 12.1.10.3. Company Financials
- 12.1.10.4. SWOT Analysis
- 12.1.1 Revolut
- 12.2. Market Entropy
- 12.2.1 Company's Key Areas Served
- 12.2.2 Recent Developments
- 12.3. Company Market Share Analysis 2025
- 12.3.1 Top 5 Companies Market Share Analysis
- 12.3.2 Top 3 Companies Market Share Analysis
- 12.4. List of Potential Customers
- 13. Research Methodology
List of Figures
- Figure 1: Global UK Virtual Cards Market Revenue Breakdown (billion, %) by Region 2025 & 2033
- Figure 2: North America UK Virtual Cards Market Revenue (billion), by Product Type 2025 & 2033
- Figure 3: North America UK Virtual Cards Market Revenue Share (%), by Product Type 2025 & 2033
- Figure 4: North America UK Virtual Cards Market Revenue (billion), by End User 2025 & 2033
- Figure 5: North America UK Virtual Cards Market Revenue Share (%), by End User 2025 & 2033
- Figure 6: North America UK Virtual Cards Market Revenue (billion), by Country 2025 & 2033
- Figure 7: North America UK Virtual Cards Market Revenue Share (%), by Country 2025 & 2033
- Figure 8: South America UK Virtual Cards Market Revenue (billion), by Product Type 2025 & 2033
- Figure 9: South America UK Virtual Cards Market Revenue Share (%), by Product Type 2025 & 2033
- Figure 10: South America UK Virtual Cards Market Revenue (billion), by End User 2025 & 2033
- Figure 11: South America UK Virtual Cards Market Revenue Share (%), by End User 2025 & 2033
- Figure 12: South America UK Virtual Cards Market Revenue (billion), by Country 2025 & 2033
- Figure 13: South America UK Virtual Cards Market Revenue Share (%), by Country 2025 & 2033
- Figure 14: Europe UK Virtual Cards Market Revenue (billion), by Product Type 2025 & 2033
- Figure 15: Europe UK Virtual Cards Market Revenue Share (%), by Product Type 2025 & 2033
- Figure 16: Europe UK Virtual Cards Market Revenue (billion), by End User 2025 & 2033
- Figure 17: Europe UK Virtual Cards Market Revenue Share (%), by End User 2025 & 2033
- Figure 18: Europe UK Virtual Cards Market Revenue (billion), by Country 2025 & 2033
- Figure 19: Europe UK Virtual Cards Market Revenue Share (%), by Country 2025 & 2033
- Figure 20: Middle East & Africa UK Virtual Cards Market Revenue (billion), by Product Type 2025 & 2033
- Figure 21: Middle East & Africa UK Virtual Cards Market Revenue Share (%), by Product Type 2025 & 2033
- Figure 22: Middle East & Africa UK Virtual Cards Market Revenue (billion), by End User 2025 & 2033
- Figure 23: Middle East & Africa UK Virtual Cards Market Revenue Share (%), by End User 2025 & 2033
- Figure 24: Middle East & Africa UK Virtual Cards Market Revenue (billion), by Country 2025 & 2033
- Figure 25: Middle East & Africa UK Virtual Cards Market Revenue Share (%), by Country 2025 & 2033
- Figure 26: Asia Pacific UK Virtual Cards Market Revenue (billion), by Product Type 2025 & 2033
- Figure 27: Asia Pacific UK Virtual Cards Market Revenue Share (%), by Product Type 2025 & 2033
- Figure 28: Asia Pacific UK Virtual Cards Market Revenue (billion), by End User 2025 & 2033
- Figure 29: Asia Pacific UK Virtual Cards Market Revenue Share (%), by End User 2025 & 2033
- Figure 30: Asia Pacific UK Virtual Cards Market Revenue (billion), by Country 2025 & 2033
- Figure 31: Asia Pacific UK Virtual Cards Market Revenue Share (%), by Country 2025 & 2033
List of Tables
- Table 1: Global UK Virtual Cards Market Revenue billion Forecast, by Product Type 2020 & 2033
- Table 2: Global UK Virtual Cards Market Revenue billion Forecast, by End User 2020 & 2033
- Table 3: Global UK Virtual Cards Market Revenue billion Forecast, by Region 2020 & 2033
- Table 4: Global UK Virtual Cards Market Revenue billion Forecast, by Product Type 2020 & 2033
- Table 5: Global UK Virtual Cards Market Revenue billion Forecast, by End User 2020 & 2033
- Table 6: Global UK Virtual Cards Market Revenue billion Forecast, by Country 2020 & 2033
- Table 7: United States UK Virtual Cards Market Revenue (billion) Forecast, by Application 2020 & 2033
- Table 8: Canada UK Virtual Cards Market Revenue (billion) Forecast, by Application 2020 & 2033
- Table 9: Mexico UK Virtual Cards Market Revenue (billion) Forecast, by Application 2020 & 2033
- Table 10: Global UK Virtual Cards Market Revenue billion Forecast, by Product Type 2020 & 2033
- Table 11: Global UK Virtual Cards Market Revenue billion Forecast, by End User 2020 & 2033
- Table 12: Global UK Virtual Cards Market Revenue billion Forecast, by Country 2020 & 2033
- Table 13: Brazil UK Virtual Cards Market Revenue (billion) Forecast, by Application 2020 & 2033
- Table 14: Argentina UK Virtual Cards Market Revenue (billion) Forecast, by Application 2020 & 2033
- Table 15: Rest of South America UK Virtual Cards Market Revenue (billion) Forecast, by Application 2020 & 2033
- Table 16: Global UK Virtual Cards Market Revenue billion Forecast, by Product Type 2020 & 2033
- Table 17: Global UK Virtual Cards Market Revenue billion Forecast, by End User 2020 & 2033
- Table 18: Global UK Virtual Cards Market Revenue billion Forecast, by Country 2020 & 2033
- Table 19: United Kingdom UK Virtual Cards Market Revenue (billion) Forecast, by Application 2020 & 2033
- Table 20: Germany UK Virtual Cards Market Revenue (billion) Forecast, by Application 2020 & 2033
- Table 21: France UK Virtual Cards Market Revenue (billion) Forecast, by Application 2020 & 2033
- Table 22: Italy UK Virtual Cards Market Revenue (billion) Forecast, by Application 2020 & 2033
- Table 23: Spain UK Virtual Cards Market Revenue (billion) Forecast, by Application 2020 & 2033
- Table 24: Russia UK Virtual Cards Market Revenue (billion) Forecast, by Application 2020 & 2033
- Table 25: Benelux UK Virtual Cards Market Revenue (billion) Forecast, by Application 2020 & 2033
- Table 26: Nordics UK Virtual Cards Market Revenue (billion) Forecast, by Application 2020 & 2033
- Table 27: Rest of Europe UK Virtual Cards Market Revenue (billion) Forecast, by Application 2020 & 2033
- Table 28: Global UK Virtual Cards Market Revenue billion Forecast, by Product Type 2020 & 2033
- Table 29: Global UK Virtual Cards Market Revenue billion Forecast, by End User 2020 & 2033
- Table 30: Global UK Virtual Cards Market Revenue billion Forecast, by Country 2020 & 2033
- Table 31: Turkey UK Virtual Cards Market Revenue (billion) Forecast, by Application 2020 & 2033
- Table 32: Israel UK Virtual Cards Market Revenue (billion) Forecast, by Application 2020 & 2033
- Table 33: GCC UK Virtual Cards Market Revenue (billion) Forecast, by Application 2020 & 2033
- Table 34: North Africa UK Virtual Cards Market Revenue (billion) Forecast, by Application 2020 & 2033
- Table 35: South Africa UK Virtual Cards Market Revenue (billion) Forecast, by Application 2020 & 2033
- Table 36: Rest of Middle East & Africa UK Virtual Cards Market Revenue (billion) Forecast, by Application 2020 & 2033
- Table 37: Global UK Virtual Cards Market Revenue billion Forecast, by Product Type 2020 & 2033
- Table 38: Global UK Virtual Cards Market Revenue billion Forecast, by End User 2020 & 2033
- Table 39: Global UK Virtual Cards Market Revenue billion Forecast, by Country 2020 & 2033
- Table 40: China UK Virtual Cards Market Revenue (billion) Forecast, by Application 2020 & 2033
- Table 41: India UK Virtual Cards Market Revenue (billion) Forecast, by Application 2020 & 2033
- Table 42: Japan UK Virtual Cards Market Revenue (billion) Forecast, by Application 2020 & 2033
- Table 43: South Korea UK Virtual Cards Market Revenue (billion) Forecast, by Application 2020 & 2033
- Table 44: ASEAN UK Virtual Cards Market Revenue (billion) Forecast, by Application 2020 & 2033
- Table 45: Oceania UK Virtual Cards Market Revenue (billion) Forecast, by Application 2020 & 2033
- Table 46: Rest of Asia Pacific UK Virtual Cards Market Revenue (billion) Forecast, by Application 2020 & 2033
Frequently Asked Questions
1. What is the projected Compound Annual Growth Rate (CAGR) of the UK Virtual Cards Market?
The projected CAGR is approximately 18.5%.
2. Which companies are prominent players in the UK Virtual Cards Market?
Key companies in the market include Revolut, Monese, Monzo, Starling Bank, Skrill, iCard, US Unlocked, Klarna, Pervesk, Payoneer**List Not Exhaustive.
3. What are the main segments of the UK Virtual Cards Market?
The market segments include Product Type, End User.
4. Can you provide details about the market size?
The market size is estimated to be USD 1.34 billion as of 2022.
5. What are some drivers contributing to market growth?
N/A
6. What are the notable trends driving market growth?
Increasing Online Payments is Driving the Market for Virtual Cards in United Kingdom.
7. Are there any restraints impacting market growth?
N/A
8. Can you provide examples of recent developments in the market?
In November 2021, Revolut announced the acquisition of Nobly POS (www.noblypos.com), a highly regarded ePOS software vendor, to expand its offering to the restaurant and hotel sectors. The acquired ePOS system is popular in the UK, USA, and Australia. The acquisition will expand Revolut's offer to serve hospitality SMEs and accelerate the growth of Revolut's Business and Acquiring products.
9. What pricing options are available for accessing the report?
Pricing options include single-user, multi-user, and enterprise licenses priced at USD 3800, USD 4500, and USD 5800 respectively.
10. Is the market size provided in terms of value or volume?
The market size is provided in terms of value, measured in billion.
11. Are there any specific market keywords associated with the report?
Yes, the market keyword associated with the report is "UK Virtual Cards Market," which aids in identifying and referencing the specific market segment covered.
12. How do I determine which pricing option suits my needs best?
The pricing options vary based on user requirements and access needs. Individual users may opt for single-user licenses, while businesses requiring broader access may choose multi-user or enterprise licenses for cost-effective access to the report.
13. Are there any additional resources or data provided in the UK Virtual Cards Market report?
While the report offers comprehensive insights, it's advisable to review the specific contents or supplementary materials provided to ascertain if additional resources or data are available.
14. How can I stay updated on further developments or reports in the UK Virtual Cards Market?
To stay informed about further developments, trends, and reports in the UK Virtual Cards Market, consider subscribing to industry newsletters, following relevant companies and organizations, or regularly checking reputable industry news sources and publications.
Methodology
Step 1 - Identification of Relevant Samples Size from Population Database


Step 2 - Approaches for Defining Global Market Size (Value, Volume* & Price*)

Note*: In applicable scenarios
Step 3 - Data Sources
Primary Research
- Web Analytics
- Survey Reports
- Research Institute
- Latest Research Reports
- Opinion Leaders
Secondary Research
- Annual Reports
- White Paper
- Latest Press Release
- Industry Association
- Paid Database
- Investor Presentations

Step 4 - Data Triangulation
Involves using different sources of information in order to increase the validity of a study
These sources are likely to be stakeholders in a program - participants, other researchers, program staff, other community members, and so on.
Then we put all data in single framework & apply various statistical tools to find out the dynamic on the market.
During the analysis stage, feedback from the stakeholder groups would be compared to determine areas of agreement as well as areas of divergence