
Key Insights
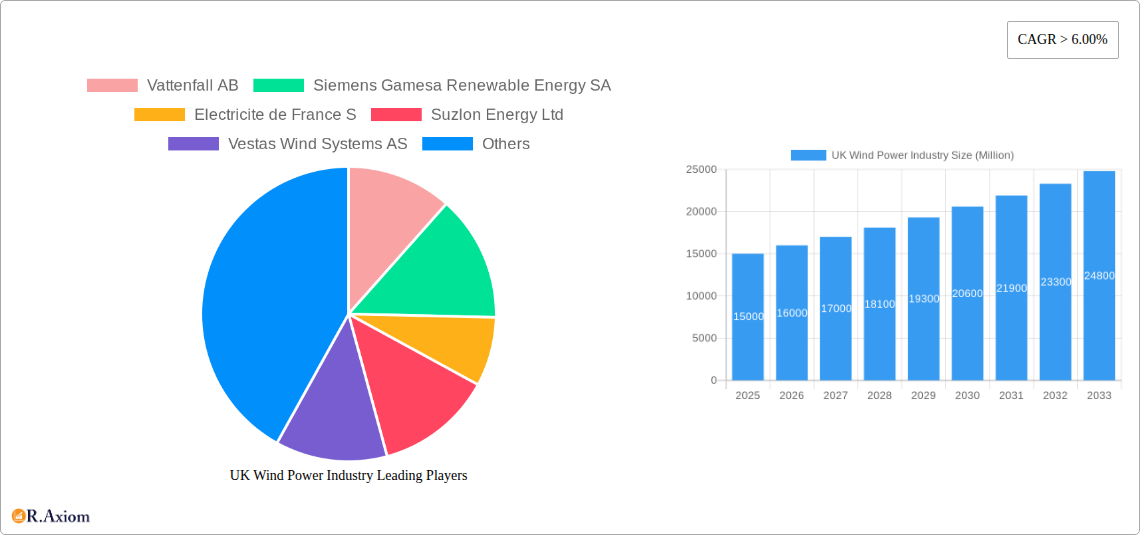
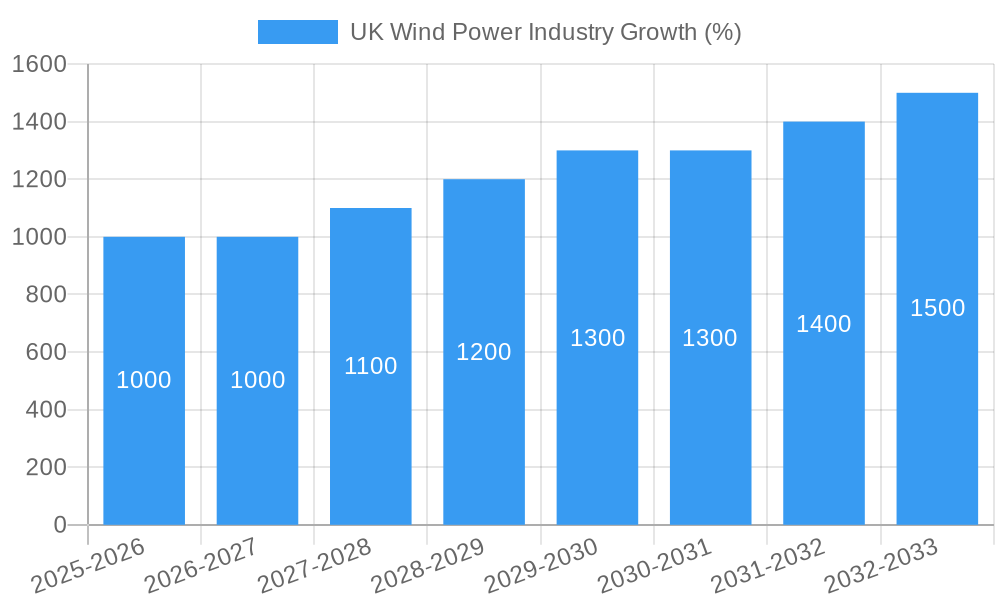
The UK wind power industry is experiencing robust growth, driven by the government's ambitious renewable energy targets and the decreasing cost of wind turbine technology. The market, encompassing both onshore and offshore wind power, is projected to witness a Compound Annual Growth Rate (CAGR) exceeding 6% from 2025 to 2033. Onshore wind, while facing some planning challenges related to land availability and public perception, continues to contribute significantly to the nation's energy mix. However, the major growth driver lies in offshore wind, particularly in the development of larger, more efficient turbines in deeper waters. This segment is attracting substantial investment from both domestic and international players, including Vattenfall AB, Orsted AS, and Siemens Gamesa Renewable Energy SA, leveraging the UK's extensive coastline and favorable wind resources. The UK's strategic location also facilitates the export of technology and expertise to other European markets. While regulatory hurdles and grid infrastructure limitations present some constraints, ongoing government initiatives aimed at streamlining permitting processes and upgrading grid capacity are mitigating these challenges. Furthermore, the increasing integration of wind power with energy storage solutions promises to enhance grid stability and further boost the industry's growth trajectory.
The competitive landscape is marked by a mix of established international players and domestic companies. The concentration of market share among a few major players suggests the existence of economies of scale and significant barriers to entry. Nevertheless, opportunities exist for smaller companies specializing in niche areas like turbine maintenance, grid integration, and innovative energy storage solutions. The forecast period of 2025-2033 reflects an optimistic outlook, driven by continuous technological advancements, supportive government policies, and increasing public awareness of climate change and the urgency for clean energy transition. The UK's commitment to net-zero emissions by 2050 will further incentivize investment in wind power, ensuring continued expansion of this critical sector. Analyzing historical data from 2019-2024, along with current market dynamics, provides a robust foundation for the projected growth figures. The strong government backing and the ongoing evolution of offshore wind capacity ensures that the UK wind energy sector remains a key player in the global renewable energy transition.
UK Wind Power Industry: Market Analysis & Forecast Report (2019-2033)
An in-depth analysis of the UK wind power market, offering critical insights into market dynamics, competitive landscape, and future growth opportunities. This comprehensive report provides a detailed assessment of the UK wind power industry, covering the period from 2019 to 2033, with a focus on the base year 2025 and forecast period 2025-2033. The report utilizes rigorous data analysis and market intelligence to offer actionable insights for industry stakeholders, investors, and policymakers.
UK Wind Power Industry Market Concentration & Innovation
This section analyzes the level of market concentration within the UK wind power sector, examining the market share held by key players like Vattenfall AB, Siemens Gamesa Renewable Energy SA, and Orsted AS. We evaluate innovation drivers, including government incentives, technological advancements (e.g., floating offshore wind turbines), and the role of research and development. The regulatory landscape, including licensing processes and grid connection policies, is critically assessed, along with the impact of potential substitute technologies (e.g., solar power). End-user trends, particularly the increasing demand for renewable energy from businesses and households, are examined. Finally, the report details significant mergers and acquisitions (M&A) activities within the industry, including deal values (in Millions) where available. For example, the acquisition of [Company X] by [Company Y] in [Year] for £xx Million significantly impacted market share. We estimate that the total M&A value in the period 2019-2024 totalled £xx Million.
- Market Share Analysis: Detailed breakdown of market share by major players in both onshore and offshore wind power segments.
- Innovation Drivers: Assessment of technological advancements, R&D investments, and government policies.
- Regulatory Framework: Analysis of licensing, grid connection, and environmental regulations.
- M&A Activity: Review of key mergers and acquisitions, including deal values and their impact on market dynamics.
UK Wind Power Industry Industry Trends & Insights
This section delves into the key trends shaping the UK wind power market, including substantial growth in renewable energy demand driven by climate change concerns and government targets. Technological disruptions, such as advancements in turbine design and energy storage solutions, are explored, along with their impact on market growth and competitiveness. We also analyze consumer preferences, including increasing awareness of environmental sustainability and the desire for cleaner energy sources. The competitive dynamics are examined, focusing on strategies employed by major players to gain market share and the impact of pricing strategies and technological differentiation. The report includes projected Compound Annual Growth Rate (CAGR) for the forecast period and assesses market penetration of wind power within the UK energy mix. The estimated market size in 2025 is £xx Million, with a projected CAGR of xx% from 2025-2033, resulting in a market size of £xx Million by 2033.
Dominant Markets & Segments in UK Wind Power Industry
This section identifies the leading regions and segments within the UK wind power market, differentiating between onshore and offshore wind power. Detailed analysis focuses on the factors contributing to the dominance of specific areas or segments.
Onshore Wind Power:
- Key Drivers:
- Government subsidies and renewable energy targets.
- Availability of suitable land and lower initial investment costs compared to offshore.
- Proximity to existing transmission infrastructure in certain regions.
Offshore Wind Power:
- Key Drivers:
- Higher capacity factors due to consistent wind speeds.
- Growing government support for offshore wind farm development.
- Technological advancements in turbine design and installation techniques (e.g., floating offshore wind).
The dominance of [Specific Region/Area] in [Onshore/Offshore] wind power is attributed to [Detailed explanation of dominant factors]. Scotland's strong performance in offshore wind is largely due to its geographic advantages and supportive policies, while [Specific region] leads in onshore due to its readily available land and infrastructure.
UK Wind Power Industry Product Developments
Recent product innovations have focused on larger, more efficient wind turbines, improved blade designs for increased energy capture, and the integration of smart grid technologies for optimized energy distribution. These advancements have enhanced the competitiveness of wind power, leading to lower levelized cost of energy (LCOE) and improved grid stability. The market is also witnessing growth in innovative floating offshore wind turbine technologies, which are opening up new opportunities for deployment in deeper waters.
Report Scope & Segmentation Analysis
This report segments the UK wind power market by type: onshore and offshore wind power.
Onshore Wind Power: This segment encompasses the installation and operation of wind turbines on land. Market size in 2025 is estimated at £xx Million, projected to reach £xx Million by 2033, with a CAGR of xx%. Competitive dynamics are characterized by a mix of established players and emerging companies.
Offshore Wind Power: This segment focuses on the installation and operation of wind turbines in marine environments. The 2025 market size is estimated at £xx Million, projected to grow to £xx Million by 2033, with a CAGR of xx%. The competitive landscape is characterized by intense competition among major global players.
Key Drivers of UK Wind Power Industry Growth
The growth of the UK wind power industry is driven by several factors: stringent government targets for renewable energy deployment, supportive policy frameworks, including tax incentives and feed-in tariffs, and decreasing technology costs, making wind power increasingly competitive with fossil fuels. Furthermore, increasing public awareness of climate change and the need for sustainable energy sources is fueling demand for renewable energy solutions.
Challenges in the UK Wind Power Industry Sector
The UK wind power industry faces several challenges, including securing sufficient grid connection capacity, navigating complex permitting processes, and managing potential impacts on wildlife and the marine environment. Supply chain disruptions, particularly related to critical components like turbine blades and generators, have also presented significant obstacles, while competition from other renewable energy sources can impact market share. These challenges result in increased development costs and project delays, impacting overall growth.
Emerging Opportunities in UK Wind Power Industry
The industry is witnessing promising opportunities in the development of floating offshore wind technology, allowing for expansion into deeper water areas. The integration of energy storage solutions, such as batteries, is enhancing the reliability and stability of wind power generation. Furthermore, the growing demand for corporate Power Purchase Agreements (PPAs) presents new business models for wind farm developers.
Leading Players in the UK Wind Power Industry Market
- Vattenfall AB
- Siemens Gamesa Renewable Energy SA
- Electricite de France S
- Suzlon Energy Ltd
- Vestas Wind Systems AS
- General Electric Company
- Orsted AS
Key Developments in UK Wind Power Industry Industry
- 2023-Q4: Government announces new funding for offshore wind farm development.
- 2022-Q3: Launch of a new floating offshore wind turbine model by [Company Name].
- 2021-Q2: Major merger between two wind energy companies significantly increases market share.
- 2020-Q1: Successful demonstration of a new energy storage technology for wind power.
(Further bullet points can be added with specific data.)
Strategic Outlook for UK Wind Power Industry Market
The UK wind power market is poised for significant growth, driven by ambitious renewable energy targets, technological innovation, and increasing investor interest. The development of offshore wind, particularly floating offshore wind, will play a crucial role in expanding the country's renewable energy capacity. Technological advancements and strategic partnerships will be critical to overcoming challenges and unlocking the full potential of this dynamic sector. The combination of policy support, technological improvements and increased investor confidence will help to sustain this growth over the forecast period.
UK Wind Power Industry Segmentation
- 1. Onshore
- 2. Offshore
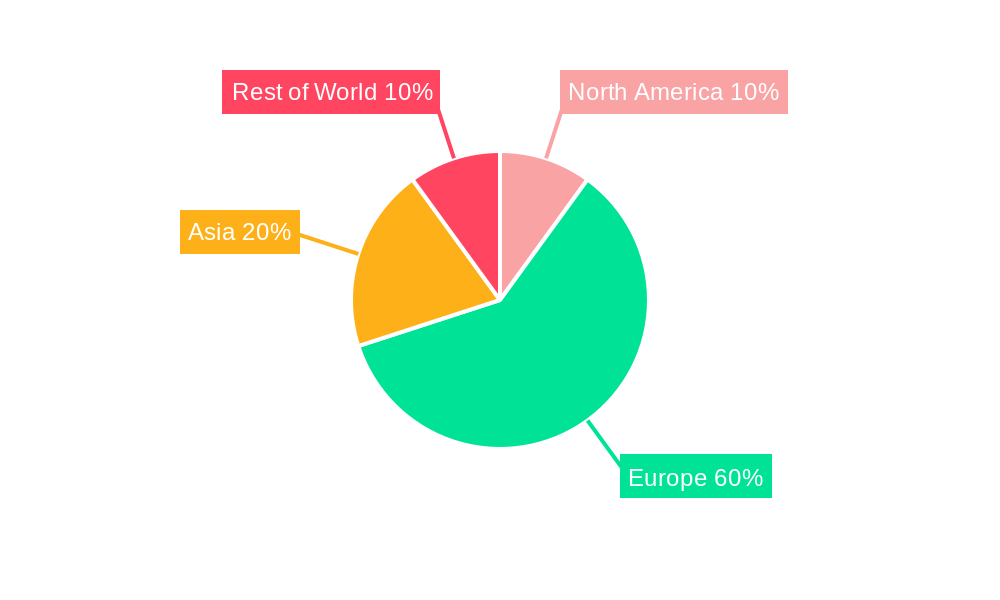
UK Wind Power Industry Segmentation By Geography
-
1. North America
- 1.1. United States
- 1.2. Canada
- 1.3. Mexico
-
2. South America
- 2.1. Brazil
- 2.2. Argentina
- 2.3. Rest of South America
-
3. Europe
- 3.1. United Kingdom
- 3.2. Germany
- 3.3. France
- 3.4. Italy
- 3.5. Spain
- 3.6. Russia
- 3.7. Benelux
- 3.8. Nordics
- 3.9. Rest of Europe
-
4. Middle East & Africa
- 4.1. Turkey
- 4.2. Israel
- 4.3. GCC
- 4.4. North Africa
- 4.5. South Africa
- 4.6. Rest of Middle East & Africa
-
5. Asia Pacific
- 5.1. China
- 5.2. India
- 5.3. Japan
- 5.4. South Korea
- 5.5. ASEAN
- 5.6. Oceania
- 5.7. Rest of Asia Pacific
UK Wind Power Industry REPORT HIGHLIGHTS
| Aspects | Details |
|---|---|
| Study Period | 2019-2033 |
| Base Year | 2024 |
| Estimated Year | 2025 |
| Forecast Period | 2025-2033 |
| Historical Period | 2019-2024 |
| Growth Rate | CAGR of > 6.00% from 2019-2033 |
| Segmentation |
|
Table of Contents
- 1. Introduction
- 1.1. Research Scope
- 1.2. Market Segmentation
- 1.3. Research Methodology
- 1.4. Definitions and Assumptions
- 2. Executive Summary
- 2.1. Introduction
- 3. Market Dynamics
- 3.1. Introduction
- 3.2. Market Drivers
- 3.2.1. 4.; Reduction in Energy Bills Due to Self-Power Consumption4.; Increasing Installation of Solar PV Modules in Residential Segment
- 3.3. Market Restrains
- 3.3.1. 4.; High Installation Cost as Compared to Rooftop PV Systems
- 3.4. Market Trends
- 3.4.1. Offshore Segment to Dominate the Market
- 4. Market Factor Analysis
- 4.1. Porters Five Forces
- 4.2. Supply/Value Chain
- 4.3. PESTEL analysis
- 4.4. Market Entropy
- 4.5. Patent/Trademark Analysis
- 5. Global UK Wind Power Industry Analysis, Insights and Forecast, 2019-2031
- 5.1. Market Analysis, Insights and Forecast - by Onshore
- 5.2. Market Analysis, Insights and Forecast - by Offshore
- 5.3. Market Analysis, Insights and Forecast - by Region
- 5.3.1. North America
- 5.3.2. South America
- 5.3.3. Europe
- 5.3.4. Middle East & Africa
- 5.3.5. Asia Pacific
- 5.1. Market Analysis, Insights and Forecast - by Onshore
- 6. North America UK Wind Power Industry Analysis, Insights and Forecast, 2019-2031
- 6.1. Market Analysis, Insights and Forecast - by Onshore
- 6.2. Market Analysis, Insights and Forecast - by Offshore
- 6.1. Market Analysis, Insights and Forecast - by Onshore
- 7. South America UK Wind Power Industry Analysis, Insights and Forecast, 2019-2031
- 7.1. Market Analysis, Insights and Forecast - by Onshore
- 7.2. Market Analysis, Insights and Forecast - by Offshore
- 7.1. Market Analysis, Insights and Forecast - by Onshore
- 8. Europe UK Wind Power Industry Analysis, Insights and Forecast, 2019-2031
- 8.1. Market Analysis, Insights and Forecast - by Onshore
- 8.2. Market Analysis, Insights and Forecast - by Offshore
- 8.1. Market Analysis, Insights and Forecast - by Onshore
- 9. Middle East & Africa UK Wind Power Industry Analysis, Insights and Forecast, 2019-2031
- 9.1. Market Analysis, Insights and Forecast - by Onshore
- 9.2. Market Analysis, Insights and Forecast - by Offshore
- 9.1. Market Analysis, Insights and Forecast - by Onshore
- 10. Asia Pacific UK Wind Power Industry Analysis, Insights and Forecast, 2019-2031
- 10.1. Market Analysis, Insights and Forecast - by Onshore
- 10.2. Market Analysis, Insights and Forecast - by Offshore
- 10.1. Market Analysis, Insights and Forecast - by Onshore
- 11. Germany UK Wind Power Industry Analysis, Insights and Forecast, 2019-2031
- 12. France UK Wind Power Industry Analysis, Insights and Forecast, 2019-2031
- 13. Italy UK Wind Power Industry Analysis, Insights and Forecast, 2019-2031
- 14. United Kingdom UK Wind Power Industry Analysis, Insights and Forecast, 2019-2031
- 15. Netherlands UK Wind Power Industry Analysis, Insights and Forecast, 2019-2031
- 16. Rest of Europe UK Wind Power Industry Analysis, Insights and Forecast, 2019-2031
- 17. Competitive Analysis
- 17.1. Global Market Share Analysis 2024
- 17.2. Company Profiles
- 17.2.1 Vattenfall AB
- 17.2.1.1. Overview
- 17.2.1.2. Products
- 17.2.1.3. SWOT Analysis
- 17.2.1.4. Recent Developments
- 17.2.1.5. Financials (Based on Availability)
- 17.2.2 Siemens Gamesa Renewable Energy SA
- 17.2.2.1. Overview
- 17.2.2.2. Products
- 17.2.2.3. SWOT Analysis
- 17.2.2.4. Recent Developments
- 17.2.2.5. Financials (Based on Availability)
- 17.2.3 Electricite de France S
- 17.2.3.1. Overview
- 17.2.3.2. Products
- 17.2.3.3. SWOT Analysis
- 17.2.3.4. Recent Developments
- 17.2.3.5. Financials (Based on Availability)
- 17.2.4 Suzlon Energy Ltd
- 17.2.4.1. Overview
- 17.2.4.2. Products
- 17.2.4.3. SWOT Analysis
- 17.2.4.4. Recent Developments
- 17.2.4.5. Financials (Based on Availability)
- 17.2.5 Vestas Wind Systems AS
- 17.2.5.1. Overview
- 17.2.5.2. Products
- 17.2.5.3. SWOT Analysis
- 17.2.5.4. Recent Developments
- 17.2.5.5. Financials (Based on Availability)
- 17.2.6 General Electric Company
- 17.2.6.1. Overview
- 17.2.6.2. Products
- 17.2.6.3. SWOT Analysis
- 17.2.6.4. Recent Developments
- 17.2.6.5. Financials (Based on Availability)
- 17.2.7 Orsted AS
- 17.2.7.1. Overview
- 17.2.7.2. Products
- 17.2.7.3. SWOT Analysis
- 17.2.7.4. Recent Developments
- 17.2.7.5. Financials (Based on Availability)
- 17.2.1 Vattenfall AB
List of Figures
- Figure 1: Global UK Wind Power Industry Revenue Breakdown (Million, %) by Region 2024 & 2032
- Figure 2: Global UK Wind Power Industry Volume Breakdown (Gigawatt, %) by Region 2024 & 2032
- Figure 3: Europe UK Wind Power Industry Revenue (Million), by Country 2024 & 2032
- Figure 4: Europe UK Wind Power Industry Volume (Gigawatt), by Country 2024 & 2032
- Figure 5: Europe UK Wind Power Industry Revenue Share (%), by Country 2024 & 2032
- Figure 6: Europe UK Wind Power Industry Volume Share (%), by Country 2024 & 2032
- Figure 7: North America UK Wind Power Industry Revenue (Million), by Onshore 2024 & 2032
- Figure 8: North America UK Wind Power Industry Volume (Gigawatt), by Onshore 2024 & 2032
- Figure 9: North America UK Wind Power Industry Revenue Share (%), by Onshore 2024 & 2032
- Figure 10: North America UK Wind Power Industry Volume Share (%), by Onshore 2024 & 2032
- Figure 11: North America UK Wind Power Industry Revenue (Million), by Offshore 2024 & 2032
- Figure 12: North America UK Wind Power Industry Volume (Gigawatt), by Offshore 2024 & 2032
- Figure 13: North America UK Wind Power Industry Revenue Share (%), by Offshore 2024 & 2032
- Figure 14: North America UK Wind Power Industry Volume Share (%), by Offshore 2024 & 2032
- Figure 15: North America UK Wind Power Industry Revenue (Million), by Country 2024 & 2032
- Figure 16: North America UK Wind Power Industry Volume (Gigawatt), by Country 2024 & 2032
- Figure 17: North America UK Wind Power Industry Revenue Share (%), by Country 2024 & 2032
- Figure 18: North America UK Wind Power Industry Volume Share (%), by Country 2024 & 2032
- Figure 19: South America UK Wind Power Industry Revenue (Million), by Onshore 2024 & 2032
- Figure 20: South America UK Wind Power Industry Volume (Gigawatt), by Onshore 2024 & 2032
- Figure 21: South America UK Wind Power Industry Revenue Share (%), by Onshore 2024 & 2032
- Figure 22: South America UK Wind Power Industry Volume Share (%), by Onshore 2024 & 2032
- Figure 23: South America UK Wind Power Industry Revenue (Million), by Offshore 2024 & 2032
- Figure 24: South America UK Wind Power Industry Volume (Gigawatt), by Offshore 2024 & 2032
- Figure 25: South America UK Wind Power Industry Revenue Share (%), by Offshore 2024 & 2032
- Figure 26: South America UK Wind Power Industry Volume Share (%), by Offshore 2024 & 2032
- Figure 27: South America UK Wind Power Industry Revenue (Million), by Country 2024 & 2032
- Figure 28: South America UK Wind Power Industry Volume (Gigawatt), by Country 2024 & 2032
- Figure 29: South America UK Wind Power Industry Revenue Share (%), by Country 2024 & 2032
- Figure 30: South America UK Wind Power Industry Volume Share (%), by Country 2024 & 2032
- Figure 31: Europe UK Wind Power Industry Revenue (Million), by Onshore 2024 & 2032
- Figure 32: Europe UK Wind Power Industry Volume (Gigawatt), by Onshore 2024 & 2032
- Figure 33: Europe UK Wind Power Industry Revenue Share (%), by Onshore 2024 & 2032
- Figure 34: Europe UK Wind Power Industry Volume Share (%), by Onshore 2024 & 2032
- Figure 35: Europe UK Wind Power Industry Revenue (Million), by Offshore 2024 & 2032
- Figure 36: Europe UK Wind Power Industry Volume (Gigawatt), by Offshore 2024 & 2032
- Figure 37: Europe UK Wind Power Industry Revenue Share (%), by Offshore 2024 & 2032
- Figure 38: Europe UK Wind Power Industry Volume Share (%), by Offshore 2024 & 2032
- Figure 39: Europe UK Wind Power Industry Revenue (Million), by Country 2024 & 2032
- Figure 40: Europe UK Wind Power Industry Volume (Gigawatt), by Country 2024 & 2032
- Figure 41: Europe UK Wind Power Industry Revenue Share (%), by Country 2024 & 2032
- Figure 42: Europe UK Wind Power Industry Volume Share (%), by Country 2024 & 2032
- Figure 43: Middle East & Africa UK Wind Power Industry Revenue (Million), by Onshore 2024 & 2032
- Figure 44: Middle East & Africa UK Wind Power Industry Volume (Gigawatt), by Onshore 2024 & 2032
- Figure 45: Middle East & Africa UK Wind Power Industry Revenue Share (%), by Onshore 2024 & 2032
- Figure 46: Middle East & Africa UK Wind Power Industry Volume Share (%), by Onshore 2024 & 2032
- Figure 47: Middle East & Africa UK Wind Power Industry Revenue (Million), by Offshore 2024 & 2032
- Figure 48: Middle East & Africa UK Wind Power Industry Volume (Gigawatt), by Offshore 2024 & 2032
- Figure 49: Middle East & Africa UK Wind Power Industry Revenue Share (%), by Offshore 2024 & 2032
- Figure 50: Middle East & Africa UK Wind Power Industry Volume Share (%), by Offshore 2024 & 2032
- Figure 51: Middle East & Africa UK Wind Power Industry Revenue (Million), by Country 2024 & 2032
- Figure 52: Middle East & Africa UK Wind Power Industry Volume (Gigawatt), by Country 2024 & 2032
- Figure 53: Middle East & Africa UK Wind Power Industry Revenue Share (%), by Country 2024 & 2032
- Figure 54: Middle East & Africa UK Wind Power Industry Volume Share (%), by Country 2024 & 2032
- Figure 55: Asia Pacific UK Wind Power Industry Revenue (Million), by Onshore 2024 & 2032
- Figure 56: Asia Pacific UK Wind Power Industry Volume (Gigawatt), by Onshore 2024 & 2032
- Figure 57: Asia Pacific UK Wind Power Industry Revenue Share (%), by Onshore 2024 & 2032
- Figure 58: Asia Pacific UK Wind Power Industry Volume Share (%), by Onshore 2024 & 2032
- Figure 59: Asia Pacific UK Wind Power Industry Revenue (Million), by Offshore 2024 & 2032
- Figure 60: Asia Pacific UK Wind Power Industry Volume (Gigawatt), by Offshore 2024 & 2032
- Figure 61: Asia Pacific UK Wind Power Industry Revenue Share (%), by Offshore 2024 & 2032
- Figure 62: Asia Pacific UK Wind Power Industry Volume Share (%), by Offshore 2024 & 2032
- Figure 63: Asia Pacific UK Wind Power Industry Revenue (Million), by Country 2024 & 2032
- Figure 64: Asia Pacific UK Wind Power Industry Volume (Gigawatt), by Country 2024 & 2032
- Figure 65: Asia Pacific UK Wind Power Industry Revenue Share (%), by Country 2024 & 2032
- Figure 66: Asia Pacific UK Wind Power Industry Volume Share (%), by Country 2024 & 2032
List of Tables
- Table 1: Global UK Wind Power Industry Revenue Million Forecast, by Region 2019 & 2032
- Table 2: Global UK Wind Power Industry Volume Gigawatt Forecast, by Region 2019 & 2032
- Table 3: Global UK Wind Power Industry Revenue Million Forecast, by Onshore 2019 & 2032
- Table 4: Global UK Wind Power Industry Volume Gigawatt Forecast, by Onshore 2019 & 2032
- Table 5: Global UK Wind Power Industry Revenue Million Forecast, by Offshore 2019 & 2032
- Table 6: Global UK Wind Power Industry Volume Gigawatt Forecast, by Offshore 2019 & 2032
- Table 7: Global UK Wind Power Industry Revenue Million Forecast, by Region 2019 & 2032
- Table 8: Global UK Wind Power Industry Volume Gigawatt Forecast, by Region 2019 & 2032
- Table 9: Global UK Wind Power Industry Revenue Million Forecast, by Country 2019 & 2032
- Table 10: Global UK Wind Power Industry Volume Gigawatt Forecast, by Country 2019 & 2032
- Table 11: Germany UK Wind Power Industry Revenue (Million) Forecast, by Application 2019 & 2032
- Table 12: Germany UK Wind Power Industry Volume (Gigawatt) Forecast, by Application 2019 & 2032
- Table 13: France UK Wind Power Industry Revenue (Million) Forecast, by Application 2019 & 2032
- Table 14: France UK Wind Power Industry Volume (Gigawatt) Forecast, by Application 2019 & 2032
- Table 15: Italy UK Wind Power Industry Revenue (Million) Forecast, by Application 2019 & 2032
- Table 16: Italy UK Wind Power Industry Volume (Gigawatt) Forecast, by Application 2019 & 2032
- Table 17: United Kingdom UK Wind Power Industry Revenue (Million) Forecast, by Application 2019 & 2032
- Table 18: United Kingdom UK Wind Power Industry Volume (Gigawatt) Forecast, by Application 2019 & 2032
- Table 19: Netherlands UK Wind Power Industry Revenue (Million) Forecast, by Application 2019 & 2032
- Table 20: Netherlands UK Wind Power Industry Volume (Gigawatt) Forecast, by Application 2019 & 2032
- Table 21: Rest of Europe UK Wind Power Industry Revenue (Million) Forecast, by Application 2019 & 2032
- Table 22: Rest of Europe UK Wind Power Industry Volume (Gigawatt) Forecast, by Application 2019 & 2032
- Table 23: Global UK Wind Power Industry Revenue Million Forecast, by Onshore 2019 & 2032
- Table 24: Global UK Wind Power Industry Volume Gigawatt Forecast, by Onshore 2019 & 2032
- Table 25: Global UK Wind Power Industry Revenue Million Forecast, by Offshore 2019 & 2032
- Table 26: Global UK Wind Power Industry Volume Gigawatt Forecast, by Offshore 2019 & 2032
- Table 27: Global UK Wind Power Industry Revenue Million Forecast, by Country 2019 & 2032
- Table 28: Global UK Wind Power Industry Volume Gigawatt Forecast, by Country 2019 & 2032
- Table 29: United States UK Wind Power Industry Revenue (Million) Forecast, by Application 2019 & 2032
- Table 30: United States UK Wind Power Industry Volume (Gigawatt) Forecast, by Application 2019 & 2032
- Table 31: Canada UK Wind Power Industry Revenue (Million) Forecast, by Application 2019 & 2032
- Table 32: Canada UK Wind Power Industry Volume (Gigawatt) Forecast, by Application 2019 & 2032
- Table 33: Mexico UK Wind Power Industry Revenue (Million) Forecast, by Application 2019 & 2032
- Table 34: Mexico UK Wind Power Industry Volume (Gigawatt) Forecast, by Application 2019 & 2032
- Table 35: Global UK Wind Power Industry Revenue Million Forecast, by Onshore 2019 & 2032
- Table 36: Global UK Wind Power Industry Volume Gigawatt Forecast, by Onshore 2019 & 2032
- Table 37: Global UK Wind Power Industry Revenue Million Forecast, by Offshore 2019 & 2032
- Table 38: Global UK Wind Power Industry Volume Gigawatt Forecast, by Offshore 2019 & 2032
- Table 39: Global UK Wind Power Industry Revenue Million Forecast, by Country 2019 & 2032
- Table 40: Global UK Wind Power Industry Volume Gigawatt Forecast, by Country 2019 & 2032
- Table 41: Brazil UK Wind Power Industry Revenue (Million) Forecast, by Application 2019 & 2032
- Table 42: Brazil UK Wind Power Industry Volume (Gigawatt) Forecast, by Application 2019 & 2032
- Table 43: Argentina UK Wind Power Industry Revenue (Million) Forecast, by Application 2019 & 2032
- Table 44: Argentina UK Wind Power Industry Volume (Gigawatt) Forecast, by Application 2019 & 2032
- Table 45: Rest of South America UK Wind Power Industry Revenue (Million) Forecast, by Application 2019 & 2032
- Table 46: Rest of South America UK Wind Power Industry Volume (Gigawatt) Forecast, by Application 2019 & 2032
- Table 47: Global UK Wind Power Industry Revenue Million Forecast, by Onshore 2019 & 2032
- Table 48: Global UK Wind Power Industry Volume Gigawatt Forecast, by Onshore 2019 & 2032
- Table 49: Global UK Wind Power Industry Revenue Million Forecast, by Offshore 2019 & 2032
- Table 50: Global UK Wind Power Industry Volume Gigawatt Forecast, by Offshore 2019 & 2032
- Table 51: Global UK Wind Power Industry Revenue Million Forecast, by Country 2019 & 2032
- Table 52: Global UK Wind Power Industry Volume Gigawatt Forecast, by Country 2019 & 2032
- Table 53: United Kingdom UK Wind Power Industry Revenue (Million) Forecast, by Application 2019 & 2032
- Table 54: United Kingdom UK Wind Power Industry Volume (Gigawatt) Forecast, by Application 2019 & 2032
- Table 55: Germany UK Wind Power Industry Revenue (Million) Forecast, by Application 2019 & 2032
- Table 56: Germany UK Wind Power Industry Volume (Gigawatt) Forecast, by Application 2019 & 2032
- Table 57: France UK Wind Power Industry Revenue (Million) Forecast, by Application 2019 & 2032
- Table 58: France UK Wind Power Industry Volume (Gigawatt) Forecast, by Application 2019 & 2032
- Table 59: Italy UK Wind Power Industry Revenue (Million) Forecast, by Application 2019 & 2032
- Table 60: Italy UK Wind Power Industry Volume (Gigawatt) Forecast, by Application 2019 & 2032
- Table 61: Spain UK Wind Power Industry Revenue (Million) Forecast, by Application 2019 & 2032
- Table 62: Spain UK Wind Power Industry Volume (Gigawatt) Forecast, by Application 2019 & 2032
- Table 63: Russia UK Wind Power Industry Revenue (Million) Forecast, by Application 2019 & 2032
- Table 64: Russia UK Wind Power Industry Volume (Gigawatt) Forecast, by Application 2019 & 2032
- Table 65: Benelux UK Wind Power Industry Revenue (Million) Forecast, by Application 2019 & 2032
- Table 66: Benelux UK Wind Power Industry Volume (Gigawatt) Forecast, by Application 2019 & 2032
- Table 67: Nordics UK Wind Power Industry Revenue (Million) Forecast, by Application 2019 & 2032
- Table 68: Nordics UK Wind Power Industry Volume (Gigawatt) Forecast, by Application 2019 & 2032
- Table 69: Rest of Europe UK Wind Power Industry Revenue (Million) Forecast, by Application 2019 & 2032
- Table 70: Rest of Europe UK Wind Power Industry Volume (Gigawatt) Forecast, by Application 2019 & 2032
- Table 71: Global UK Wind Power Industry Revenue Million Forecast, by Onshore 2019 & 2032
- Table 72: Global UK Wind Power Industry Volume Gigawatt Forecast, by Onshore 2019 & 2032
- Table 73: Global UK Wind Power Industry Revenue Million Forecast, by Offshore 2019 & 2032
- Table 74: Global UK Wind Power Industry Volume Gigawatt Forecast, by Offshore 2019 & 2032
- Table 75: Global UK Wind Power Industry Revenue Million Forecast, by Country 2019 & 2032
- Table 76: Global UK Wind Power Industry Volume Gigawatt Forecast, by Country 2019 & 2032
- Table 77: Turkey UK Wind Power Industry Revenue (Million) Forecast, by Application 2019 & 2032
- Table 78: Turkey UK Wind Power Industry Volume (Gigawatt) Forecast, by Application 2019 & 2032
- Table 79: Israel UK Wind Power Industry Revenue (Million) Forecast, by Application 2019 & 2032
- Table 80: Israel UK Wind Power Industry Volume (Gigawatt) Forecast, by Application 2019 & 2032
- Table 81: GCC UK Wind Power Industry Revenue (Million) Forecast, by Application 2019 & 2032
- Table 82: GCC UK Wind Power Industry Volume (Gigawatt) Forecast, by Application 2019 & 2032
- Table 83: North Africa UK Wind Power Industry Revenue (Million) Forecast, by Application 2019 & 2032
- Table 84: North Africa UK Wind Power Industry Volume (Gigawatt) Forecast, by Application 2019 & 2032
- Table 85: South Africa UK Wind Power Industry Revenue (Million) Forecast, by Application 2019 & 2032
- Table 86: South Africa UK Wind Power Industry Volume (Gigawatt) Forecast, by Application 2019 & 2032
- Table 87: Rest of Middle East & Africa UK Wind Power Industry Revenue (Million) Forecast, by Application 2019 & 2032
- Table 88: Rest of Middle East & Africa UK Wind Power Industry Volume (Gigawatt) Forecast, by Application 2019 & 2032
- Table 89: Global UK Wind Power Industry Revenue Million Forecast, by Onshore 2019 & 2032
- Table 90: Global UK Wind Power Industry Volume Gigawatt Forecast, by Onshore 2019 & 2032
- Table 91: Global UK Wind Power Industry Revenue Million Forecast, by Offshore 2019 & 2032
- Table 92: Global UK Wind Power Industry Volume Gigawatt Forecast, by Offshore 2019 & 2032
- Table 93: Global UK Wind Power Industry Revenue Million Forecast, by Country 2019 & 2032
- Table 94: Global UK Wind Power Industry Volume Gigawatt Forecast, by Country 2019 & 2032
- Table 95: China UK Wind Power Industry Revenue (Million) Forecast, by Application 2019 & 2032
- Table 96: China UK Wind Power Industry Volume (Gigawatt) Forecast, by Application 2019 & 2032
- Table 97: India UK Wind Power Industry Revenue (Million) Forecast, by Application 2019 & 2032
- Table 98: India UK Wind Power Industry Volume (Gigawatt) Forecast, by Application 2019 & 2032
- Table 99: Japan UK Wind Power Industry Revenue (Million) Forecast, by Application 2019 & 2032
- Table 100: Japan UK Wind Power Industry Volume (Gigawatt) Forecast, by Application 2019 & 2032
- Table 101: South Korea UK Wind Power Industry Revenue (Million) Forecast, by Application 2019 & 2032
- Table 102: South Korea UK Wind Power Industry Volume (Gigawatt) Forecast, by Application 2019 & 2032
- Table 103: ASEAN UK Wind Power Industry Revenue (Million) Forecast, by Application 2019 & 2032
- Table 104: ASEAN UK Wind Power Industry Volume (Gigawatt) Forecast, by Application 2019 & 2032
- Table 105: Oceania UK Wind Power Industry Revenue (Million) Forecast, by Application 2019 & 2032
- Table 106: Oceania UK Wind Power Industry Volume (Gigawatt) Forecast, by Application 2019 & 2032
- Table 107: Rest of Asia Pacific UK Wind Power Industry Revenue (Million) Forecast, by Application 2019 & 2032
- Table 108: Rest of Asia Pacific UK Wind Power Industry Volume (Gigawatt) Forecast, by Application 2019 & 2032
Frequently Asked Questions
1. What is the projected Compound Annual Growth Rate (CAGR) of the UK Wind Power Industry?
The projected CAGR is approximately > 6.00%.
2. Which companies are prominent players in the UK Wind Power Industry?
Key companies in the market include Vattenfall AB, Siemens Gamesa Renewable Energy SA, Electricite de France S, Suzlon Energy Ltd, Vestas Wind Systems AS, General Electric Company, Orsted AS.
3. What are the main segments of the UK Wind Power Industry?
The market segments include Onshore, Offshore.
4. Can you provide details about the market size?
The market size is estimated to be USD XX Million as of 2022.
5. What are some drivers contributing to market growth?
4.; Reduction in Energy Bills Due to Self-Power Consumption4.; Increasing Installation of Solar PV Modules in Residential Segment.
6. What are the notable trends driving market growth?
Offshore Segment to Dominate the Market.
7. Are there any restraints impacting market growth?
4.; High Installation Cost as Compared to Rooftop PV Systems.
8. Can you provide examples of recent developments in the market?
N/A
9. What pricing options are available for accessing the report?
Pricing options include single-user, multi-user, and enterprise licenses priced at USD 3800, USD 4500, and USD 5800 respectively.
10. Is the market size provided in terms of value or volume?
The market size is provided in terms of value, measured in Million and volume, measured in Gigawatt.
11. Are there any specific market keywords associated with the report?
Yes, the market keyword associated with the report is "UK Wind Power Industry," which aids in identifying and referencing the specific market segment covered.
12. How do I determine which pricing option suits my needs best?
The pricing options vary based on user requirements and access needs. Individual users may opt for single-user licenses, while businesses requiring broader access may choose multi-user or enterprise licenses for cost-effective access to the report.
13. Are there any additional resources or data provided in the UK Wind Power Industry report?
While the report offers comprehensive insights, it's advisable to review the specific contents or supplementary materials provided to ascertain if additional resources or data are available.
14. How can I stay updated on further developments or reports in the UK Wind Power Industry?
To stay informed about further developments, trends, and reports in the UK Wind Power Industry, consider subscribing to industry newsletters, following relevant companies and organizations, or regularly checking reputable industry news sources and publications.
Methodology
Step 1 - Identification of Relevant Samples Size from Population Database


Step 2 - Approaches for Defining Global Market Size (Value, Volume* & Price*)

Note*: In applicable scenarios
Step 3 - Data Sources
Primary Research
- Web Analytics
- Survey Reports
- Research Institute
- Latest Research Reports
- Opinion Leaders
Secondary Research
- Annual Reports
- White Paper
- Latest Press Release
- Industry Association
- Paid Database
- Investor Presentations

Step 4 - Data Triangulation
Involves using different sources of information in order to increase the validity of a study
These sources are likely to be stakeholders in a program - participants, other researchers, program staff, other community members, and so on.
Then we put all data in single framework & apply various statistical tools to find out the dynamic on the market.
During the analysis stage, feedback from the stakeholder groups would be compared to determine areas of agreement as well as areas of divergence


