

Key Insights
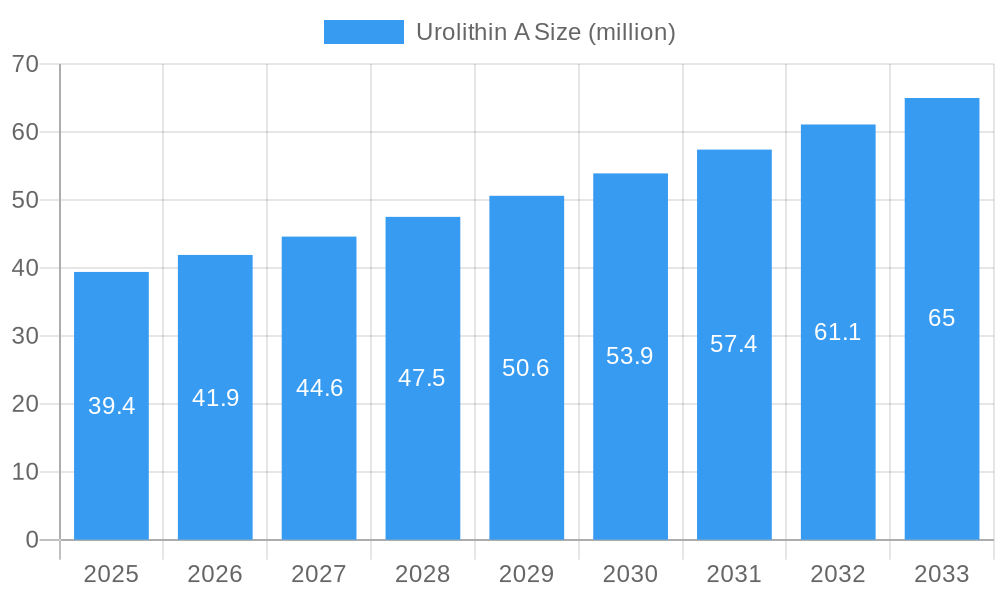
The Urolithin A market, valued at $39.4 million in 2025, is projected to experience robust growth, exhibiting a compound annual growth rate (CAGR) of 6.1% from 2025 to 2033. This expansion is fueled by several key drivers. Increasing awareness of the compound's potential health benefits, particularly its role in promoting healthy aging and mitigating age-related muscle decline (sarcopenia), is a significant factor. Furthermore, the growing prevalence of age-related diseases and the rising demand for natural and effective anti-aging supplements are boosting market demand. The market is witnessing a surge in research and development activities focused on exploring new applications and enhancing the bioavailability of Urolithin A. This, coupled with strategic collaborations between research institutions and supplement manufacturers, is further propelling market growth. However, challenges such as the relatively high cost of production and potential variations in product efficacy due to differences in extraction methods and formulations represent key restraints to wider market penetration. The market is segmented based on various factors, including product type (supplements, functional foods, etc.), application (health and wellness, pharmaceutical), and geographical region. Key players like Daicel, Suzhou Myland Pharm & Nutrition Inc., and others are actively investing in production capacity and innovation to capture a larger market share.
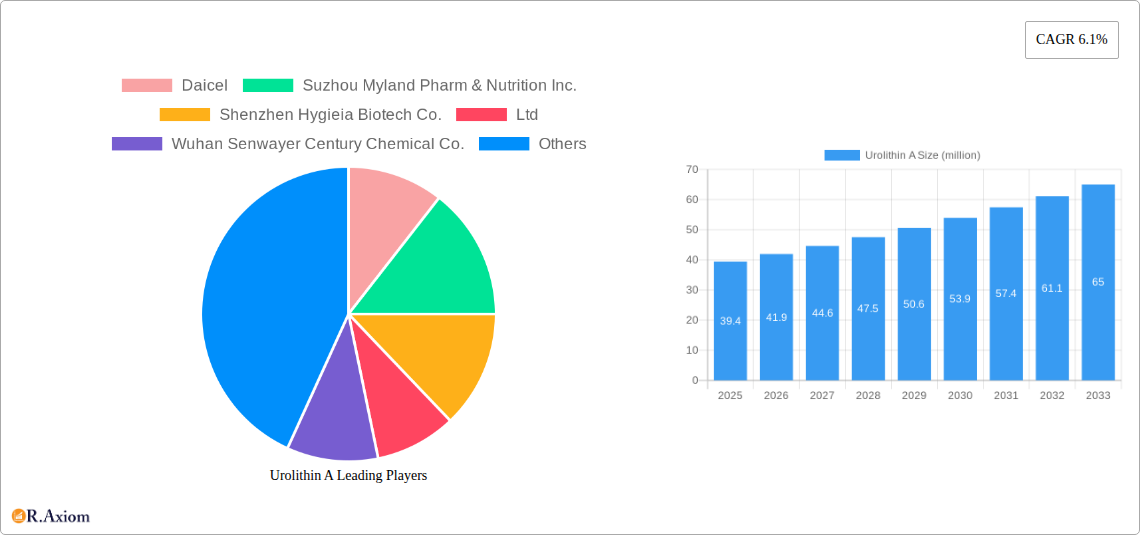
Urolithin A Market Size (In Million)
The future of the Urolithin A market appears promising, driven by continued scientific validation of its efficacy and increasing consumer adoption. However, achieving wider market penetration requires addressing production challenges and standardizing product quality. Strategic partnerships and further research into its applications could significantly influence market growth in the coming years. Expansion into new geographical markets, particularly in developing regions with growing aging populations, presents significant opportunities for market players. Focus on delivering high-quality, cost-effective products with demonstrable efficacy is crucial for sustained growth and market leadership in this dynamic sector.
Urolithin A Company Market Share
Urolithin A Market Report: 2019-2033 - A Comprehensive Analysis
This detailed report provides a comprehensive analysis of the global Urolithin A market, covering market size, growth projections, competitive landscape, and key industry trends from 2019 to 2033. The report leverages extensive primary and secondary research to offer actionable insights for industry stakeholders, including manufacturers, investors, and researchers. With a focus on market concentration, innovation, and emerging opportunities, this report is an essential resource for navigating the dynamic Urolithin A landscape. The study period spans 2019-2033, with 2025 serving as the base and estimated year. The forecast period extends from 2025 to 2033, while the historical period covers 2019-2024. The global market is projected to reach xx million by 2033, exhibiting a CAGR of xx% during the forecast period.
Urolithin A Market Concentration & Innovation
The Urolithin A market exhibits a moderately concentrated structure, with several key players holding significant market share. While precise market share figures for individual companies are proprietary and confidential, preliminary estimates suggest that the top five players account for approximately xx% of the global market in 2025. This concentration is driven by significant investments in R&D, strategic partnerships, and economies of scale. Innovation in Urolithin A production processes and delivery systems is a crucial factor driving market growth. This includes advancements in microbial fermentation and extraction techniques aimed at improving purity, yield, and cost-effectiveness. Regulatory frameworks, while currently less stringent compared to pharmaceuticals, are evolving, leading to increased scrutiny of product quality and safety. Consequently, companies are investing heavily in compliance and certification. Furthermore, M&A activity within the Urolithin A space remains relatively low to date, with a total estimated M&A deal value of approximately xx million during the historical period. This suggests potential for future consolidation as the market matures. Substitutes for Urolithin A are limited, enhancing its market position. End-user trends reflect a growing demand from the health and wellness sector.
- Market Concentration: Top 5 players hold approximately xx% of the market (2025 estimate).
- Innovation Drivers: Advancements in fermentation and extraction techniques, focus on product purity, and evolving regulatory compliance.
- M&A Activity (2019-2024): Total estimated deal value approximately xx million.
- Regulatory Frameworks: Evolving towards increased product quality and safety standards.
- Product Substitutes: Limited viable alternatives currently exist.
- End-User Trends: Increasing demand from health and wellness sector.
Urolithin A Industry Trends & Insights
The Urolithin A market is experiencing significant growth, driven by the increasing awareness of its potential health benefits, particularly in relation to anti-aging and gut health. The market’s expansion is fueled by rising consumer demand for natural health supplements and the growing scientific evidence supporting the efficacy of Urolithin A. Technological advancements in production methods are leading to a reduction in production costs and an improvement in product quality. Consumer preference for natural, plant-derived supplements is a key driver for this market segment, further solidifying its place within the health and wellness industry. Competitive dynamics are shaped by a combination of factors: price competition, product differentiation, and strategic partnerships. Market penetration is currently relatively low, indicating substantial untapped potential for future growth, especially within the global health and wellness market. The CAGR during the forecast period (2025-2033) is projected to be xx%, reflecting the strong growth trajectory of the market. Significant opportunities exist for expansion into new geographical regions, particularly in developing economies with rising disposable incomes and an increasing interest in health supplements.
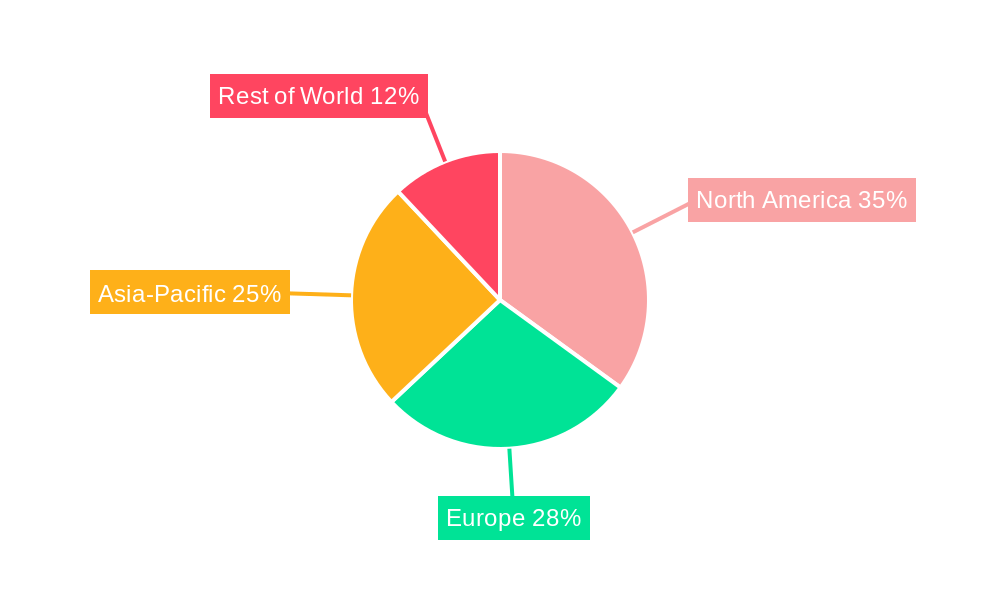
Dominant Markets & Segments in Urolithin A
The North American region currently holds a dominant position in the Urolithin A market. This dominance is primarily attributed to factors such as high consumer awareness of health benefits, strong regulatory frameworks that support the nutraceutical industry, and well-established distribution networks. However, other regions, including Europe and Asia-Pacific, are expected to witness significant growth in the coming years, driven by increasing disposable incomes, rising healthcare expenditure, and growing acceptance of natural health products.
- Key Drivers of North American Dominance:
- High consumer awareness of health benefits.
- Strong regulatory frameworks supporting the nutraceutical industry.
- Established distribution networks.
- Growth in Other Regions: Europe and Asia-Pacific are experiencing significant growth due to increased disposable income, healthcare expenditure and acceptance of natural health products.
Urolithin A Product Developments
Recent product innovations focus on improving the bioavailability and efficacy of Urolithin A through different delivery systems like microencapsulation and targeted delivery formulations. This allows for enhanced absorption and improved therapeutic effects. Urolithin A's application continues to expand, moving beyond its initial focus on anti-aging and mitochondrial health to include exploration of its potential benefits across various health conditions. The main competitive advantage lies in achieving higher purity, better stability, and enhanced bioavailability, resulting in superior efficacy compared to competitor products. The current technological trend is toward sustainable and cost-effective production methods, ensuring wider accessibility and affordability.
Report Scope & Segmentation Analysis
The report segments the Urolithin A market based on several criteria, including product type, application, and geography. Each segment offers unique growth opportunities and competitive dynamics. For example, the application segment is further divided into categories such as dietary supplements, functional foods, and pharmaceuticals. The geographical segmentation provides detailed analysis of regional markets, highlighting market size and growth potential for each region. Specific growth projections and competitive landscapes are detailed for each segment within the complete report.
Key Drivers of Urolithin A Growth
The Urolithin A market is driven by several key factors. Technological advancements in production methods are reducing costs and improving product quality. Scientific evidence supporting its health benefits is bolstering consumer trust and demand. The increasing prevalence of age-related diseases is fueling demand for anti-aging solutions. Finally, supportive regulatory environments in many key markets are facilitating market growth and innovation. Further growth is expected as additional research emerges, supporting its efficacy in a wider array of health-related areas.
Challenges in the Urolithin A Sector
The Urolithin A sector faces several challenges. Maintaining consistent product quality and purity can be difficult due to variations in production methods and raw materials. Ensuring sufficient supply to meet growing demand requires efficient and sustainable production scaling. The regulatory landscape is still evolving, presenting ongoing compliance challenges. Finally, competition from other anti-aging and health supplements could pose a threat to market growth. These challenges represent significant considerations for both existing and prospective market entrants.
Emerging Opportunities in Urolithin A
Emerging opportunities exist in expanding into new geographic markets, particularly in developing economies. The development of novel delivery systems (e.g., topical applications) can further enhance market growth. Collaborative research efforts to explore its efficacy in various health conditions (beyond anti-aging) could unlock new application areas. Finally, strategic partnerships with established players in the health and wellness industry can accelerate market penetration and expand distribution channels. Capitalizing on these opportunities is critical for market players to achieve long-term success.
Leading Players in the Urolithin A Market
- Daicel
- Suzhou Myland Pharm & Nutrition Inc.
- Shenzhen Hygieia Biotech Co., Ltd
- Wuhan Senwayer Century Chemical Co., Ltd
- Henan Chenli Biotechnology Co., LTD.
- Wuhan Hengheda Pharm Co., Ltd
- Shaanxi Dideu Medichem Co. Ltd
- Shenyang Hongjiuzhou Chemical Co., Ltd.
- Shandong Airuike Chemical Co., Ltd.
- LEADER BIOCHEMICAL GROUP
- Cofttek
- Fengchen Group Co., Ltd
- Natural Micron Chem Tech Co., Ltd.
- Dalian Handom Chemicals Co., Ltd
Key Developments in Urolithin A Industry
- 2022 Q4: Company X launches a new Urolithin A supplement with enhanced bioavailability.
- 2023 Q1: Major clinical trial results supporting the health benefits of Urolithin A are published.
- 2023 Q3: Two leading companies announce a strategic partnership to co-develop a novel Urolithin A delivery system.
- 2024 Q2: A new regulatory approval is granted for Urolithin A in a key market. (Further updates will be added with specific years and months as they occur.)
Strategic Outlook for Urolithin A Market
The Urolithin A market is poised for significant growth over the next decade. Continued scientific validation, coupled with increased consumer awareness and demand for natural health supplements, will drive market expansion. Strategic investments in R&D, efficient production scaling, and innovative marketing strategies will be essential for companies to capitalize on the market's vast potential. The focus on developing novel delivery systems and exploring its efficacy across multiple therapeutic areas will shape the future of the Urolithin A market.
Urolithin A Segmentation
-
1. Application
- 1.1. Food Additives
- 1.2. Cosmetics
- 1.3. Drugs and Supplements
- 1.4. Others
-
2. Types
- 2.1. Purity: >98%
- 2.2. Purity: >99%
- 2.3. Others
Urolithin A Segmentation By Geography
-
1. North America
- 1.1. United States
- 1.2. Canada
- 1.3. Mexico
-
2. South America
- 2.1. Brazil
- 2.2. Argentina
- 2.3. Rest of South America
-
3. Europe
- 3.1. United Kingdom
- 3.2. Germany
- 3.3. France
- 3.4. Italy
- 3.5. Spain
- 3.6. Russia
- 3.7. Benelux
- 3.8. Nordics
- 3.9. Rest of Europe
-
4. Middle East & Africa
- 4.1. Turkey
- 4.2. Israel
- 4.3. GCC
- 4.4. North Africa
- 4.5. South Africa
- 4.6. Rest of Middle East & Africa
-
5. Asia Pacific
- 5.1. China
- 5.2. India
- 5.3. Japan
- 5.4. South Korea
- 5.5. ASEAN
- 5.6. Oceania
- 5.7. Rest of Asia Pacific
Urolithin A Regional Market Share
Geographic Coverage of Urolithin A
Urolithin A REPORT HIGHLIGHTS
| Aspects | Details |
|---|---|
| Study Period | 2020-2034 |
| Base Year | 2025 |
| Estimated Year | 2026 |
| Forecast Period | 2026-2034 |
| Historical Period | 2020-2025 |
| Growth Rate | CAGR of 6.1% from 2020-2034 |
| Segmentation |
|
Table of Contents
- 1. Introduction
- 1.1. Research Scope
- 1.2. Market Segmentation
- 1.3. Research Objective
- 1.4. Definitions and Assumptions
- 2. Executive Summary
- 2.1. Market Snapshot
- 3. Market Dynamics
- 3.1. Market Drivers
- 3.2. Market Restrains
- 3.3. Market Trends
- 3.4. Market Opportunities
- 4. Market Factor Analysis
- 4.1. Porters Five Forces
- 4.1.1. Bargaining Power of Suppliers
- 4.1.2. Bargaining Power of Buyers
- 4.1.3. Threat of New Entrants
- 4.1.4. Threat of Substitutes
- 4.1.5. Competitive Rivalry
- 4.2. PESTEL analysis
- 4.3. BCG Analysis
- 4.3.1. Stars (High Growth, High Market Share)
- 4.3.2. Cash Cows (Low Growth, High Market Share)
- 4.3.3. Question Mark (High Growth, Low Market Share)
- 4.3.4. Dogs (Low Growth, Low Market Share)
- 4.4. Ansoff Matrix Analysis
- 4.5. Supply Chain Analysis
- 4.6. Regulatory Landscape
- 4.7. Current Market Potential and Opportunity Assessment (TAM–SAM–SOM Framework)
- 4.8. RAX Analyst Note
- 4.1. Porters Five Forces
- 5. Market Analysis, Insights and Forecast 2021-2033
- 5.1. Market Analysis, Insights and Forecast - by Application
- 5.1.1. Food Additives
- 5.1.2. Cosmetics
- 5.1.3. Drugs and Supplements
- 5.1.4. Others
- 5.2. Market Analysis, Insights and Forecast - by Types
- 5.2.1. Purity: >98%
- 5.2.2. Purity: >99%
- 5.2.3. Others
- 5.3. Market Analysis, Insights and Forecast - by Region
- 5.3.1. North America
- 5.3.2. South America
- 5.3.3. Europe
- 5.3.4. Middle East & Africa
- 5.3.5. Asia Pacific
- 5.1. Market Analysis, Insights and Forecast - by Application
- 6. Global Urolithin A Analysis, Insights and Forecast, 2021-2033
- 6.1. Market Analysis, Insights and Forecast - by Application
- 6.1.1. Food Additives
- 6.1.2. Cosmetics
- 6.1.3. Drugs and Supplements
- 6.1.4. Others
- 6.2. Market Analysis, Insights and Forecast - by Types
- 6.2.1. Purity: >98%
- 6.2.2. Purity: >99%
- 6.2.3. Others
- 6.1. Market Analysis, Insights and Forecast - by Application
- 7. North America Urolithin A Analysis, Insights and Forecast, 2020-2032
- 7.1. Market Analysis, Insights and Forecast - by Application
- 7.1.1. Food Additives
- 7.1.2. Cosmetics
- 7.1.3. Drugs and Supplements
- 7.1.4. Others
- 7.2. Market Analysis, Insights and Forecast - by Types
- 7.2.1. Purity: >98%
- 7.2.2. Purity: >99%
- 7.2.3. Others
- 7.1. Market Analysis, Insights and Forecast - by Application
- 8. South America Urolithin A Analysis, Insights and Forecast, 2020-2032
- 8.1. Market Analysis, Insights and Forecast - by Application
- 8.1.1. Food Additives
- 8.1.2. Cosmetics
- 8.1.3. Drugs and Supplements
- 8.1.4. Others
- 8.2. Market Analysis, Insights and Forecast - by Types
- 8.2.1. Purity: >98%
- 8.2.2. Purity: >99%
- 8.2.3. Others
- 8.1. Market Analysis, Insights and Forecast - by Application
- 9. Europe Urolithin A Analysis, Insights and Forecast, 2020-2032
- 9.1. Market Analysis, Insights and Forecast - by Application
- 9.1.1. Food Additives
- 9.1.2. Cosmetics
- 9.1.3. Drugs and Supplements
- 9.1.4. Others
- 9.2. Market Analysis, Insights and Forecast - by Types
- 9.2.1. Purity: >98%
- 9.2.2. Purity: >99%
- 9.2.3. Others
- 9.1. Market Analysis, Insights and Forecast - by Application
- 10. Middle East & Africa Urolithin A Analysis, Insights and Forecast, 2020-2032
- 10.1. Market Analysis, Insights and Forecast - by Application
- 10.1.1. Food Additives
- 10.1.2. Cosmetics
- 10.1.3. Drugs and Supplements
- 10.1.4. Others
- 10.2. Market Analysis, Insights and Forecast - by Types
- 10.2.1. Purity: >98%
- 10.2.2. Purity: >99%
- 10.2.3. Others
- 10.1. Market Analysis, Insights and Forecast - by Application
- 11. Asia Pacific Urolithin A Analysis, Insights and Forecast, 2020-2032
- 11.1. Market Analysis, Insights and Forecast - by Application
- 11.1.1. Food Additives
- 11.1.2. Cosmetics
- 11.1.3. Drugs and Supplements
- 11.1.4. Others
- 11.2. Market Analysis, Insights and Forecast - by Types
- 11.2.1. Purity: >98%
- 11.2.2. Purity: >99%
- 11.2.3. Others
- 11.1. Market Analysis, Insights and Forecast - by Application
- 12. Competitive Analysis
- 12.1. Company Profiles
- 12.1.1 Daicel
- 12.1.1.1. Company Overview
- 12.1.1.2. Products
- 12.1.1.3. Company Financials
- 12.1.1.4. SWOT Analysis
- 12.1.2 Suzhou Myland Pharm & Nutrition Inc.
- 12.1.2.1. Company Overview
- 12.1.2.2. Products
- 12.1.2.3. Company Financials
- 12.1.2.4. SWOT Analysis
- 12.1.3 Shenzhen Hygieia Biotech Co.
- 12.1.3.1. Company Overview
- 12.1.3.2. Products
- 12.1.3.3. Company Financials
- 12.1.3.4. SWOT Analysis
- 12.1.4 Ltd
- 12.1.4.1. Company Overview
- 12.1.4.2. Products
- 12.1.4.3. Company Financials
- 12.1.4.4. SWOT Analysis
- 12.1.5 Wuhan Senwayer Century Chemical Co.
- 12.1.5.1. Company Overview
- 12.1.5.2. Products
- 12.1.5.3. Company Financials
- 12.1.5.4. SWOT Analysis
- 12.1.6 Ltd
- 12.1.6.1. Company Overview
- 12.1.6.2. Products
- 12.1.6.3. Company Financials
- 12.1.6.4. SWOT Analysis
- 12.1.7 Henan Chenli Biotechnology Co.
- 12.1.7.1. Company Overview
- 12.1.7.2. Products
- 12.1.7.3. Company Financials
- 12.1.7.4. SWOT Analysis
- 12.1.8 LTD.
- 12.1.8.1. Company Overview
- 12.1.8.2. Products
- 12.1.8.3. Company Financials
- 12.1.8.4. SWOT Analysis
- 12.1.9 Wuhan Hengheda Pharm Co.
- 12.1.9.1. Company Overview
- 12.1.9.2. Products
- 12.1.9.3. Company Financials
- 12.1.9.4. SWOT Analysis
- 12.1.10 Ltd
- 12.1.10.1. Company Overview
- 12.1.10.2. Products
- 12.1.10.3. Company Financials
- 12.1.10.4. SWOT Analysis
- 12.1.11 Shaanxi Dideu Medichem Co. Ltd
- 12.1.11.1. Company Overview
- 12.1.11.2. Products
- 12.1.11.3. Company Financials
- 12.1.11.4. SWOT Analysis
- 12.1.12 Shenyang Hongjiuzhou Chemical Co.
- 12.1.12.1. Company Overview
- 12.1.12.2. Products
- 12.1.12.3. Company Financials
- 12.1.12.4. SWOT Analysis
- 12.1.13 Ltd.
- 12.1.13.1. Company Overview
- 12.1.13.2. Products
- 12.1.13.3. Company Financials
- 12.1.13.4. SWOT Analysis
- 12.1.14 Shandong Airuike Chemical Co.
- 12.1.14.1. Company Overview
- 12.1.14.2. Products
- 12.1.14.3. Company Financials
- 12.1.14.4. SWOT Analysis
- 12.1.15 Ltd.
- 12.1.15.1. Company Overview
- 12.1.15.2. Products
- 12.1.15.3. Company Financials
- 12.1.15.4. SWOT Analysis
- 12.1.16 LEADER BIOCHEMICAL GROUP
- 12.1.16.1. Company Overview
- 12.1.16.2. Products
- 12.1.16.3. Company Financials
- 12.1.16.4. SWOT Analysis
- 12.1.17 Cofttek
- 12.1.17.1. Company Overview
- 12.1.17.2. Products
- 12.1.17.3. Company Financials
- 12.1.17.4. SWOT Analysis
- 12.1.18 Fengchen Group Co.
- 12.1.18.1. Company Overview
- 12.1.18.2. Products
- 12.1.18.3. Company Financials
- 12.1.18.4. SWOT Analysis
- 12.1.19 Ltd
- 12.1.19.1. Company Overview
- 12.1.19.2. Products
- 12.1.19.3. Company Financials
- 12.1.19.4. SWOT Analysis
- 12.1.20 Natural Micron Chem Tech Co.
- 12.1.20.1. Company Overview
- 12.1.20.2. Products
- 12.1.20.3. Company Financials
- 12.1.20.4. SWOT Analysis
- 12.1.21 Ltd.
- 12.1.21.1. Company Overview
- 12.1.21.2. Products
- 12.1.21.3. Company Financials
- 12.1.21.4. SWOT Analysis
- 12.1.22 Dalian Handom Chemicals Co.
- 12.1.22.1. Company Overview
- 12.1.22.2. Products
- 12.1.22.3. Company Financials
- 12.1.22.4. SWOT Analysis
- 12.1.23 Ltd
- 12.1.23.1. Company Overview
- 12.1.23.2. Products
- 12.1.23.3. Company Financials
- 12.1.23.4. SWOT Analysis
- 12.1.1 Daicel
- 12.2. Market Entropy
- 12.2.1 Company's Key Areas Served
- 12.2.2 Recent Developments
- 12.3. Company Market Share Analysis 2025
- 12.3.1 Top 5 Companies Market Share Analysis
- 12.3.2 Top 3 Companies Market Share Analysis
- 12.4. List of Potential Customers
- 13. Research Methodology
List of Figures
- Figure 1: Global Urolithin A Revenue Breakdown (million, %) by Region 2025 & 2033
- Figure 2: Global Urolithin A Volume Breakdown (K, %) by Region 2025 & 2033
- Figure 3: North America Urolithin A Revenue (million), by Application 2025 & 2033
- Figure 4: North America Urolithin A Volume (K), by Application 2025 & 2033
- Figure 5: North America Urolithin A Revenue Share (%), by Application 2025 & 2033
- Figure 6: North America Urolithin A Volume Share (%), by Application 2025 & 2033
- Figure 7: North America Urolithin A Revenue (million), by Types 2025 & 2033
- Figure 8: North America Urolithin A Volume (K), by Types 2025 & 2033
- Figure 9: North America Urolithin A Revenue Share (%), by Types 2025 & 2033
- Figure 10: North America Urolithin A Volume Share (%), by Types 2025 & 2033
- Figure 11: North America Urolithin A Revenue (million), by Country 2025 & 2033
- Figure 12: North America Urolithin A Volume (K), by Country 2025 & 2033
- Figure 13: North America Urolithin A Revenue Share (%), by Country 2025 & 2033
- Figure 14: North America Urolithin A Volume Share (%), by Country 2025 & 2033
- Figure 15: South America Urolithin A Revenue (million), by Application 2025 & 2033
- Figure 16: South America Urolithin A Volume (K), by Application 2025 & 2033
- Figure 17: South America Urolithin A Revenue Share (%), by Application 2025 & 2033
- Figure 18: South America Urolithin A Volume Share (%), by Application 2025 & 2033
- Figure 19: South America Urolithin A Revenue (million), by Types 2025 & 2033
- Figure 20: South America Urolithin A Volume (K), by Types 2025 & 2033
- Figure 21: South America Urolithin A Revenue Share (%), by Types 2025 & 2033
- Figure 22: South America Urolithin A Volume Share (%), by Types 2025 & 2033
- Figure 23: South America Urolithin A Revenue (million), by Country 2025 & 2033
- Figure 24: South America Urolithin A Volume (K), by Country 2025 & 2033
- Figure 25: South America Urolithin A Revenue Share (%), by Country 2025 & 2033
- Figure 26: South America Urolithin A Volume Share (%), by Country 2025 & 2033
- Figure 27: Europe Urolithin A Revenue (million), by Application 2025 & 2033
- Figure 28: Europe Urolithin A Volume (K), by Application 2025 & 2033
- Figure 29: Europe Urolithin A Revenue Share (%), by Application 2025 & 2033
- Figure 30: Europe Urolithin A Volume Share (%), by Application 2025 & 2033
- Figure 31: Europe Urolithin A Revenue (million), by Types 2025 & 2033
- Figure 32: Europe Urolithin A Volume (K), by Types 2025 & 2033
- Figure 33: Europe Urolithin A Revenue Share (%), by Types 2025 & 2033
- Figure 34: Europe Urolithin A Volume Share (%), by Types 2025 & 2033
- Figure 35: Europe Urolithin A Revenue (million), by Country 2025 & 2033
- Figure 36: Europe Urolithin A Volume (K), by Country 2025 & 2033
- Figure 37: Europe Urolithin A Revenue Share (%), by Country 2025 & 2033
- Figure 38: Europe Urolithin A Volume Share (%), by Country 2025 & 2033
- Figure 39: Middle East & Africa Urolithin A Revenue (million), by Application 2025 & 2033
- Figure 40: Middle East & Africa Urolithin A Volume (K), by Application 2025 & 2033
- Figure 41: Middle East & Africa Urolithin A Revenue Share (%), by Application 2025 & 2033
- Figure 42: Middle East & Africa Urolithin A Volume Share (%), by Application 2025 & 2033
- Figure 43: Middle East & Africa Urolithin A Revenue (million), by Types 2025 & 2033
- Figure 44: Middle East & Africa Urolithin A Volume (K), by Types 2025 & 2033
- Figure 45: Middle East & Africa Urolithin A Revenue Share (%), by Types 2025 & 2033
- Figure 46: Middle East & Africa Urolithin A Volume Share (%), by Types 2025 & 2033
- Figure 47: Middle East & Africa Urolithin A Revenue (million), by Country 2025 & 2033
- Figure 48: Middle East & Africa Urolithin A Volume (K), by Country 2025 & 2033
- Figure 49: Middle East & Africa Urolithin A Revenue Share (%), by Country 2025 & 2033
- Figure 50: Middle East & Africa Urolithin A Volume Share (%), by Country 2025 & 2033
- Figure 51: Asia Pacific Urolithin A Revenue (million), by Application 2025 & 2033
- Figure 52: Asia Pacific Urolithin A Volume (K), by Application 2025 & 2033
- Figure 53: Asia Pacific Urolithin A Revenue Share (%), by Application 2025 & 2033
- Figure 54: Asia Pacific Urolithin A Volume Share (%), by Application 2025 & 2033
- Figure 55: Asia Pacific Urolithin A Revenue (million), by Types 2025 & 2033
- Figure 56: Asia Pacific Urolithin A Volume (K), by Types 2025 & 2033
- Figure 57: Asia Pacific Urolithin A Revenue Share (%), by Types 2025 & 2033
- Figure 58: Asia Pacific Urolithin A Volume Share (%), by Types 2025 & 2033
- Figure 59: Asia Pacific Urolithin A Revenue (million), by Country 2025 & 2033
- Figure 60: Asia Pacific Urolithin A Volume (K), by Country 2025 & 2033
- Figure 61: Asia Pacific Urolithin A Revenue Share (%), by Country 2025 & 2033
- Figure 62: Asia Pacific Urolithin A Volume Share (%), by Country 2025 & 2033
List of Tables
- Table 1: Global Urolithin A Revenue million Forecast, by Application 2020 & 2033
- Table 2: Global Urolithin A Volume K Forecast, by Application 2020 & 2033
- Table 3: Global Urolithin A Revenue million Forecast, by Types 2020 & 2033
- Table 4: Global Urolithin A Volume K Forecast, by Types 2020 & 2033
- Table 5: Global Urolithin A Revenue million Forecast, by Region 2020 & 2033
- Table 6: Global Urolithin A Volume K Forecast, by Region 2020 & 2033
- Table 7: Global Urolithin A Revenue million Forecast, by Application 2020 & 2033
- Table 8: Global Urolithin A Volume K Forecast, by Application 2020 & 2033
- Table 9: Global Urolithin A Revenue million Forecast, by Types 2020 & 2033
- Table 10: Global Urolithin A Volume K Forecast, by Types 2020 & 2033
- Table 11: Global Urolithin A Revenue million Forecast, by Country 2020 & 2033
- Table 12: Global Urolithin A Volume K Forecast, by Country 2020 & 2033
- Table 13: United States Urolithin A Revenue (million) Forecast, by Application 2020 & 2033
- Table 14: United States Urolithin A Volume (K) Forecast, by Application 2020 & 2033
- Table 15: Canada Urolithin A Revenue (million) Forecast, by Application 2020 & 2033
- Table 16: Canada Urolithin A Volume (K) Forecast, by Application 2020 & 2033
- Table 17: Mexico Urolithin A Revenue (million) Forecast, by Application 2020 & 2033
- Table 18: Mexico Urolithin A Volume (K) Forecast, by Application 2020 & 2033
- Table 19: Global Urolithin A Revenue million Forecast, by Application 2020 & 2033
- Table 20: Global Urolithin A Volume K Forecast, by Application 2020 & 2033
- Table 21: Global Urolithin A Revenue million Forecast, by Types 2020 & 2033
- Table 22: Global Urolithin A Volume K Forecast, by Types 2020 & 2033
- Table 23: Global Urolithin A Revenue million Forecast, by Country 2020 & 2033
- Table 24: Global Urolithin A Volume K Forecast, by Country 2020 & 2033
- Table 25: Brazil Urolithin A Revenue (million) Forecast, by Application 2020 & 2033
- Table 26: Brazil Urolithin A Volume (K) Forecast, by Application 2020 & 2033
- Table 27: Argentina Urolithin A Revenue (million) Forecast, by Application 2020 & 2033
- Table 28: Argentina Urolithin A Volume (K) Forecast, by Application 2020 & 2033
- Table 29: Rest of South America Urolithin A Revenue (million) Forecast, by Application 2020 & 2033
- Table 30: Rest of South America Urolithin A Volume (K) Forecast, by Application 2020 & 2033
- Table 31: Global Urolithin A Revenue million Forecast, by Application 2020 & 2033
- Table 32: Global Urolithin A Volume K Forecast, by Application 2020 & 2033
- Table 33: Global Urolithin A Revenue million Forecast, by Types 2020 & 2033
- Table 34: Global Urolithin A Volume K Forecast, by Types 2020 & 2033
- Table 35: Global Urolithin A Revenue million Forecast, by Country 2020 & 2033
- Table 36: Global Urolithin A Volume K Forecast, by Country 2020 & 2033
- Table 37: United Kingdom Urolithin A Revenue (million) Forecast, by Application 2020 & 2033
- Table 38: United Kingdom Urolithin A Volume (K) Forecast, by Application 2020 & 2033
- Table 39: Germany Urolithin A Revenue (million) Forecast, by Application 2020 & 2033
- Table 40: Germany Urolithin A Volume (K) Forecast, by Application 2020 & 2033
- Table 41: France Urolithin A Revenue (million) Forecast, by Application 2020 & 2033
- Table 42: France Urolithin A Volume (K) Forecast, by Application 2020 & 2033
- Table 43: Italy Urolithin A Revenue (million) Forecast, by Application 2020 & 2033
- Table 44: Italy Urolithin A Volume (K) Forecast, by Application 2020 & 2033
- Table 45: Spain Urolithin A Revenue (million) Forecast, by Application 2020 & 2033
- Table 46: Spain Urolithin A Volume (K) Forecast, by Application 2020 & 2033
- Table 47: Russia Urolithin A Revenue (million) Forecast, by Application 2020 & 2033
- Table 48: Russia Urolithin A Volume (K) Forecast, by Application 2020 & 2033
- Table 49: Benelux Urolithin A Revenue (million) Forecast, by Application 2020 & 2033
- Table 50: Benelux Urolithin A Volume (K) Forecast, by Application 2020 & 2033
- Table 51: Nordics Urolithin A Revenue (million) Forecast, by Application 2020 & 2033
- Table 52: Nordics Urolithin A Volume (K) Forecast, by Application 2020 & 2033
- Table 53: Rest of Europe Urolithin A Revenue (million) Forecast, by Application 2020 & 2033
- Table 54: Rest of Europe Urolithin A Volume (K) Forecast, by Application 2020 & 2033
- Table 55: Global Urolithin A Revenue million Forecast, by Application 2020 & 2033
- Table 56: Global Urolithin A Volume K Forecast, by Application 2020 & 2033
- Table 57: Global Urolithin A Revenue million Forecast, by Types 2020 & 2033
- Table 58: Global Urolithin A Volume K Forecast, by Types 2020 & 2033
- Table 59: Global Urolithin A Revenue million Forecast, by Country 2020 & 2033
- Table 60: Global Urolithin A Volume K Forecast, by Country 2020 & 2033
- Table 61: Turkey Urolithin A Revenue (million) Forecast, by Application 2020 & 2033
- Table 62: Turkey Urolithin A Volume (K) Forecast, by Application 2020 & 2033
- Table 63: Israel Urolithin A Revenue (million) Forecast, by Application 2020 & 2033
- Table 64: Israel Urolithin A Volume (K) Forecast, by Application 2020 & 2033
- Table 65: GCC Urolithin A Revenue (million) Forecast, by Application 2020 & 2033
- Table 66: GCC Urolithin A Volume (K) Forecast, by Application 2020 & 2033
- Table 67: North Africa Urolithin A Revenue (million) Forecast, by Application 2020 & 2033
- Table 68: North Africa Urolithin A Volume (K) Forecast, by Application 2020 & 2033
- Table 69: South Africa Urolithin A Revenue (million) Forecast, by Application 2020 & 2033
- Table 70: South Africa Urolithin A Volume (K) Forecast, by Application 2020 & 2033
- Table 71: Rest of Middle East & Africa Urolithin A Revenue (million) Forecast, by Application 2020 & 2033
- Table 72: Rest of Middle East & Africa Urolithin A Volume (K) Forecast, by Application 2020 & 2033
- Table 73: Global Urolithin A Revenue million Forecast, by Application 2020 & 2033
- Table 74: Global Urolithin A Volume K Forecast, by Application 2020 & 2033
- Table 75: Global Urolithin A Revenue million Forecast, by Types 2020 & 2033
- Table 76: Global Urolithin A Volume K Forecast, by Types 2020 & 2033
- Table 77: Global Urolithin A Revenue million Forecast, by Country 2020 & 2033
- Table 78: Global Urolithin A Volume K Forecast, by Country 2020 & 2033
- Table 79: China Urolithin A Revenue (million) Forecast, by Application 2020 & 2033
- Table 80: China Urolithin A Volume (K) Forecast, by Application 2020 & 2033
- Table 81: India Urolithin A Revenue (million) Forecast, by Application 2020 & 2033
- Table 82: India Urolithin A Volume (K) Forecast, by Application 2020 & 2033
- Table 83: Japan Urolithin A Revenue (million) Forecast, by Application 2020 & 2033
- Table 84: Japan Urolithin A Volume (K) Forecast, by Application 2020 & 2033
- Table 85: South Korea Urolithin A Revenue (million) Forecast, by Application 2020 & 2033
- Table 86: South Korea Urolithin A Volume (K) Forecast, by Application 2020 & 2033
- Table 87: ASEAN Urolithin A Revenue (million) Forecast, by Application 2020 & 2033
- Table 88: ASEAN Urolithin A Volume (K) Forecast, by Application 2020 & 2033
- Table 89: Oceania Urolithin A Revenue (million) Forecast, by Application 2020 & 2033
- Table 90: Oceania Urolithin A Volume (K) Forecast, by Application 2020 & 2033
- Table 91: Rest of Asia Pacific Urolithin A Revenue (million) Forecast, by Application 2020 & 2033
- Table 92: Rest of Asia Pacific Urolithin A Volume (K) Forecast, by Application 2020 & 2033
Frequently Asked Questions
1. What is the projected Compound Annual Growth Rate (CAGR) of the Urolithin A?
The projected CAGR is approximately 6.1%.
2. Which companies are prominent players in the Urolithin A?
Key companies in the market include Daicel, Suzhou Myland Pharm & Nutrition Inc., Shenzhen Hygieia Biotech Co., Ltd, Wuhan Senwayer Century Chemical Co., Ltd, Henan Chenli Biotechnology Co., LTD., Wuhan Hengheda Pharm Co., Ltd, Shaanxi Dideu Medichem Co. Ltd, Shenyang Hongjiuzhou Chemical Co., Ltd., Shandong Airuike Chemical Co., Ltd., LEADER BIOCHEMICAL GROUP, Cofttek, Fengchen Group Co., Ltd, Natural Micron Chem Tech Co., Ltd., Dalian Handom Chemicals Co., Ltd.
3. What are the main segments of the Urolithin A?
The market segments include Application, Types.
4. Can you provide details about the market size?
The market size is estimated to be USD 39.4 million as of 2022.
5. What are some drivers contributing to market growth?
N/A
6. What are the notable trends driving market growth?
N/A
7. Are there any restraints impacting market growth?
N/A
8. Can you provide examples of recent developments in the market?
N/A
9. What pricing options are available for accessing the report?
Pricing options include single-user, multi-user, and enterprise licenses priced at USD 4350.00, USD 6525.00, and USD 8700.00 respectively.
10. Is the market size provided in terms of value or volume?
The market size is provided in terms of value, measured in million and volume, measured in K.
11. Are there any specific market keywords associated with the report?
Yes, the market keyword associated with the report is "Urolithin A," which aids in identifying and referencing the specific market segment covered.
12. How do I determine which pricing option suits my needs best?
The pricing options vary based on user requirements and access needs. Individual users may opt for single-user licenses, while businesses requiring broader access may choose multi-user or enterprise licenses for cost-effective access to the report.
13. Are there any additional resources or data provided in the Urolithin A report?
While the report offers comprehensive insights, it's advisable to review the specific contents or supplementary materials provided to ascertain if additional resources or data are available.
14. How can I stay updated on further developments or reports in the Urolithin A?
To stay informed about further developments, trends, and reports in the Urolithin A, consider subscribing to industry newsletters, following relevant companies and organizations, or regularly checking reputable industry news sources and publications.
Methodology
Step 1 - Identification of Relevant Samples Size from Population Database


Step 2 - Approaches for Defining Global Market Size (Value, Volume* & Price*)

Note*: In applicable scenarios
Step 3 - Data Sources
Primary Research
- Web Analytics
- Survey Reports
- Research Institute
- Latest Research Reports
- Opinion Leaders
Secondary Research
- Annual Reports
- White Paper
- Latest Press Release
- Industry Association
- Paid Database
- Investor Presentations

Step 4 - Data Triangulation
Involves using different sources of information in order to increase the validity of a study
These sources are likely to be stakeholders in a program - participants, other researchers, program staff, other community members, and so on.
Then we put all data in single framework & apply various statistical tools to find out the dynamic on the market.
During the analysis stage, feedback from the stakeholder groups would be compared to determine areas of agreement as well as areas of divergence