

Key Insights
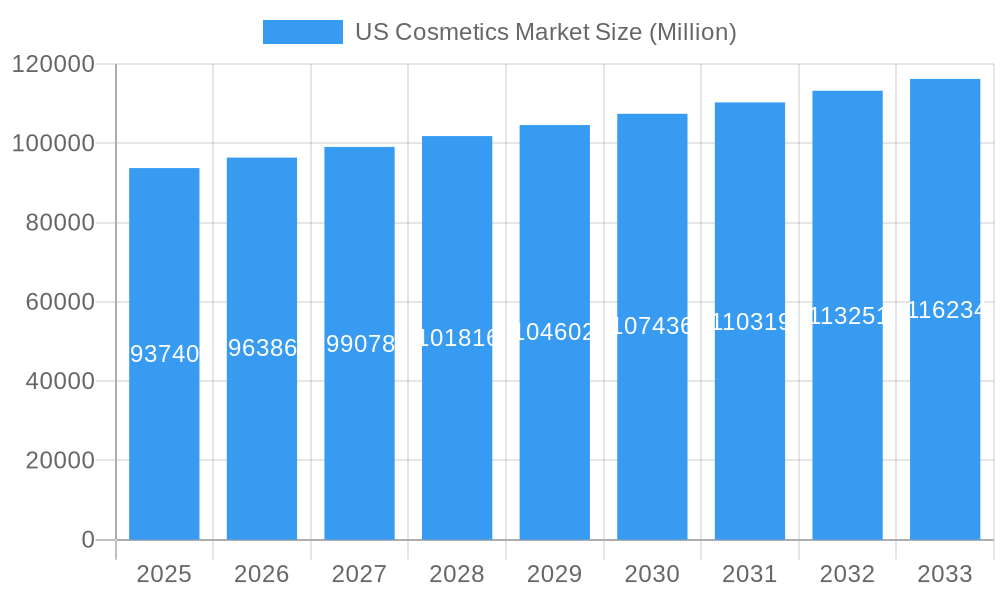
The US cosmetics market, valued at approximately $93.74 billion in 2025, is projected to experience steady growth, driven by several key factors. The increasing disposable income of consumers, coupled with a rising awareness of personal care and beauty trends, fuels demand for a wide range of products, from premium skincare and makeup to mass-market hair care options. E-commerce channels are significantly contributing to market expansion, offering convenience and broader product access. The market's segmentation reflects diverse consumer preferences, with premium products catering to the high-end segment and mass products appealing to a broader consumer base. The presence of established global players like L'Oréal, Estée Lauder, and Unilever, alongside emerging brands, creates a dynamic and competitive landscape. Furthermore, the increasing focus on natural and organic ingredients, along with personalized beauty solutions, are shaping consumer choices and influencing product innovation within the market. A notable restraint could be economic downturns impacting consumer spending on discretionary items like cosmetics. However, the market's inherent resilience and its adaptability to evolving consumer preferences suggest continued growth, although potentially at a moderated pace during economic uncertainties.
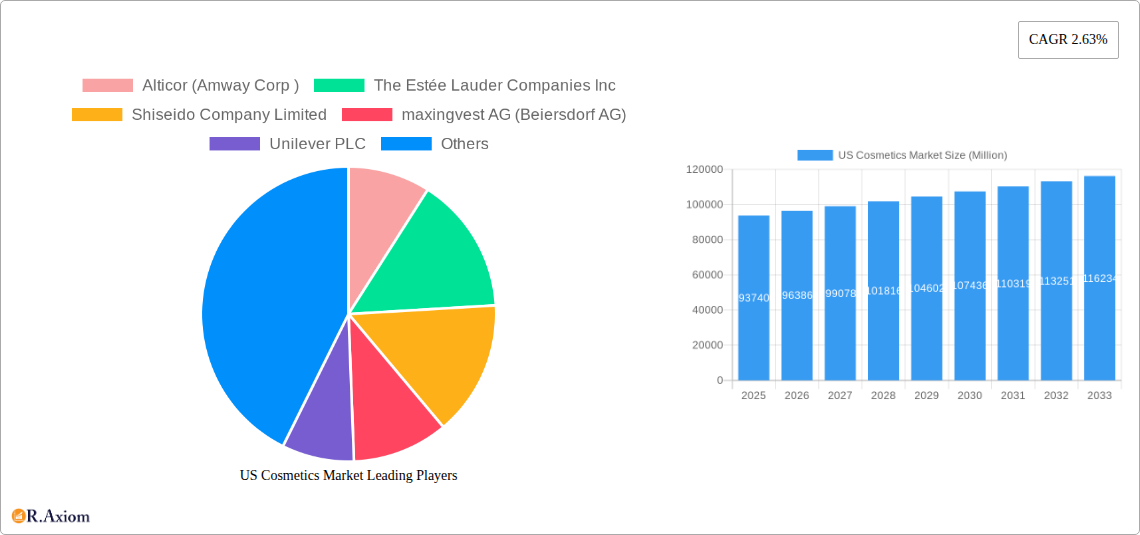
US Cosmetics Market Market Size (In Billion)
The projected Compound Annual Growth Rate (CAGR) of 2.63% suggests a consistent, albeit moderate, expansion of the US cosmetics market from 2025 to 2033. This growth trajectory is expected to be influenced by factors such as the continued popularity of online retail channels, innovative product development focusing on natural and sustainable ingredients, and the ongoing influence of social media marketing on beauty trends. The market's segmentation into product types (skincare, makeup, fragrances, hair care) and distribution channels (retail stores, e-commerce, direct-to-consumer) provides valuable insights into consumer purchasing behavior and the strategic approaches employed by market players. Competitive pressures from both established multinational corporations and smaller, niche brands will likely remain a significant factor shaping market dynamics throughout the forecast period. Maintaining brand loyalty, effectively adapting to evolving consumer preferences, and navigating economic fluctuations will be crucial for success in this dynamic market.
US Cosmetics Market Company Market Share
This in-depth report provides a comprehensive analysis of the US Cosmetics Market, covering the period 2019-2033. It offers invaluable insights for industry stakeholders, investors, and businesses looking to navigate this dynamic market. The report leverages rigorous data analysis and expert insights to provide actionable intelligence for strategic decision-making. With a focus on key segments, leading players, and emerging trends, this report is an essential resource for understanding and capitalizing on opportunities within the US cosmetics landscape.
US Cosmetics Market Concentration & Innovation
The US cosmetics market is characterized by a high degree of concentration, with a few major players holding significant market share. While precise market share figures for each company fluctuate yearly, L'Oréal, Estée Lauder, and Procter & Gamble consistently rank among the top players, commanding a combined xx% of the market in 2024. This concentration is driven by significant brand recognition, extensive distribution networks, and substantial R&D investments. However, the market also displays considerable innovation, fueled by consumer demand for natural, sustainable, and personalized products.
Key Innovation Drivers:
- Technological advancements: Artificial intelligence (AI) in personalized skincare recommendations, augmented reality (AR) for virtual try-ons, and sustainable packaging solutions are driving innovation.
- Consumer preferences: Growing demand for clean beauty, cruelty-free products, and inclusive product lines.
- Regulatory landscape: The increasing scrutiny of ingredient safety and labeling requirements necessitates continuous innovation in formulation and transparency.
Mergers & Acquisitions (M&A) Activity: The US cosmetics market has witnessed significant M&A activity in recent years, with larger companies acquiring smaller, specialized brands to expand their product portfolios and tap into emerging niches. Examples include Beiersdorf’s acquisition of Chantecaille Beauté Inc. (February 2022) and Unilever’s acquisition of Paula’s Choice (July 2021). The total value of M&A deals in the US cosmetics market from 2019-2024 is estimated at $xx Million.
Substitute Products: The market faces competition from skincare and beauty products offered by pharmacies, drugstores, and direct-to-consumer brands that are disrupting the traditional cosmetics market.
US Cosmetics Market Industry Trends & Insights
The US cosmetics market is experiencing robust growth, driven by several factors. Consumer spending on beauty and personal care products remains strong, particularly among millennials and Gen Z, who are digitally savvy and highly engaged with beauty influencers. The market's Compound Annual Growth Rate (CAGR) from 2019-2024 was approximately xx%, and it's projected to reach xx% from 2025-2033. E-commerce continues to gain market share, offering convenience and a wider selection of products. However, the market faces challenges such as economic downturns, increasing competition, and evolving consumer preferences. Technological disruptions such as personalized recommendations and virtual try-on experiences are transforming how consumers engage with cosmetic products.
Market penetration of premium products is consistently high, driven by consumers' willingness to pay for higher-quality formulations and brand prestige.
Dominant Markets & Segments in US Cosmetics Market
The US cosmetics market is geographically diverse, but specific regions exhibit higher demand. California, New York, and Florida consistently rank as leading markets due to higher population densities, disposable incomes, and a strong presence of major cosmetic brands.
Dominant Segments:
- Product Type: Skincare holds the largest market share, followed by makeup, fragrances, and hair care. The high demand for skincare is fueled by increasing awareness of the importance of sun protection and anti-aging products.
- Distribution Channel: E-commerce is rapidly gaining popularity, while retail stores continue to maintain a dominant presence. The convenience and wide product selection provided by e-commerce platforms are fueling the growth of this segment.
- Category: Premium products command a higher price point and profit margin, making it a lucrative segment. However, the mass market segment enjoys higher sales volumes due to its affordability and accessibility.
Key Drivers of Segment Dominance:
- Economic factors: Disposable income levels significantly impact consumer spending on cosmetics, particularly in premium segments.
- Infrastructure: Well-developed retail infrastructure and robust e-commerce logistics networks contribute to market growth.
- Cultural factors: Changing beauty standards and social media influence trends in specific product types and categories.
US Cosmetics Market Product Developments
Recent product innovations include personalized skincare formulations tailored to individual needs using AI and data analytics; sustainable and eco-friendly packaging options; and the growing trend towards clean beauty with natural and organic ingredients. The use of advanced technologies like AR/VR for virtual try-ons is improving the customer experience and driving sales. These advancements cater to the evolving consumer preferences for personalization, sustainability, and transparency.
Report Scope & Segmentation Analysis
This report segments the US cosmetics market by product type (skincare, makeup, fragrances, hair care), distribution channel (retail stores, e-commerce, direct-to-consumer), and category (premium products, mass products). Growth projections vary across segments, with skincare and e-commerce showing the strongest growth potential. Market sizes are estimated for each segment based on historical data and future projections, offering detailed competitive dynamics for each sub-sector.
Key Drivers of US Cosmetics Market Growth
The US cosmetics market’s growth is driven by several factors:
- Rising disposable incomes: Increased purchasing power enables consumers to spend more on beauty and personal care products.
- Growing awareness of skincare: The focus on health and wellness has increased demand for skincare products.
- E-commerce expansion: The convenience and vast selection offered by online platforms boost market growth.
Challenges in the US Cosmetics Market Sector
The US cosmetics market faces challenges including:
- Economic fluctuations: Recessions can impact consumer spending on discretionary items like cosmetics.
- Stringent regulations: Compliance with evolving safety and labeling regulations can be costly for businesses.
- Intense competition: The market is highly competitive, with established players and emerging brands vying for market share. This leads to price pressure and reduced profit margins for some players.
Emerging Opportunities in US Cosmetics Market
Emerging opportunities include:
- Personalized cosmetics: Tailored products based on individual skin types and needs.
- Sustainable and ethical products: Demand for eco-friendly and cruelty-free options is increasing.
- Expansion into niche markets: Targeting specific demographic groups with specialized products.
Leading Players in the US Cosmetics Market Market
Key Developments in US Cosmetics Market Industry
- July 2021: Unilever acquired Paula's Choice, expanding its digital skincare portfolio.
- February 2022: Beiersdorf acquired Chantecaille Beauté Inc., strengthening its premium skincare offerings.
- March 2022: Procter & Gamble launched Crest Densify, a premium toothpaste focusing on enamel remineralization.
Strategic Outlook for US Cosmetics Market Market
The US cosmetics market is poised for continued growth, driven by innovation, evolving consumer preferences, and the expansion of e-commerce. Opportunities exist for companies that embrace personalization, sustainability, and technological advancements. The market’s future depends on adapting to changing consumer demands and successfully navigating competitive pressures. A focus on digital marketing, personalized products, and sustainable practices will be crucial for success in the years to come.
US Cosmetics Market Segmentation
-
1. Product Type
-
1.1. Personal Care
-
1.1.1. Hair Care
- 1.1.1.1. Shampoo
- 1.1.1.2. Conditioner
- 1.1.1.3. Hair Oil
- 1.1.1.4. Hair Styling and Coloring Products
- 1.1.1.5. Other Hair Care Products
-
1.1.2. Skin Care
- 1.1.2.1. Facial Care
- 1.1.2.2. Body Care
- 1.1.2.3. Lip Care
-
1.1.3. Bath and Shower
- 1.1.3.1. Soaps
- 1.1.3.2. Shower Gels
- 1.1.3.3. Bath Salts
- 1.1.3.4. Bathing Accessories
- 1.1.3.5. Other Bath and Shower Products
-
1.1.4. Oral Care
- 1.1.4.1. Toothbrushes and Replacements
- 1.1.4.2. Toothpastes
- 1.1.4.3. Mouthwashes and Rinses
- 1.1.4.4. Other Oral Care Products
- 1.1.5. Men's Grooming
- 1.1.6. Deodrants and Antiperspirants
-
1.1.1. Hair Care
-
1.2. Beauty and Make-up/Cosmetics Market
-
1.2.1. Color Cosmetics
- 1.2.1.1. Facial Make-up Products
- 1.2.1.2. Eye Make-up Products
- 1.2.1.3. Lip and Nail Make-up Products
-
1.2.1. Color Cosmetics
-
1.1. Personal Care
-
2. Category
- 2.1. Premium Products
- 2.2. Mass Products
-
3. Distribution Channel
- 3.1. Specialist Retail Stores
- 3.2. Supermarkets/Hypermarkets
- 3.3. Convenience Stores
- 3.4. Pharmacies/Drug Stores
- 3.5. Online Retail Stores
- 3.6. Other Distribution Channels
US Cosmetics Market Segmentation By Geography
-
1. North America
- 1.1. United States
- 1.2. Canada
- 1.3. Mexico
-
2. South America
- 2.1. Brazil
- 2.2. Argentina
- 2.3. Rest of South America
-
3. Europe
- 3.1. United Kingdom
- 3.2. Germany
- 3.3. France
- 3.4. Italy
- 3.5. Spain
- 3.6. Russia
- 3.7. Benelux
- 3.8. Nordics
- 3.9. Rest of Europe
-
4. Middle East & Africa
- 4.1. Turkey
- 4.2. Israel
- 4.3. GCC
- 4.4. North Africa
- 4.5. South Africa
- 4.6. Rest of Middle East & Africa
-
5. Asia Pacific
- 5.1. China
- 5.2. India
- 5.3. Japan
- 5.4. South Korea
- 5.5. ASEAN
- 5.6. Oceania
- 5.7. Rest of Asia Pacific
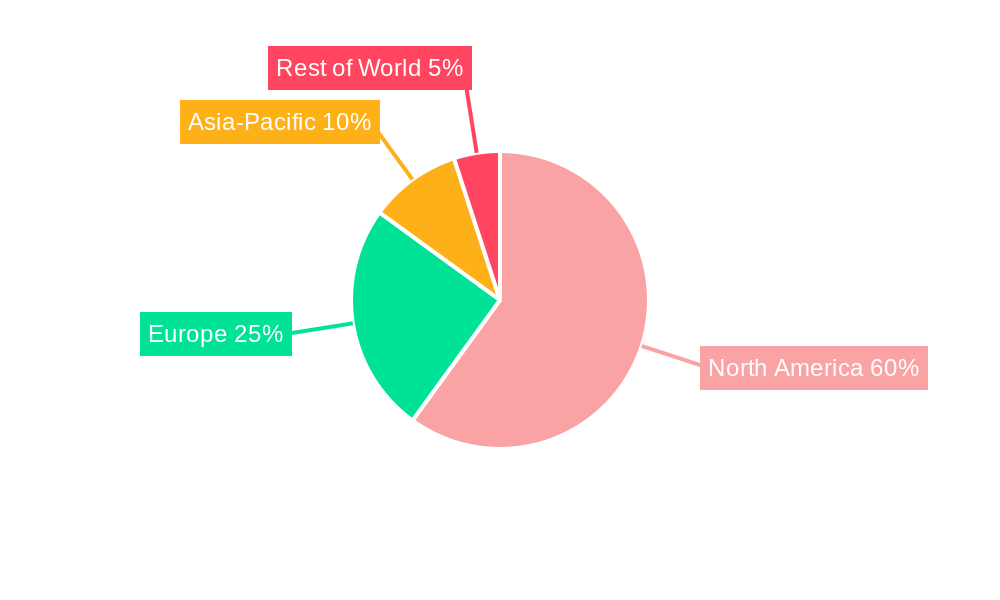
US Cosmetics Market Regional Market Share
Geographic Coverage of US Cosmetics Market
US Cosmetics Market REPORT HIGHLIGHTS
| Aspects | Details |
|---|---|
| Study Period | 2020-2034 |
| Base Year | 2025 |
| Estimated Year | 2026 |
| Forecast Period | 2026-2034 |
| Historical Period | 2020-2025 |
| Growth Rate | CAGR of 2.63% from 2020-2034 |
| Segmentation |
|
Table of Contents
- 1. Introduction
- 1.1. Research Scope
- 1.2. Market Segmentation
- 1.3. Research Objective
- 1.4. Definitions and Assumptions
- 2. Executive Summary
- 2.1. Market Snapshot
- 3. Market Dynamics
- 3.1. Market Drivers
- 3.2. Market Restrains
- 3.3. Market Trends
- 3.4. Market Opportunities
- 4. Market Factor Analysis
- 4.1. Porters Five Forces
- 4.1.1. Bargaining Power of Suppliers
- 4.1.2. Bargaining Power of Buyers
- 4.1.3. Threat of New Entrants
- 4.1.4. Threat of Substitutes
- 4.1.5. Competitive Rivalry
- 4.2. PESTEL analysis
- 4.3. BCG Analysis
- 4.3.1. Stars (High Growth, High Market Share)
- 4.3.2. Cash Cows (Low Growth, High Market Share)
- 4.3.3. Question Mark (High Growth, Low Market Share)
- 4.3.4. Dogs (Low Growth, Low Market Share)
- 4.4. Ansoff Matrix Analysis
- 4.5. Supply Chain Analysis
- 4.6. Regulatory Landscape
- 4.7. Current Market Potential and Opportunity Assessment (TAM–SAM–SOM Framework)
- 4.8. RAX Analyst Note
- 4.1. Porters Five Forces
- 5. Market Analysis, Insights and Forecast 2021-2033
- 5.1. Market Analysis, Insights and Forecast - by Product Type
- 5.1.1. Personal Care
- 5.1.1.1. Hair Care
- 5.1.1.1.1. Shampoo
- 5.1.1.1.2. Conditioner
- 5.1.1.1.3. Hair Oil
- 5.1.1.1.4. Hair Styling and Coloring Products
- 5.1.1.1.5. Other Hair Care Products
- 5.1.1.2. Skin Care
- 5.1.1.2.1. Facial Care
- 5.1.1.2.2. Body Care
- 5.1.1.2.3. Lip Care
- 5.1.1.3. Bath and Shower
- 5.1.1.3.1. Soaps
- 5.1.1.3.2. Shower Gels
- 5.1.1.3.3. Bath Salts
- 5.1.1.3.4. Bathing Accessories
- 5.1.1.3.5. Other Bath and Shower Products
- 5.1.1.4. Oral Care
- 5.1.1.4.1. Toothbrushes and Replacements
- 5.1.1.4.2. Toothpastes
- 5.1.1.4.3. Mouthwashes and Rinses
- 5.1.1.4.4. Other Oral Care Products
- 5.1.1.5. Men's Grooming
- 5.1.1.6. Deodrants and Antiperspirants
- 5.1.1.1. Hair Care
- 5.1.2. Beauty and Make-up/Cosmetics Market
- 5.1.2.1. Color Cosmetics
- 5.1.2.1.1. Facial Make-up Products
- 5.1.2.1.2. Eye Make-up Products
- 5.1.2.1.3. Lip and Nail Make-up Products
- 5.1.2.1. Color Cosmetics
- 5.1.1. Personal Care
- 5.2. Market Analysis, Insights and Forecast - by Category
- 5.2.1. Premium Products
- 5.2.2. Mass Products
- 5.3. Market Analysis, Insights and Forecast - by Distribution Channel
- 5.3.1. Specialist Retail Stores
- 5.3.2. Supermarkets/Hypermarkets
- 5.3.3. Convenience Stores
- 5.3.4. Pharmacies/Drug Stores
- 5.3.5. Online Retail Stores
- 5.3.6. Other Distribution Channels
- 5.4. Market Analysis, Insights and Forecast - by Region
- 5.4.1. North America
- 5.4.2. South America
- 5.4.3. Europe
- 5.4.4. Middle East & Africa
- 5.4.5. Asia Pacific
- 5.1. Market Analysis, Insights and Forecast - by Product Type
- 6. Global US Cosmetics Market Analysis, Insights and Forecast, 2021-2033
- 6.1. Market Analysis, Insights and Forecast - by Product Type
- 6.1.1. Personal Care
- 6.1.1.1. Hair Care
- 6.1.1.1.1. Shampoo
- 6.1.1.1.2. Conditioner
- 6.1.1.1.3. Hair Oil
- 6.1.1.1.4. Hair Styling and Coloring Products
- 6.1.1.1.5. Other Hair Care Products
- 6.1.1.2. Skin Care
- 6.1.1.2.1. Facial Care
- 6.1.1.2.2. Body Care
- 6.1.1.2.3. Lip Care
- 6.1.1.3. Bath and Shower
- 6.1.1.3.1. Soaps
- 6.1.1.3.2. Shower Gels
- 6.1.1.3.3. Bath Salts
- 6.1.1.3.4. Bathing Accessories
- 6.1.1.3.5. Other Bath and Shower Products
- 6.1.1.4. Oral Care
- 6.1.1.4.1. Toothbrushes and Replacements
- 6.1.1.4.2. Toothpastes
- 6.1.1.4.3. Mouthwashes and Rinses
- 6.1.1.4.4. Other Oral Care Products
- 6.1.1.5. Men's Grooming
- 6.1.1.6. Deodrants and Antiperspirants
- 6.1.1.1. Hair Care
- 6.1.2. Beauty and Make-up/Cosmetics Market
- 6.1.2.1. Color Cosmetics
- 6.1.2.1.1. Facial Make-up Products
- 6.1.2.1.2. Eye Make-up Products
- 6.1.2.1.3. Lip and Nail Make-up Products
- 6.1.2.1. Color Cosmetics
- 6.1.1. Personal Care
- 6.2. Market Analysis, Insights and Forecast - by Category
- 6.2.1. Premium Products
- 6.2.2. Mass Products
- 6.3. Market Analysis, Insights and Forecast - by Distribution Channel
- 6.3.1. Specialist Retail Stores
- 6.3.2. Supermarkets/Hypermarkets
- 6.3.3. Convenience Stores
- 6.3.4. Pharmacies/Drug Stores
- 6.3.5. Online Retail Stores
- 6.3.6. Other Distribution Channels
- 6.1. Market Analysis, Insights and Forecast - by Product Type
- 7. North America US Cosmetics Market Analysis, Insights and Forecast, 2020-2032
- 7.1. Market Analysis, Insights and Forecast - by Product Type
- 7.1.1. Personal Care
- 7.1.1.1. Hair Care
- 7.1.1.1.1. Shampoo
- 7.1.1.1.2. Conditioner
- 7.1.1.1.3. Hair Oil
- 7.1.1.1.4. Hair Styling and Coloring Products
- 7.1.1.1.5. Other Hair Care Products
- 7.1.1.2. Skin Care
- 7.1.1.2.1. Facial Care
- 7.1.1.2.2. Body Care
- 7.1.1.2.3. Lip Care
- 7.1.1.3. Bath and Shower
- 7.1.1.3.1. Soaps
- 7.1.1.3.2. Shower Gels
- 7.1.1.3.3. Bath Salts
- 7.1.1.3.4. Bathing Accessories
- 7.1.1.3.5. Other Bath and Shower Products
- 7.1.1.4. Oral Care
- 7.1.1.4.1. Toothbrushes and Replacements
- 7.1.1.4.2. Toothpastes
- 7.1.1.4.3. Mouthwashes and Rinses
- 7.1.1.4.4. Other Oral Care Products
- 7.1.1.5. Men's Grooming
- 7.1.1.6. Deodrants and Antiperspirants
- 7.1.1.1. Hair Care
- 7.1.2. Beauty and Make-up/Cosmetics Market
- 7.1.2.1. Color Cosmetics
- 7.1.2.1.1. Facial Make-up Products
- 7.1.2.1.2. Eye Make-up Products
- 7.1.2.1.3. Lip and Nail Make-up Products
- 7.1.2.1. Color Cosmetics
- 7.1.1. Personal Care
- 7.2. Market Analysis, Insights and Forecast - by Category
- 7.2.1. Premium Products
- 7.2.2. Mass Products
- 7.3. Market Analysis, Insights and Forecast - by Distribution Channel
- 7.3.1. Specialist Retail Stores
- 7.3.2. Supermarkets/Hypermarkets
- 7.3.3. Convenience Stores
- 7.3.4. Pharmacies/Drug Stores
- 7.3.5. Online Retail Stores
- 7.3.6. Other Distribution Channels
- 7.1. Market Analysis, Insights and Forecast - by Product Type
- 8. South America US Cosmetics Market Analysis, Insights and Forecast, 2020-2032
- 8.1. Market Analysis, Insights and Forecast - by Product Type
- 8.1.1. Personal Care
- 8.1.1.1. Hair Care
- 8.1.1.1.1. Shampoo
- 8.1.1.1.2. Conditioner
- 8.1.1.1.3. Hair Oil
- 8.1.1.1.4. Hair Styling and Coloring Products
- 8.1.1.1.5. Other Hair Care Products
- 8.1.1.2. Skin Care
- 8.1.1.2.1. Facial Care
- 8.1.1.2.2. Body Care
- 8.1.1.2.3. Lip Care
- 8.1.1.3. Bath and Shower
- 8.1.1.3.1. Soaps
- 8.1.1.3.2. Shower Gels
- 8.1.1.3.3. Bath Salts
- 8.1.1.3.4. Bathing Accessories
- 8.1.1.3.5. Other Bath and Shower Products
- 8.1.1.4. Oral Care
- 8.1.1.4.1. Toothbrushes and Replacements
- 8.1.1.4.2. Toothpastes
- 8.1.1.4.3. Mouthwashes and Rinses
- 8.1.1.4.4. Other Oral Care Products
- 8.1.1.5. Men's Grooming
- 8.1.1.6. Deodrants and Antiperspirants
- 8.1.1.1. Hair Care
- 8.1.2. Beauty and Make-up/Cosmetics Market
- 8.1.2.1. Color Cosmetics
- 8.1.2.1.1. Facial Make-up Products
- 8.1.2.1.2. Eye Make-up Products
- 8.1.2.1.3. Lip and Nail Make-up Products
- 8.1.2.1. Color Cosmetics
- 8.1.1. Personal Care
- 8.2. Market Analysis, Insights and Forecast - by Category
- 8.2.1. Premium Products
- 8.2.2. Mass Products
- 8.3. Market Analysis, Insights and Forecast - by Distribution Channel
- 8.3.1. Specialist Retail Stores
- 8.3.2. Supermarkets/Hypermarkets
- 8.3.3. Convenience Stores
- 8.3.4. Pharmacies/Drug Stores
- 8.3.5. Online Retail Stores
- 8.3.6. Other Distribution Channels
- 8.1. Market Analysis, Insights and Forecast - by Product Type
- 9. Europe US Cosmetics Market Analysis, Insights and Forecast, 2020-2032
- 9.1. Market Analysis, Insights and Forecast - by Product Type
- 9.1.1. Personal Care
- 9.1.1.1. Hair Care
- 9.1.1.1.1. Shampoo
- 9.1.1.1.2. Conditioner
- 9.1.1.1.3. Hair Oil
- 9.1.1.1.4. Hair Styling and Coloring Products
- 9.1.1.1.5. Other Hair Care Products
- 9.1.1.2. Skin Care
- 9.1.1.2.1. Facial Care
- 9.1.1.2.2. Body Care
- 9.1.1.2.3. Lip Care
- 9.1.1.3. Bath and Shower
- 9.1.1.3.1. Soaps
- 9.1.1.3.2. Shower Gels
- 9.1.1.3.3. Bath Salts
- 9.1.1.3.4. Bathing Accessories
- 9.1.1.3.5. Other Bath and Shower Products
- 9.1.1.4. Oral Care
- 9.1.1.4.1. Toothbrushes and Replacements
- 9.1.1.4.2. Toothpastes
- 9.1.1.4.3. Mouthwashes and Rinses
- 9.1.1.4.4. Other Oral Care Products
- 9.1.1.5. Men's Grooming
- 9.1.1.6. Deodrants and Antiperspirants
- 9.1.1.1. Hair Care
- 9.1.2. Beauty and Make-up/Cosmetics Market
- 9.1.2.1. Color Cosmetics
- 9.1.2.1.1. Facial Make-up Products
- 9.1.2.1.2. Eye Make-up Products
- 9.1.2.1.3. Lip and Nail Make-up Products
- 9.1.2.1. Color Cosmetics
- 9.1.1. Personal Care
- 9.2. Market Analysis, Insights and Forecast - by Category
- 9.2.1. Premium Products
- 9.2.2. Mass Products
- 9.3. Market Analysis, Insights and Forecast - by Distribution Channel
- 9.3.1. Specialist Retail Stores
- 9.3.2. Supermarkets/Hypermarkets
- 9.3.3. Convenience Stores
- 9.3.4. Pharmacies/Drug Stores
- 9.3.5. Online Retail Stores
- 9.3.6. Other Distribution Channels
- 9.1. Market Analysis, Insights and Forecast - by Product Type
- 10. Middle East & Africa US Cosmetics Market Analysis, Insights and Forecast, 2020-2032
- 10.1. Market Analysis, Insights and Forecast - by Product Type
- 10.1.1. Personal Care
- 10.1.1.1. Hair Care
- 10.1.1.1.1. Shampoo
- 10.1.1.1.2. Conditioner
- 10.1.1.1.3. Hair Oil
- 10.1.1.1.4. Hair Styling and Coloring Products
- 10.1.1.1.5. Other Hair Care Products
- 10.1.1.2. Skin Care
- 10.1.1.2.1. Facial Care
- 10.1.1.2.2. Body Care
- 10.1.1.2.3. Lip Care
- 10.1.1.3. Bath and Shower
- 10.1.1.3.1. Soaps
- 10.1.1.3.2. Shower Gels
- 10.1.1.3.3. Bath Salts
- 10.1.1.3.4. Bathing Accessories
- 10.1.1.3.5. Other Bath and Shower Products
- 10.1.1.4. Oral Care
- 10.1.1.4.1. Toothbrushes and Replacements
- 10.1.1.4.2. Toothpastes
- 10.1.1.4.3. Mouthwashes and Rinses
- 10.1.1.4.4. Other Oral Care Products
- 10.1.1.5. Men's Grooming
- 10.1.1.6. Deodrants and Antiperspirants
- 10.1.1.1. Hair Care
- 10.1.2. Beauty and Make-up/Cosmetics Market
- 10.1.2.1. Color Cosmetics
- 10.1.2.1.1. Facial Make-up Products
- 10.1.2.1.2. Eye Make-up Products
- 10.1.2.1.3. Lip and Nail Make-up Products
- 10.1.2.1. Color Cosmetics
- 10.1.1. Personal Care
- 10.2. Market Analysis, Insights and Forecast - by Category
- 10.2.1. Premium Products
- 10.2.2. Mass Products
- 10.3. Market Analysis, Insights and Forecast - by Distribution Channel
- 10.3.1. Specialist Retail Stores
- 10.3.2. Supermarkets/Hypermarkets
- 10.3.3. Convenience Stores
- 10.3.4. Pharmacies/Drug Stores
- 10.3.5. Online Retail Stores
- 10.3.6. Other Distribution Channels
- 10.1. Market Analysis, Insights and Forecast - by Product Type
- 11. Asia Pacific US Cosmetics Market Analysis, Insights and Forecast, 2020-2032
- 11.1. Market Analysis, Insights and Forecast - by Product Type
- 11.1.1. Personal Care
- 11.1.1.1. Hair Care
- 11.1.1.1.1. Shampoo
- 11.1.1.1.2. Conditioner
- 11.1.1.1.3. Hair Oil
- 11.1.1.1.4. Hair Styling and Coloring Products
- 11.1.1.1.5. Other Hair Care Products
- 11.1.1.2. Skin Care
- 11.1.1.2.1. Facial Care
- 11.1.1.2.2. Body Care
- 11.1.1.2.3. Lip Care
- 11.1.1.3. Bath and Shower
- 11.1.1.3.1. Soaps
- 11.1.1.3.2. Shower Gels
- 11.1.1.3.3. Bath Salts
- 11.1.1.3.4. Bathing Accessories
- 11.1.1.3.5. Other Bath and Shower Products
- 11.1.1.4. Oral Care
- 11.1.1.4.1. Toothbrushes and Replacements
- 11.1.1.4.2. Toothpastes
- 11.1.1.4.3. Mouthwashes and Rinses
- 11.1.1.4.4. Other Oral Care Products
- 11.1.1.5. Men's Grooming
- 11.1.1.6. Deodrants and Antiperspirants
- 11.1.1.1. Hair Care
- 11.1.2. Beauty and Make-up/Cosmetics Market
- 11.1.2.1. Color Cosmetics
- 11.1.2.1.1. Facial Make-up Products
- 11.1.2.1.2. Eye Make-up Products
- 11.1.2.1.3. Lip and Nail Make-up Products
- 11.1.2.1. Color Cosmetics
- 11.1.1. Personal Care
- 11.2. Market Analysis, Insights and Forecast - by Category
- 11.2.1. Premium Products
- 11.2.2. Mass Products
- 11.3. Market Analysis, Insights and Forecast - by Distribution Channel
- 11.3.1. Specialist Retail Stores
- 11.3.2. Supermarkets/Hypermarkets
- 11.3.3. Convenience Stores
- 11.3.4. Pharmacies/Drug Stores
- 11.3.5. Online Retail Stores
- 11.3.6. Other Distribution Channels
- 11.1. Market Analysis, Insights and Forecast - by Product Type
- 12. Competitive Analysis
- 12.1. Company Profiles
- 12.1.1 Alticor (Amway Corp )
- 12.1.1.1. Company Overview
- 12.1.1.2. Products
- 12.1.1.3. Company Financials
- 12.1.1.4. SWOT Analysis
- 12.1.2 The Estée Lauder Companies Inc
- 12.1.2.1. Company Overview
- 12.1.2.2. Products
- 12.1.2.3. Company Financials
- 12.1.2.4. SWOT Analysis
- 12.1.3 Shiseido Company Limited
- 12.1.3.1. Company Overview
- 12.1.3.2. Products
- 12.1.3.3. Company Financials
- 12.1.3.4. SWOT Analysis
- 12.1.4 maxingvest AG (Beiersdorf AG)
- 12.1.4.1. Company Overview
- 12.1.4.2. Products
- 12.1.4.3. Company Financials
- 12.1.4.4. SWOT Analysis
- 12.1.5 Unilever PLC
- 12.1.5.1. Company Overview
- 12.1.5.2. Products
- 12.1.5.3. Company Financials
- 12.1.5.4. SWOT Analysis
- 12.1.6 Colgate-Palmolive Company
- 12.1.6.1. Company Overview
- 12.1.6.2. Products
- 12.1.6.3. Company Financials
- 12.1.6.4. SWOT Analysis
- 12.1.7 L'Oréal S A
- 12.1.7.1. Company Overview
- 12.1.7.2. Products
- 12.1.7.3. Company Financials
- 12.1.7.4. SWOT Analysis
- 12.1.8 Johnson & Johnson Services Inc *List Not Exhaustive
- 12.1.8.1. Company Overview
- 12.1.8.2. Products
- 12.1.8.3. Company Financials
- 12.1.8.4. SWOT Analysis
- 12.1.9 Revlon Inc
- 12.1.9.1. Company Overview
- 12.1.9.2. Products
- 12.1.9.3. Company Financials
- 12.1.9.4. SWOT Analysis
- 12.1.10 Natura & Co
- 12.1.10.1. Company Overview
- 12.1.10.2. Products
- 12.1.10.3. Company Financials
- 12.1.10.4. SWOT Analysis
- 12.1.11 Procter & Gamble Company
- 12.1.11.1. Company Overview
- 12.1.11.2. Products
- 12.1.11.3. Company Financials
- 12.1.11.4. SWOT Analysis
- 12.1.1 Alticor (Amway Corp )
- 12.2. Market Entropy
- 12.2.1 Company's Key Areas Served
- 12.2.2 Recent Developments
- 12.3. Company Market Share Analysis 2025
- 12.3.1 Top 5 Companies Market Share Analysis
- 12.3.2 Top 3 Companies Market Share Analysis
- 12.4. List of Potential Customers
- 13. Research Methodology
List of Figures
- Figure 1: Global US Cosmetics Market Revenue Breakdown (Million, %) by Region 2025 & 2033
- Figure 2: North America US Cosmetics Market Revenue (Million), by Product Type 2025 & 2033
- Figure 3: North America US Cosmetics Market Revenue Share (%), by Product Type 2025 & 2033
- Figure 4: North America US Cosmetics Market Revenue (Million), by Category 2025 & 2033
- Figure 5: North America US Cosmetics Market Revenue Share (%), by Category 2025 & 2033
- Figure 6: North America US Cosmetics Market Revenue (Million), by Distribution Channel 2025 & 2033
- Figure 7: North America US Cosmetics Market Revenue Share (%), by Distribution Channel 2025 & 2033
- Figure 8: North America US Cosmetics Market Revenue (Million), by Country 2025 & 2033
- Figure 9: North America US Cosmetics Market Revenue Share (%), by Country 2025 & 2033
- Figure 10: South America US Cosmetics Market Revenue (Million), by Product Type 2025 & 2033
- Figure 11: South America US Cosmetics Market Revenue Share (%), by Product Type 2025 & 2033
- Figure 12: South America US Cosmetics Market Revenue (Million), by Category 2025 & 2033
- Figure 13: South America US Cosmetics Market Revenue Share (%), by Category 2025 & 2033
- Figure 14: South America US Cosmetics Market Revenue (Million), by Distribution Channel 2025 & 2033
- Figure 15: South America US Cosmetics Market Revenue Share (%), by Distribution Channel 2025 & 2033
- Figure 16: South America US Cosmetics Market Revenue (Million), by Country 2025 & 2033
- Figure 17: South America US Cosmetics Market Revenue Share (%), by Country 2025 & 2033
- Figure 18: Europe US Cosmetics Market Revenue (Million), by Product Type 2025 & 2033
- Figure 19: Europe US Cosmetics Market Revenue Share (%), by Product Type 2025 & 2033
- Figure 20: Europe US Cosmetics Market Revenue (Million), by Category 2025 & 2033
- Figure 21: Europe US Cosmetics Market Revenue Share (%), by Category 2025 & 2033
- Figure 22: Europe US Cosmetics Market Revenue (Million), by Distribution Channel 2025 & 2033
- Figure 23: Europe US Cosmetics Market Revenue Share (%), by Distribution Channel 2025 & 2033
- Figure 24: Europe US Cosmetics Market Revenue (Million), by Country 2025 & 2033
- Figure 25: Europe US Cosmetics Market Revenue Share (%), by Country 2025 & 2033
- Figure 26: Middle East & Africa US Cosmetics Market Revenue (Million), by Product Type 2025 & 2033
- Figure 27: Middle East & Africa US Cosmetics Market Revenue Share (%), by Product Type 2025 & 2033
- Figure 28: Middle East & Africa US Cosmetics Market Revenue (Million), by Category 2025 & 2033
- Figure 29: Middle East & Africa US Cosmetics Market Revenue Share (%), by Category 2025 & 2033
- Figure 30: Middle East & Africa US Cosmetics Market Revenue (Million), by Distribution Channel 2025 & 2033
- Figure 31: Middle East & Africa US Cosmetics Market Revenue Share (%), by Distribution Channel 2025 & 2033
- Figure 32: Middle East & Africa US Cosmetics Market Revenue (Million), by Country 2025 & 2033
- Figure 33: Middle East & Africa US Cosmetics Market Revenue Share (%), by Country 2025 & 2033
- Figure 34: Asia Pacific US Cosmetics Market Revenue (Million), by Product Type 2025 & 2033
- Figure 35: Asia Pacific US Cosmetics Market Revenue Share (%), by Product Type 2025 & 2033
- Figure 36: Asia Pacific US Cosmetics Market Revenue (Million), by Category 2025 & 2033
- Figure 37: Asia Pacific US Cosmetics Market Revenue Share (%), by Category 2025 & 2033
- Figure 38: Asia Pacific US Cosmetics Market Revenue (Million), by Distribution Channel 2025 & 2033
- Figure 39: Asia Pacific US Cosmetics Market Revenue Share (%), by Distribution Channel 2025 & 2033
- Figure 40: Asia Pacific US Cosmetics Market Revenue (Million), by Country 2025 & 2033
- Figure 41: Asia Pacific US Cosmetics Market Revenue Share (%), by Country 2025 & 2033
List of Tables
- Table 1: Global US Cosmetics Market Revenue Million Forecast, by Product Type 2020 & 2033
- Table 2: Global US Cosmetics Market Revenue Million Forecast, by Category 2020 & 2033
- Table 3: Global US Cosmetics Market Revenue Million Forecast, by Distribution Channel 2020 & 2033
- Table 4: Global US Cosmetics Market Revenue Million Forecast, by Region 2020 & 2033
- Table 5: Global US Cosmetics Market Revenue Million Forecast, by Product Type 2020 & 2033
- Table 6: Global US Cosmetics Market Revenue Million Forecast, by Category 2020 & 2033
- Table 7: Global US Cosmetics Market Revenue Million Forecast, by Distribution Channel 2020 & 2033
- Table 8: Global US Cosmetics Market Revenue Million Forecast, by Country 2020 & 2033
- Table 9: United States US Cosmetics Market Revenue (Million) Forecast, by Application 2020 & 2033
- Table 10: Canada US Cosmetics Market Revenue (Million) Forecast, by Application 2020 & 2033
- Table 11: Mexico US Cosmetics Market Revenue (Million) Forecast, by Application 2020 & 2033
- Table 12: Global US Cosmetics Market Revenue Million Forecast, by Product Type 2020 & 2033
- Table 13: Global US Cosmetics Market Revenue Million Forecast, by Category 2020 & 2033
- Table 14: Global US Cosmetics Market Revenue Million Forecast, by Distribution Channel 2020 & 2033
- Table 15: Global US Cosmetics Market Revenue Million Forecast, by Country 2020 & 2033
- Table 16: Brazil US Cosmetics Market Revenue (Million) Forecast, by Application 2020 & 2033
- Table 17: Argentina US Cosmetics Market Revenue (Million) Forecast, by Application 2020 & 2033
- Table 18: Rest of South America US Cosmetics Market Revenue (Million) Forecast, by Application 2020 & 2033
- Table 19: Global US Cosmetics Market Revenue Million Forecast, by Product Type 2020 & 2033
- Table 20: Global US Cosmetics Market Revenue Million Forecast, by Category 2020 & 2033
- Table 21: Global US Cosmetics Market Revenue Million Forecast, by Distribution Channel 2020 & 2033
- Table 22: Global US Cosmetics Market Revenue Million Forecast, by Country 2020 & 2033
- Table 23: United Kingdom US Cosmetics Market Revenue (Million) Forecast, by Application 2020 & 2033
- Table 24: Germany US Cosmetics Market Revenue (Million) Forecast, by Application 2020 & 2033
- Table 25: France US Cosmetics Market Revenue (Million) Forecast, by Application 2020 & 2033
- Table 26: Italy US Cosmetics Market Revenue (Million) Forecast, by Application 2020 & 2033
- Table 27: Spain US Cosmetics Market Revenue (Million) Forecast, by Application 2020 & 2033
- Table 28: Russia US Cosmetics Market Revenue (Million) Forecast, by Application 2020 & 2033
- Table 29: Benelux US Cosmetics Market Revenue (Million) Forecast, by Application 2020 & 2033
- Table 30: Nordics US Cosmetics Market Revenue (Million) Forecast, by Application 2020 & 2033
- Table 31: Rest of Europe US Cosmetics Market Revenue (Million) Forecast, by Application 2020 & 2033
- Table 32: Global US Cosmetics Market Revenue Million Forecast, by Product Type 2020 & 2033
- Table 33: Global US Cosmetics Market Revenue Million Forecast, by Category 2020 & 2033
- Table 34: Global US Cosmetics Market Revenue Million Forecast, by Distribution Channel 2020 & 2033
- Table 35: Global US Cosmetics Market Revenue Million Forecast, by Country 2020 & 2033
- Table 36: Turkey US Cosmetics Market Revenue (Million) Forecast, by Application 2020 & 2033
- Table 37: Israel US Cosmetics Market Revenue (Million) Forecast, by Application 2020 & 2033
- Table 38: GCC US Cosmetics Market Revenue (Million) Forecast, by Application 2020 & 2033
- Table 39: North Africa US Cosmetics Market Revenue (Million) Forecast, by Application 2020 & 2033
- Table 40: South Africa US Cosmetics Market Revenue (Million) Forecast, by Application 2020 & 2033
- Table 41: Rest of Middle East & Africa US Cosmetics Market Revenue (Million) Forecast, by Application 2020 & 2033
- Table 42: Global US Cosmetics Market Revenue Million Forecast, by Product Type 2020 & 2033
- Table 43: Global US Cosmetics Market Revenue Million Forecast, by Category 2020 & 2033
- Table 44: Global US Cosmetics Market Revenue Million Forecast, by Distribution Channel 2020 & 2033
- Table 45: Global US Cosmetics Market Revenue Million Forecast, by Country 2020 & 2033
- Table 46: China US Cosmetics Market Revenue (Million) Forecast, by Application 2020 & 2033
- Table 47: India US Cosmetics Market Revenue (Million) Forecast, by Application 2020 & 2033
- Table 48: Japan US Cosmetics Market Revenue (Million) Forecast, by Application 2020 & 2033
- Table 49: South Korea US Cosmetics Market Revenue (Million) Forecast, by Application 2020 & 2033
- Table 50: ASEAN US Cosmetics Market Revenue (Million) Forecast, by Application 2020 & 2033
- Table 51: Oceania US Cosmetics Market Revenue (Million) Forecast, by Application 2020 & 2033
- Table 52: Rest of Asia Pacific US Cosmetics Market Revenue (Million) Forecast, by Application 2020 & 2033
Frequently Asked Questions
1. What is the projected Compound Annual Growth Rate (CAGR) of the US Cosmetics Market?
The projected CAGR is approximately 2.63%.
2. Which companies are prominent players in the US Cosmetics Market?
Key companies in the market include Alticor (Amway Corp ), The Estée Lauder Companies Inc, Shiseido Company Limited, maxingvest AG (Beiersdorf AG), Unilever PLC, Colgate-Palmolive Company, L'Oréal S A, Johnson & Johnson Services Inc *List Not Exhaustive, Revlon Inc, Natura & Co, Procter & Gamble Company.
3. What are the main segments of the US Cosmetics Market?
The market segments include Product Type, Category, Distribution Channel.
4. Can you provide details about the market size?
The market size is estimated to be USD 93.74 Million as of 2022.
5. What are some drivers contributing to market growth?
Sustainable Fashion Trend; Strategic Expansion With Respect To E-commerce Subscription.
6. What are the notable trends driving market growth?
Growing Inclination Toward Organic. Natural. and Cruelty-Free Products.
7. Are there any restraints impacting market growth?
High Cost of Rented Apparel Maintenance.
8. Can you provide examples of recent developments in the market?
March 2022: Crest, a Procter & Gamble Company brand, launched Crest Densify, a premium toothpaste that actively rebuilds tooth density by remineralizing enamel. The toothpaste claims to strengthen the teeth and protect them from future decay.
9. What pricing options are available for accessing the report?
Pricing options include single-user, multi-user, and enterprise licenses priced at USD 3800, USD 4500, and USD 5800 respectively.
10. Is the market size provided in terms of value or volume?
The market size is provided in terms of value, measured in Million.
11. Are there any specific market keywords associated with the report?
Yes, the market keyword associated with the report is "US Cosmetics Market," which aids in identifying and referencing the specific market segment covered.
12. How do I determine which pricing option suits my needs best?
The pricing options vary based on user requirements and access needs. Individual users may opt for single-user licenses, while businesses requiring broader access may choose multi-user or enterprise licenses for cost-effective access to the report.
13. Are there any additional resources or data provided in the US Cosmetics Market report?
While the report offers comprehensive insights, it's advisable to review the specific contents or supplementary materials provided to ascertain if additional resources or data are available.
14. How can I stay updated on further developments or reports in the US Cosmetics Market?
To stay informed about further developments, trends, and reports in the US Cosmetics Market, consider subscribing to industry newsletters, following relevant companies and organizations, or regularly checking reputable industry news sources and publications.
Methodology
Step 1 - Identification of Relevant Samples Size from Population Database


Step 2 - Approaches for Defining Global Market Size (Value, Volume* & Price*)

Note*: In applicable scenarios
Step 3 - Data Sources
Primary Research
- Web Analytics
- Survey Reports
- Research Institute
- Latest Research Reports
- Opinion Leaders
Secondary Research
- Annual Reports
- White Paper
- Latest Press Release
- Industry Association
- Paid Database
- Investor Presentations

Step 4 - Data Triangulation
Involves using different sources of information in order to increase the validity of a study
These sources are likely to be stakeholders in a program - participants, other researchers, program staff, other community members, and so on.
Then we put all data in single framework & apply various statistical tools to find out the dynamic on the market.
During the analysis stage, feedback from the stakeholder groups would be compared to determine areas of agreement as well as areas of divergence