

Key Insights
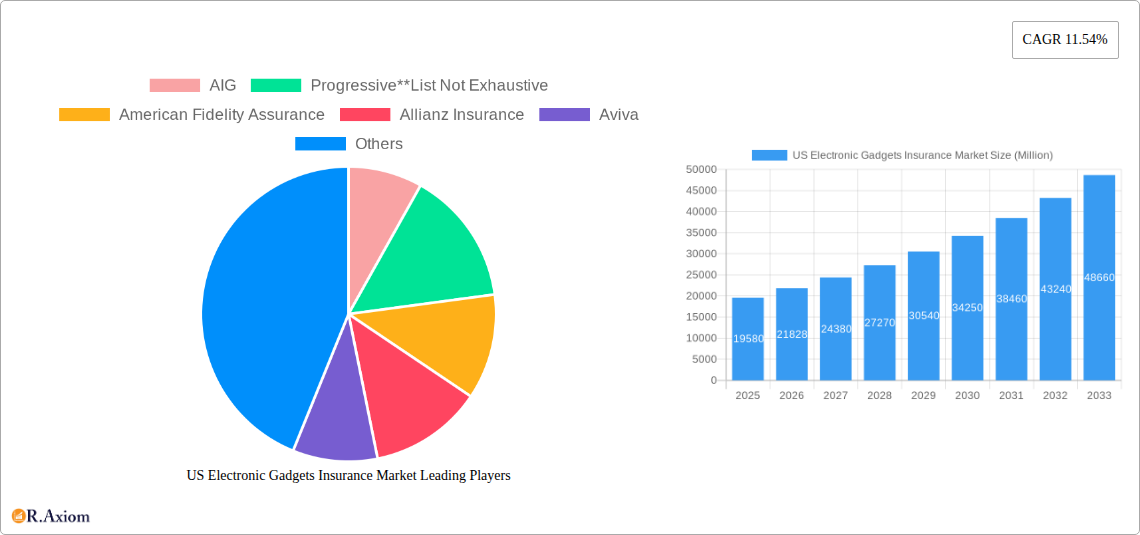
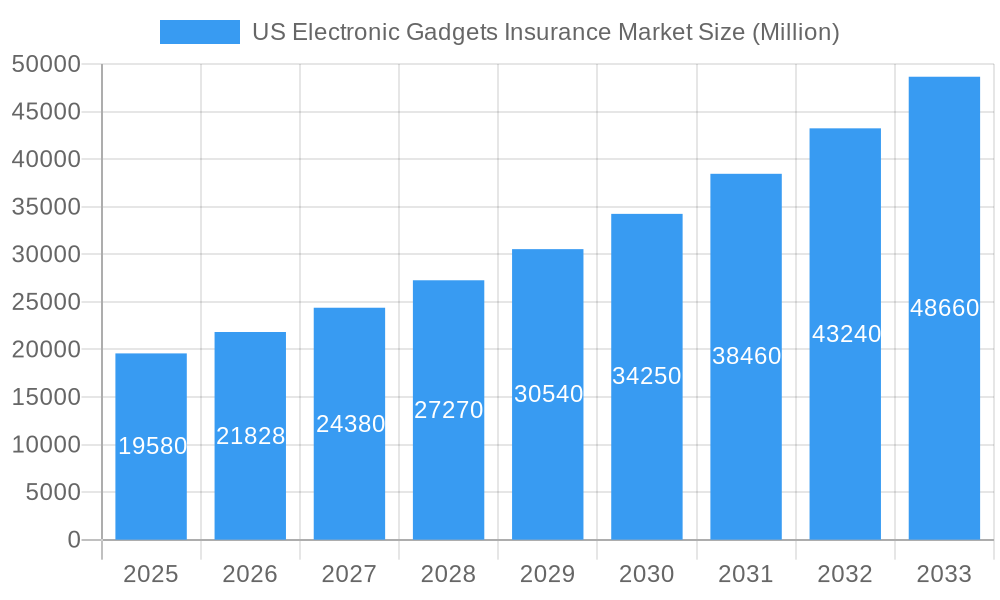
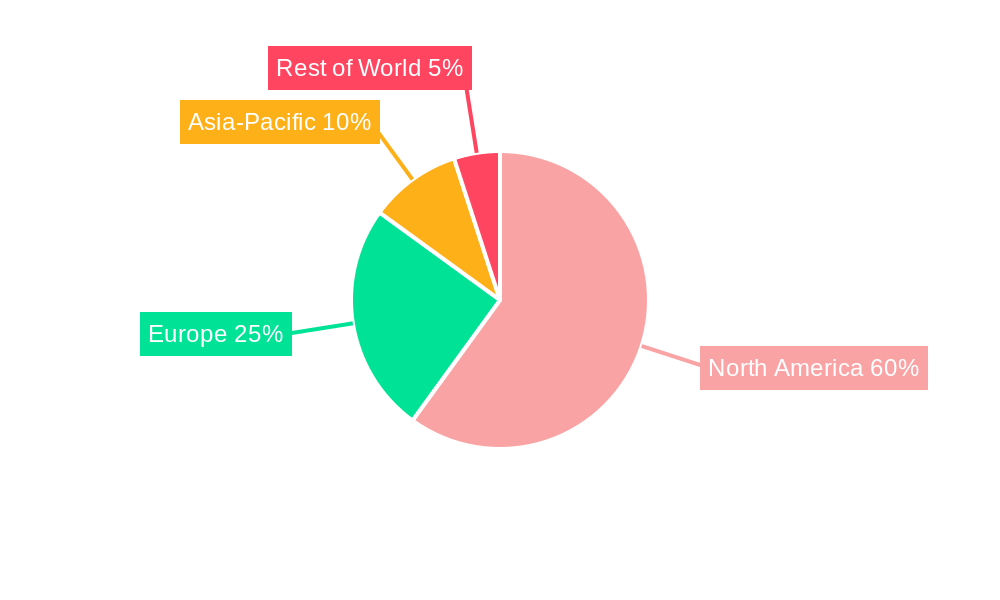
The US electronic gadgets insurance market is experiencing robust growth, projected to reach \$19.58 billion in 2025 and maintain a Compound Annual Growth Rate (CAGR) of 11.54% from 2025 to 2033. This expansion is driven by several key factors. Increasing ownership of expensive electronic devices like smartphones, laptops, and drones, coupled with rising consumer awareness of the risks associated with loss, theft, and accidental damage, fuels demand for insurance coverage. The market is segmented by coverage type (accidental damage, theft and loss), device type (laptops, computers, cameras, mobile devices, drones), and end-users (corporate, individual). The corporate segment is a significant contributor, driven by the need to protect company-owned devices and ensure business continuity. Furthermore, the increasing prevalence of extended warranties and bundled insurance packages offered by device manufacturers and retailers is also bolstering market growth. Competition among major players such as AIG, Progressive, American Fidelity Assurance, Allianz Insurance, Aviva, AXA, Chubb, Assurant Inc, and AT&T Inc, fosters innovation and drives down prices, making insurance more accessible. North America, particularly the United States, represents a substantial portion of the overall market, benefiting from high electronic device adoption rates and a well-developed insurance sector.
US Electronic Gadgets Insurance Market Market Size (In Billion)
The market's continued growth trajectory is expected to be influenced by technological advancements in gadget manufacturing and associated insurance services, leading to more customized and technologically-driven coverage. However, factors such as the relatively high cost of insurance for certain high-value gadgets and the complexities associated with claims processing could pose challenges. Nevertheless, the market’s potential for growth remains significant, particularly with expanding mobile device usage and the increasing prevalence of Internet of Things (IoT) devices. The market is expected to witness further segmentation and specialization, with insurers developing tailored offerings for specific devices and customer segments. This will involve focusing on customer experience and innovative claims processes, leading to increased market penetration.
US Electronic Gadgets Insurance Market Company Market Share
US Electronic Gadgets Insurance Market: A Comprehensive Report (2019-2033)
This comprehensive report provides an in-depth analysis of the US Electronic Gadgets Insurance Market, offering valuable insights for industry stakeholders, investors, and strategic decision-makers. Covering the period from 2019 to 2033, with a focus on 2025, this report analyzes market size, segmentation, key players, growth drivers, challenges, and emerging opportunities. The study utilizes robust data and insightful analysis to forecast market trends and provide actionable recommendations. The market is valued at xx Million in 2025 and is projected to reach xx Million by 2033, exhibiting a CAGR of xx% during the forecast period (2025-2033).
US Electronic Gadgets Insurance Market Market Concentration & Innovation
The US electronic gadgets insurance market exhibits a moderately concentrated landscape, with several large players holding significant market share. AIG, Progressive, American Fidelity Assurance, Allianz Insurance, Aviva, AXA, Chubb, Assurant Inc, AT&T Inc, and Amica Mutual Insurance are key players, although the market also accommodates numerous smaller, niche insurers. Market share data for 2025 reveals that the top 5 players collectively hold approximately xx% of the market, indicating a competitive environment with opportunities for both established and emerging companies.
Innovation in this market is driven by several factors:
- Technological advancements: The increasing sophistication of electronic gadgets necessitates more comprehensive and tailored insurance solutions. The rise of connected devices and the Internet of Things (IoT) also opens new avenues for innovative risk management and claims processing.
- Product diversification: Insurers are expanding their offerings beyond basic coverage to include specialized plans for high-value devices, extended warranties, and bundled services.
- Digitalization: Online platforms and mobile apps are streamlining the insurance purchasing process, enhancing customer experience, and driving market penetration.
Regulatory frameworks, including state-specific insurance regulations, play a significant role in shaping market dynamics. Product substitutes, such as manufacturer warranties and self-insurance, present competitive pressures. However, the increasing value and complexity of electronic gadgets are driving demand for specialized insurance solutions. End-user trends, particularly the growing adoption of smartphones and other smart devices, are fueling market expansion. M&A activity has been moderate, with deal values ranging from xx Million to xx Million in recent years, indicating consolidation within the sector.
US Electronic Gadgets Insurance Market Industry Trends & Insights
The US electronic gadgets insurance market is experiencing robust growth, propelled by several key factors. The rising ownership of electronic devices, particularly smartphones, laptops, and tablets, forms the cornerstone of this expansion. Coupled with increasing device value and technological advancements leading to more complex and expensive repairs, the need for insurance is escalating.
Technological disruptions, such as the development of advanced repair techniques and the emergence of extended warranties, impact market dynamics. Consumer preferences are shifting towards bundled insurance packages that offer comprehensive coverage and added value services. Competitive dynamics remain intense, with established players facing challenges from new entrants and innovative business models. The market exhibits a considerable growth trajectory, with the CAGR for the historical period (2019-2024) estimated at xx% and projected to reach xx% during the forecast period (2025-2033). Market penetration remains relatively low, suggesting substantial untapped potential for growth, particularly in less-saturated segments like drone insurance and IoT device coverage.
Dominant Markets & Segments in US Electronic Gadgets Insurance Market
Analyzing the market across different segments reveals distinct patterns of dominance.
By Coverage Type: Accidental damage insurance holds the largest market share due to the inherent fragility of electronic gadgets. Theft and loss insurance constitutes a significant segment, driven by the high value of many devices and concerns about security.
By Device Type: Mobile devices dominate the market, reflecting their widespread adoption. Laptops and computers follow closely, driven by their importance in both personal and professional settings. The drone insurance segment, while smaller, is characterized by rapid growth, fuelled by the expanding commercial applications of drones.
By End-User: The individual segment constitutes a larger market share than the corporate segment. However, corporate demand is growing due to the increasing reliance on electronic devices in businesses of all sizes.
Key Drivers for Dominant Segments:
- High Value of Devices: The escalating cost of electronics increases the perceived risk and necessity of insurance coverage.
- Frequent Damage: Smartphones, in particular, are susceptible to damage due to their portability and everyday use.
- Technological Advancements: The complexity and cost of repairs for advanced devices make insurance an attractive risk mitigation strategy.
Regional dominance is not explicitly defined within this data, but factors such as population density, income levels, and technological adoption rates would play a significant role.
US Electronic Gadgets Insurance Market Product Developments
Recent product innovations include the expansion of coverage to include newer device types, such as wearables and smart home devices. Insurers are also developing specialized insurance solutions to address the unique risks associated with specific devices or activities. This involves the development of bundled insurance plans, including features such as extended warranties and repair services, enhancing customer appeal. The competitive advantage lies in offering comprehensive coverage, competitive pricing, convenient claims processing, and superior customer service. The trend is toward leveraging technology to provide streamlined and personalized insurance solutions.
Report Scope & Segmentation Analysis
This report segments the US electronic gadgets insurance market along several key dimensions:
By Coverage Type: Accidental Damage, Theft and Loss. Accidental damage coverage shows higher growth due to the increased vulnerability of electronic gadgets to physical damage. Theft and loss coverage is also experiencing growth due to concerns about security and device theft.
By Device Type: Laptops, Computers, Cameras, Mobile Devices, Drones. The mobile device segment is the largest and fastest-growing segment. Growth in drones segment is fuelled by the burgeoning use of drones in various sectors.
By End-Users: Corporate, Individual. The individual user segment currently dominates but corporate demand is rapidly expanding due to an increase in BYOD policies and workplace reliance on electronic gadgets.
Key Drivers of US Electronic Gadgets Insurance Market Growth
The US electronic gadgets insurance market's growth is primarily driven by rising electronic device ownership, increasing device value, growing awareness of insurance benefits, and technological advancements in risk assessment and claims management. Favorable economic conditions and government regulations supporting insurance market development also contribute to market expansion. The increasing use of mobile devices and expansion of applications for drones further accelerate the market's trajectory.
Challenges in the US Electronic Gadgets Insurance Market Sector
Significant challenges include high claims costs associated with expensive repairs, competition from extended warranties and manufacturer guarantees, and the complexity of assessing risk for new and emerging technologies. Regulatory changes and compliance requirements, coupled with cybersecurity threats and data breaches related to customer information, also pose obstacles. These factors could cause fluctuations in the market growth.
Emerging Opportunities in US Electronic Gadgets Insurance Market
Emerging opportunities are presented by the growing IoT market, the rise of wearable technology, and the expansion of drone usage across various industries. Insurance solutions for new and emerging gadget types offer significant potential, particularly those catering to specific customer demographics and needs. The increasing demand for cyber insurance and data protection also presents opportunities for growth.
Leading Players in the US Electronic Gadgets Insurance Market Market
- AIG
- Progressive
- American Fidelity Assurance
- Allianz Insurance
- Aviva
- AXA
- Chubb
- Assurant Inc
- AT&T Inc
- Amica Mutual Insurance
Key Developments in US Electronic Gadgets Insurance Market Industry
- October 2023: Bolttech and Allianz Partners partnered to launch insurance solutions for embedded devices and appliances in the United States. This collaboration expands the reach of insurance solutions into new areas, potentially broadening the market.
- February 2023: Moonrock Insurance, in collaboration with Apollo Insurance, unveiled an innovative drone insurance offering. This addresses a niche market and highlights the growing demand for insurance solutions tailored to specific gadget types.
Strategic Outlook for US Electronic Gadgets Insurance Market Market
The US electronic gadgets insurance market presents substantial growth potential driven by technology, expanding device adoption, and innovative product offerings. Strategic players can capitalize on emerging trends such as IoT insurance and drone insurance to capture market share. Investing in technology and developing customized products and services will remain crucial for success in this competitive and dynamic landscape. The focus will be on customer experience, and leveraging big data and AI to refine risk assessment and enhance claims management.
US Electronic Gadgets Insurance Market Segmentation
-
1. Coverage Type
- 1.1. Accidental Damage
- 1.2. Theft and Loss
-
2. Device Type
- 2.1. Laptops
- 2.2. Computers
- 2.3. Cameras
- 2.4. Mobile Devices
- 2.5. Drones
-
3. End Users
- 3.1. Corporate
- 3.2. Individual
US Electronic Gadgets Insurance Market Segmentation By Geography
-
1. North America
- 1.1. United States
- 1.2. Canada
- 1.3. Mexico
-
2. South America
- 2.1. Brazil
- 2.2. Argentina
- 2.3. Rest of South America
-
3. Europe
- 3.1. United Kingdom
- 3.2. Germany
- 3.3. France
- 3.4. Italy
- 3.5. Spain
- 3.6. Russia
- 3.7. Benelux
- 3.8. Nordics
- 3.9. Rest of Europe
-
4. Middle East & Africa
- 4.1. Turkey
- 4.2. Israel
- 4.3. GCC
- 4.4. North Africa
- 4.5. South Africa
- 4.6. Rest of Middle East & Africa
-
5. Asia Pacific
- 5.1. China
- 5.2. India
- 5.3. Japan
- 5.4. South Korea
- 5.5. ASEAN
- 5.6. Oceania
- 5.7. Rest of Asia Pacific
US Electronic Gadgets Insurance Market Regional Market Share
Geographic Coverage of US Electronic Gadgets Insurance Market
US Electronic Gadgets Insurance Market REPORT HIGHLIGHTS
| Aspects | Details |
|---|---|
| Study Period | 2020-2034 |
| Base Year | 2025 |
| Estimated Year | 2026 |
| Forecast Period | 2026-2034 |
| Historical Period | 2020-2025 |
| Growth Rate | CAGR of 11.54% from 2020-2034 |
| Segmentation |
|
Table of Contents
- 1. Introduction
- 1.1. Research Scope
- 1.2. Market Segmentation
- 1.3. Research Objective
- 1.4. Definitions and Assumptions
- 2. Executive Summary
- 2.1. Market Snapshot
- 3. Market Dynamics
- 3.1. Market Drivers
- 3.2. Market Restrains
- 3.3. Market Trends
- 3.4. Market Opportunities
- 4. Market Factor Analysis
- 4.1. Porters Five Forces
- 4.1.1. Bargaining Power of Suppliers
- 4.1.2. Bargaining Power of Buyers
- 4.1.3. Threat of New Entrants
- 4.1.4. Threat of Substitutes
- 4.1.5. Competitive Rivalry
- 4.2. PESTEL analysis
- 4.3. BCG Analysis
- 4.3.1. Stars (High Growth, High Market Share)
- 4.3.2. Cash Cows (Low Growth, High Market Share)
- 4.3.3. Question Mark (High Growth, Low Market Share)
- 4.3.4. Dogs (Low Growth, Low Market Share)
- 4.4. Ansoff Matrix Analysis
- 4.5. Supply Chain Analysis
- 4.6. Regulatory Landscape
- 4.7. Current Market Potential and Opportunity Assessment (TAM–SAM–SOM Framework)
- 4.8. RAX Analyst Note
- 4.1. Porters Five Forces
- 5. Market Analysis, Insights and Forecast 2021-2033
- 5.1. Market Analysis, Insights and Forecast - by Coverage Type
- 5.1.1. Accidental Damage
- 5.1.2. Theft and Loss
- 5.2. Market Analysis, Insights and Forecast - by Device Type
- 5.2.1. Laptops
- 5.2.2. Computers
- 5.2.3. Cameras
- 5.2.4. Mobile Devices
- 5.2.5. Drones
- 5.3. Market Analysis, Insights and Forecast - by End Users
- 5.3.1. Corporate
- 5.3.2. Individual
- 5.4. Market Analysis, Insights and Forecast - by Region
- 5.4.1. North America
- 5.4.2. South America
- 5.4.3. Europe
- 5.4.4. Middle East & Africa
- 5.4.5. Asia Pacific
- 5.1. Market Analysis, Insights and Forecast - by Coverage Type
- 6. Global US Electronic Gadgets Insurance Market Analysis, Insights and Forecast, 2021-2033
- 6.1. Market Analysis, Insights and Forecast - by Coverage Type
- 6.1.1. Accidental Damage
- 6.1.2. Theft and Loss
- 6.2. Market Analysis, Insights and Forecast - by Device Type
- 6.2.1. Laptops
- 6.2.2. Computers
- 6.2.3. Cameras
- 6.2.4. Mobile Devices
- 6.2.5. Drones
- 6.3. Market Analysis, Insights and Forecast - by End Users
- 6.3.1. Corporate
- 6.3.2. Individual
- 6.1. Market Analysis, Insights and Forecast - by Coverage Type
- 7. North America US Electronic Gadgets Insurance Market Analysis, Insights and Forecast, 2020-2032
- 7.1. Market Analysis, Insights and Forecast - by Coverage Type
- 7.1.1. Accidental Damage
- 7.1.2. Theft and Loss
- 7.2. Market Analysis, Insights and Forecast - by Device Type
- 7.2.1. Laptops
- 7.2.2. Computers
- 7.2.3. Cameras
- 7.2.4. Mobile Devices
- 7.2.5. Drones
- 7.3. Market Analysis, Insights and Forecast - by End Users
- 7.3.1. Corporate
- 7.3.2. Individual
- 7.1. Market Analysis, Insights and Forecast - by Coverage Type
- 8. South America US Electronic Gadgets Insurance Market Analysis, Insights and Forecast, 2020-2032
- 8.1. Market Analysis, Insights and Forecast - by Coverage Type
- 8.1.1. Accidental Damage
- 8.1.2. Theft and Loss
- 8.2. Market Analysis, Insights and Forecast - by Device Type
- 8.2.1. Laptops
- 8.2.2. Computers
- 8.2.3. Cameras
- 8.2.4. Mobile Devices
- 8.2.5. Drones
- 8.3. Market Analysis, Insights and Forecast - by End Users
- 8.3.1. Corporate
- 8.3.2. Individual
- 8.1. Market Analysis, Insights and Forecast - by Coverage Type
- 9. Europe US Electronic Gadgets Insurance Market Analysis, Insights and Forecast, 2020-2032
- 9.1. Market Analysis, Insights and Forecast - by Coverage Type
- 9.1.1. Accidental Damage
- 9.1.2. Theft and Loss
- 9.2. Market Analysis, Insights and Forecast - by Device Type
- 9.2.1. Laptops
- 9.2.2. Computers
- 9.2.3. Cameras
- 9.2.4. Mobile Devices
- 9.2.5. Drones
- 9.3. Market Analysis, Insights and Forecast - by End Users
- 9.3.1. Corporate
- 9.3.2. Individual
- 9.1. Market Analysis, Insights and Forecast - by Coverage Type
- 10. Middle East & Africa US Electronic Gadgets Insurance Market Analysis, Insights and Forecast, 2020-2032
- 10.1. Market Analysis, Insights and Forecast - by Coverage Type
- 10.1.1. Accidental Damage
- 10.1.2. Theft and Loss
- 10.2. Market Analysis, Insights and Forecast - by Device Type
- 10.2.1. Laptops
- 10.2.2. Computers
- 10.2.3. Cameras
- 10.2.4. Mobile Devices
- 10.2.5. Drones
- 10.3. Market Analysis, Insights and Forecast - by End Users
- 10.3.1. Corporate
- 10.3.2. Individual
- 10.1. Market Analysis, Insights and Forecast - by Coverage Type
- 11. Asia Pacific US Electronic Gadgets Insurance Market Analysis, Insights and Forecast, 2020-2032
- 11.1. Market Analysis, Insights and Forecast - by Coverage Type
- 11.1.1. Accidental Damage
- 11.1.2. Theft and Loss
- 11.2. Market Analysis, Insights and Forecast - by Device Type
- 11.2.1. Laptops
- 11.2.2. Computers
- 11.2.3. Cameras
- 11.2.4. Mobile Devices
- 11.2.5. Drones
- 11.3. Market Analysis, Insights and Forecast - by End Users
- 11.3.1. Corporate
- 11.3.2. Individual
- 11.1. Market Analysis, Insights and Forecast - by Coverage Type
- 12. Competitive Analysis
- 12.1. Company Profiles
- 12.1.1 AIG
- 12.1.1.1. Company Overview
- 12.1.1.2. Products
- 12.1.1.3. Company Financials
- 12.1.1.4. SWOT Analysis
- 12.1.2 Progressive**List Not Exhaustive
- 12.1.2.1. Company Overview
- 12.1.2.2. Products
- 12.1.2.3. Company Financials
- 12.1.2.4. SWOT Analysis
- 12.1.3 American Fidelity Assurance
- 12.1.3.1. Company Overview
- 12.1.3.2. Products
- 12.1.3.3. Company Financials
- 12.1.3.4. SWOT Analysis
- 12.1.4 Allianz Insurance
- 12.1.4.1. Company Overview
- 12.1.4.2. Products
- 12.1.4.3. Company Financials
- 12.1.4.4. SWOT Analysis
- 12.1.5 Aviva
- 12.1.5.1. Company Overview
- 12.1.5.2. Products
- 12.1.5.3. Company Financials
- 12.1.5.4. SWOT Analysis
- 12.1.6 AXA
- 12.1.6.1. Company Overview
- 12.1.6.2. Products
- 12.1.6.3. Company Financials
- 12.1.6.4. SWOT Analysis
- 12.1.7 Chubb
- 12.1.7.1. Company Overview
- 12.1.7.2. Products
- 12.1.7.3. Company Financials
- 12.1.7.4. SWOT Analysis
- 12.1.8 Assurant Inc
- 12.1.8.1. Company Overview
- 12.1.8.2. Products
- 12.1.8.3. Company Financials
- 12.1.8.4. SWOT Analysis
- 12.1.9 AT&T Inc
- 12.1.9.1. Company Overview
- 12.1.9.2. Products
- 12.1.9.3. Company Financials
- 12.1.9.4. SWOT Analysis
- 12.1.10 Amica Mutual Insurance
- 12.1.10.1. Company Overview
- 12.1.10.2. Products
- 12.1.10.3. Company Financials
- 12.1.10.4. SWOT Analysis
- 12.1.1 AIG
- 12.2. Market Entropy
- 12.2.1 Company's Key Areas Served
- 12.2.2 Recent Developments
- 12.3. Company Market Share Analysis 2025
- 12.3.1 Top 5 Companies Market Share Analysis
- 12.3.2 Top 3 Companies Market Share Analysis
- 12.4. List of Potential Customers
- 13. Research Methodology
List of Figures
- Figure 1: Global US Electronic Gadgets Insurance Market Revenue Breakdown (Million, %) by Region 2025 & 2033
- Figure 2: North America US Electronic Gadgets Insurance Market Revenue (Million), by Coverage Type 2025 & 2033
- Figure 3: North America US Electronic Gadgets Insurance Market Revenue Share (%), by Coverage Type 2025 & 2033
- Figure 4: North America US Electronic Gadgets Insurance Market Revenue (Million), by Device Type 2025 & 2033
- Figure 5: North America US Electronic Gadgets Insurance Market Revenue Share (%), by Device Type 2025 & 2033
- Figure 6: North America US Electronic Gadgets Insurance Market Revenue (Million), by End Users 2025 & 2033
- Figure 7: North America US Electronic Gadgets Insurance Market Revenue Share (%), by End Users 2025 & 2033
- Figure 8: North America US Electronic Gadgets Insurance Market Revenue (Million), by Country 2025 & 2033
- Figure 9: North America US Electronic Gadgets Insurance Market Revenue Share (%), by Country 2025 & 2033
- Figure 10: South America US Electronic Gadgets Insurance Market Revenue (Million), by Coverage Type 2025 & 2033
- Figure 11: South America US Electronic Gadgets Insurance Market Revenue Share (%), by Coverage Type 2025 & 2033
- Figure 12: South America US Electronic Gadgets Insurance Market Revenue (Million), by Device Type 2025 & 2033
- Figure 13: South America US Electronic Gadgets Insurance Market Revenue Share (%), by Device Type 2025 & 2033
- Figure 14: South America US Electronic Gadgets Insurance Market Revenue (Million), by End Users 2025 & 2033
- Figure 15: South America US Electronic Gadgets Insurance Market Revenue Share (%), by End Users 2025 & 2033
- Figure 16: South America US Electronic Gadgets Insurance Market Revenue (Million), by Country 2025 & 2033
- Figure 17: South America US Electronic Gadgets Insurance Market Revenue Share (%), by Country 2025 & 2033
- Figure 18: Europe US Electronic Gadgets Insurance Market Revenue (Million), by Coverage Type 2025 & 2033
- Figure 19: Europe US Electronic Gadgets Insurance Market Revenue Share (%), by Coverage Type 2025 & 2033
- Figure 20: Europe US Electronic Gadgets Insurance Market Revenue (Million), by Device Type 2025 & 2033
- Figure 21: Europe US Electronic Gadgets Insurance Market Revenue Share (%), by Device Type 2025 & 2033
- Figure 22: Europe US Electronic Gadgets Insurance Market Revenue (Million), by End Users 2025 & 2033
- Figure 23: Europe US Electronic Gadgets Insurance Market Revenue Share (%), by End Users 2025 & 2033
- Figure 24: Europe US Electronic Gadgets Insurance Market Revenue (Million), by Country 2025 & 2033
- Figure 25: Europe US Electronic Gadgets Insurance Market Revenue Share (%), by Country 2025 & 2033
- Figure 26: Middle East & Africa US Electronic Gadgets Insurance Market Revenue (Million), by Coverage Type 2025 & 2033
- Figure 27: Middle East & Africa US Electronic Gadgets Insurance Market Revenue Share (%), by Coverage Type 2025 & 2033
- Figure 28: Middle East & Africa US Electronic Gadgets Insurance Market Revenue (Million), by Device Type 2025 & 2033
- Figure 29: Middle East & Africa US Electronic Gadgets Insurance Market Revenue Share (%), by Device Type 2025 & 2033
- Figure 30: Middle East & Africa US Electronic Gadgets Insurance Market Revenue (Million), by End Users 2025 & 2033
- Figure 31: Middle East & Africa US Electronic Gadgets Insurance Market Revenue Share (%), by End Users 2025 & 2033
- Figure 32: Middle East & Africa US Electronic Gadgets Insurance Market Revenue (Million), by Country 2025 & 2033
- Figure 33: Middle East & Africa US Electronic Gadgets Insurance Market Revenue Share (%), by Country 2025 & 2033
- Figure 34: Asia Pacific US Electronic Gadgets Insurance Market Revenue (Million), by Coverage Type 2025 & 2033
- Figure 35: Asia Pacific US Electronic Gadgets Insurance Market Revenue Share (%), by Coverage Type 2025 & 2033
- Figure 36: Asia Pacific US Electronic Gadgets Insurance Market Revenue (Million), by Device Type 2025 & 2033
- Figure 37: Asia Pacific US Electronic Gadgets Insurance Market Revenue Share (%), by Device Type 2025 & 2033
- Figure 38: Asia Pacific US Electronic Gadgets Insurance Market Revenue (Million), by End Users 2025 & 2033
- Figure 39: Asia Pacific US Electronic Gadgets Insurance Market Revenue Share (%), by End Users 2025 & 2033
- Figure 40: Asia Pacific US Electronic Gadgets Insurance Market Revenue (Million), by Country 2025 & 2033
- Figure 41: Asia Pacific US Electronic Gadgets Insurance Market Revenue Share (%), by Country 2025 & 2033
List of Tables
- Table 1: Global US Electronic Gadgets Insurance Market Revenue Million Forecast, by Coverage Type 2020 & 2033
- Table 2: Global US Electronic Gadgets Insurance Market Revenue Million Forecast, by Device Type 2020 & 2033
- Table 3: Global US Electronic Gadgets Insurance Market Revenue Million Forecast, by End Users 2020 & 2033
- Table 4: Global US Electronic Gadgets Insurance Market Revenue Million Forecast, by Region 2020 & 2033
- Table 5: Global US Electronic Gadgets Insurance Market Revenue Million Forecast, by Coverage Type 2020 & 2033
- Table 6: Global US Electronic Gadgets Insurance Market Revenue Million Forecast, by Device Type 2020 & 2033
- Table 7: Global US Electronic Gadgets Insurance Market Revenue Million Forecast, by End Users 2020 & 2033
- Table 8: Global US Electronic Gadgets Insurance Market Revenue Million Forecast, by Country 2020 & 2033
- Table 9: United States US Electronic Gadgets Insurance Market Revenue (Million) Forecast, by Application 2020 & 2033
- Table 10: Canada US Electronic Gadgets Insurance Market Revenue (Million) Forecast, by Application 2020 & 2033
- Table 11: Mexico US Electronic Gadgets Insurance Market Revenue (Million) Forecast, by Application 2020 & 2033
- Table 12: Global US Electronic Gadgets Insurance Market Revenue Million Forecast, by Coverage Type 2020 & 2033
- Table 13: Global US Electronic Gadgets Insurance Market Revenue Million Forecast, by Device Type 2020 & 2033
- Table 14: Global US Electronic Gadgets Insurance Market Revenue Million Forecast, by End Users 2020 & 2033
- Table 15: Global US Electronic Gadgets Insurance Market Revenue Million Forecast, by Country 2020 & 2033
- Table 16: Brazil US Electronic Gadgets Insurance Market Revenue (Million) Forecast, by Application 2020 & 2033
- Table 17: Argentina US Electronic Gadgets Insurance Market Revenue (Million) Forecast, by Application 2020 & 2033
- Table 18: Rest of South America US Electronic Gadgets Insurance Market Revenue (Million) Forecast, by Application 2020 & 2033
- Table 19: Global US Electronic Gadgets Insurance Market Revenue Million Forecast, by Coverage Type 2020 & 2033
- Table 20: Global US Electronic Gadgets Insurance Market Revenue Million Forecast, by Device Type 2020 & 2033
- Table 21: Global US Electronic Gadgets Insurance Market Revenue Million Forecast, by End Users 2020 & 2033
- Table 22: Global US Electronic Gadgets Insurance Market Revenue Million Forecast, by Country 2020 & 2033
- Table 23: United Kingdom US Electronic Gadgets Insurance Market Revenue (Million) Forecast, by Application 2020 & 2033
- Table 24: Germany US Electronic Gadgets Insurance Market Revenue (Million) Forecast, by Application 2020 & 2033
- Table 25: France US Electronic Gadgets Insurance Market Revenue (Million) Forecast, by Application 2020 & 2033
- Table 26: Italy US Electronic Gadgets Insurance Market Revenue (Million) Forecast, by Application 2020 & 2033
- Table 27: Spain US Electronic Gadgets Insurance Market Revenue (Million) Forecast, by Application 2020 & 2033
- Table 28: Russia US Electronic Gadgets Insurance Market Revenue (Million) Forecast, by Application 2020 & 2033
- Table 29: Benelux US Electronic Gadgets Insurance Market Revenue (Million) Forecast, by Application 2020 & 2033
- Table 30: Nordics US Electronic Gadgets Insurance Market Revenue (Million) Forecast, by Application 2020 & 2033
- Table 31: Rest of Europe US Electronic Gadgets Insurance Market Revenue (Million) Forecast, by Application 2020 & 2033
- Table 32: Global US Electronic Gadgets Insurance Market Revenue Million Forecast, by Coverage Type 2020 & 2033
- Table 33: Global US Electronic Gadgets Insurance Market Revenue Million Forecast, by Device Type 2020 & 2033
- Table 34: Global US Electronic Gadgets Insurance Market Revenue Million Forecast, by End Users 2020 & 2033
- Table 35: Global US Electronic Gadgets Insurance Market Revenue Million Forecast, by Country 2020 & 2033
- Table 36: Turkey US Electronic Gadgets Insurance Market Revenue (Million) Forecast, by Application 2020 & 2033
- Table 37: Israel US Electronic Gadgets Insurance Market Revenue (Million) Forecast, by Application 2020 & 2033
- Table 38: GCC US Electronic Gadgets Insurance Market Revenue (Million) Forecast, by Application 2020 & 2033
- Table 39: North Africa US Electronic Gadgets Insurance Market Revenue (Million) Forecast, by Application 2020 & 2033
- Table 40: South Africa US Electronic Gadgets Insurance Market Revenue (Million) Forecast, by Application 2020 & 2033
- Table 41: Rest of Middle East & Africa US Electronic Gadgets Insurance Market Revenue (Million) Forecast, by Application 2020 & 2033
- Table 42: Global US Electronic Gadgets Insurance Market Revenue Million Forecast, by Coverage Type 2020 & 2033
- Table 43: Global US Electronic Gadgets Insurance Market Revenue Million Forecast, by Device Type 2020 & 2033
- Table 44: Global US Electronic Gadgets Insurance Market Revenue Million Forecast, by End Users 2020 & 2033
- Table 45: Global US Electronic Gadgets Insurance Market Revenue Million Forecast, by Country 2020 & 2033
- Table 46: China US Electronic Gadgets Insurance Market Revenue (Million) Forecast, by Application 2020 & 2033
- Table 47: India US Electronic Gadgets Insurance Market Revenue (Million) Forecast, by Application 2020 & 2033
- Table 48: Japan US Electronic Gadgets Insurance Market Revenue (Million) Forecast, by Application 2020 & 2033
- Table 49: South Korea US Electronic Gadgets Insurance Market Revenue (Million) Forecast, by Application 2020 & 2033
- Table 50: ASEAN US Electronic Gadgets Insurance Market Revenue (Million) Forecast, by Application 2020 & 2033
- Table 51: Oceania US Electronic Gadgets Insurance Market Revenue (Million) Forecast, by Application 2020 & 2033
- Table 52: Rest of Asia Pacific US Electronic Gadgets Insurance Market Revenue (Million) Forecast, by Application 2020 & 2033
Frequently Asked Questions
1. What is the projected Compound Annual Growth Rate (CAGR) of the US Electronic Gadgets Insurance Market?
The projected CAGR is approximately 11.54%.
2. Which companies are prominent players in the US Electronic Gadgets Insurance Market?
Key companies in the market include AIG, Progressive**List Not Exhaustive, American Fidelity Assurance, Allianz Insurance, Aviva, AXA, Chubb, Assurant Inc, AT&T Inc, Amica Mutual Insurance.
3. What are the main segments of the US Electronic Gadgets Insurance Market?
The market segments include Coverage Type, Device Type, End Users.
4. Can you provide details about the market size?
The market size is estimated to be USD 19.58 Million as of 2022.
5. What are some drivers contributing to market growth?
Increse in Consumer spending for Electronic gadgets.; Rising living living standard of the the people.
6. What are the notable trends driving market growth?
Increase In Demand For Electronic Gadget Post Pandemic.
7. Are there any restraints impacting market growth?
Fluctuation in price of electronic gadgets raw material.; Fragmented market in electronic gadgets insurance business.
8. Can you provide examples of recent developments in the market?
In October 2023, Bolttech and Allianz Partners partnered to launch insurance solutions for embedded devices and appliances in the United States.
9. What pricing options are available for accessing the report?
Pricing options include single-user, multi-user, and enterprise licenses priced at USD 3800, USD 4500, and USD 5800 respectively.
10. Is the market size provided in terms of value or volume?
The market size is provided in terms of value, measured in Million.
11. Are there any specific market keywords associated with the report?
Yes, the market keyword associated with the report is "US Electronic Gadgets Insurance Market," which aids in identifying and referencing the specific market segment covered.
12. How do I determine which pricing option suits my needs best?
The pricing options vary based on user requirements and access needs. Individual users may opt for single-user licenses, while businesses requiring broader access may choose multi-user or enterprise licenses for cost-effective access to the report.
13. Are there any additional resources or data provided in the US Electronic Gadgets Insurance Market report?
While the report offers comprehensive insights, it's advisable to review the specific contents or supplementary materials provided to ascertain if additional resources or data are available.
14. How can I stay updated on further developments or reports in the US Electronic Gadgets Insurance Market?
To stay informed about further developments, trends, and reports in the US Electronic Gadgets Insurance Market, consider subscribing to industry newsletters, following relevant companies and organizations, or regularly checking reputable industry news sources and publications.
Methodology
Step 1 - Identification of Relevant Samples Size from Population Database


Step 2 - Approaches for Defining Global Market Size (Value, Volume* & Price*)

Note*: In applicable scenarios
Step 3 - Data Sources
Primary Research
- Web Analytics
- Survey Reports
- Research Institute
- Latest Research Reports
- Opinion Leaders
Secondary Research
- Annual Reports
- White Paper
- Latest Press Release
- Industry Association
- Paid Database
- Investor Presentations

Step 4 - Data Triangulation
Involves using different sources of information in order to increase the validity of a study
These sources are likely to be stakeholders in a program - participants, other researchers, program staff, other community members, and so on.
Then we put all data in single framework & apply various statistical tools to find out the dynamic on the market.
During the analysis stage, feedback from the stakeholder groups would be compared to determine areas of agreement as well as areas of divergence