Key Insights
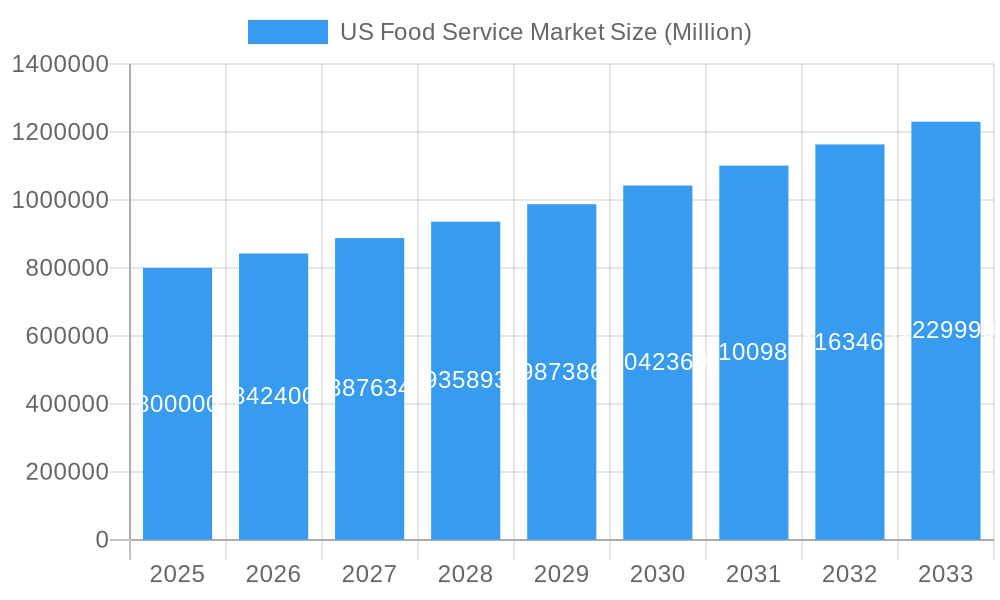
The US food service market, a dynamic and expansive sector, is projected to experience robust growth over the forecast period (2025-2033). With a 2025 market size estimated at $800 billion (based on a CAGR of 5.35% and considering typical industry growth rates), the market is driven by several key factors. Increasing disposable incomes, changing consumer lifestyles favoring convenience and dining out, and the proliferation of diverse culinary options across various service formats (QSR, cafes, bars) fuel this expansion. Growth is further stimulated by technological advancements in online ordering, delivery platforms, and restaurant management systems. The market is segmented by cuisine type (e.g., Mexican, fast-casual, pizza), outlet type (chained vs. independent), location (standalone, retail, leisure), and food service type (cafes, bars). Major players like McDonald's, Starbucks, Chipotle, and Yum! Brands exert significant influence, shaping market trends and driving innovation. However, factors like rising food costs, labor shortages, and increasing competition could pose challenges.
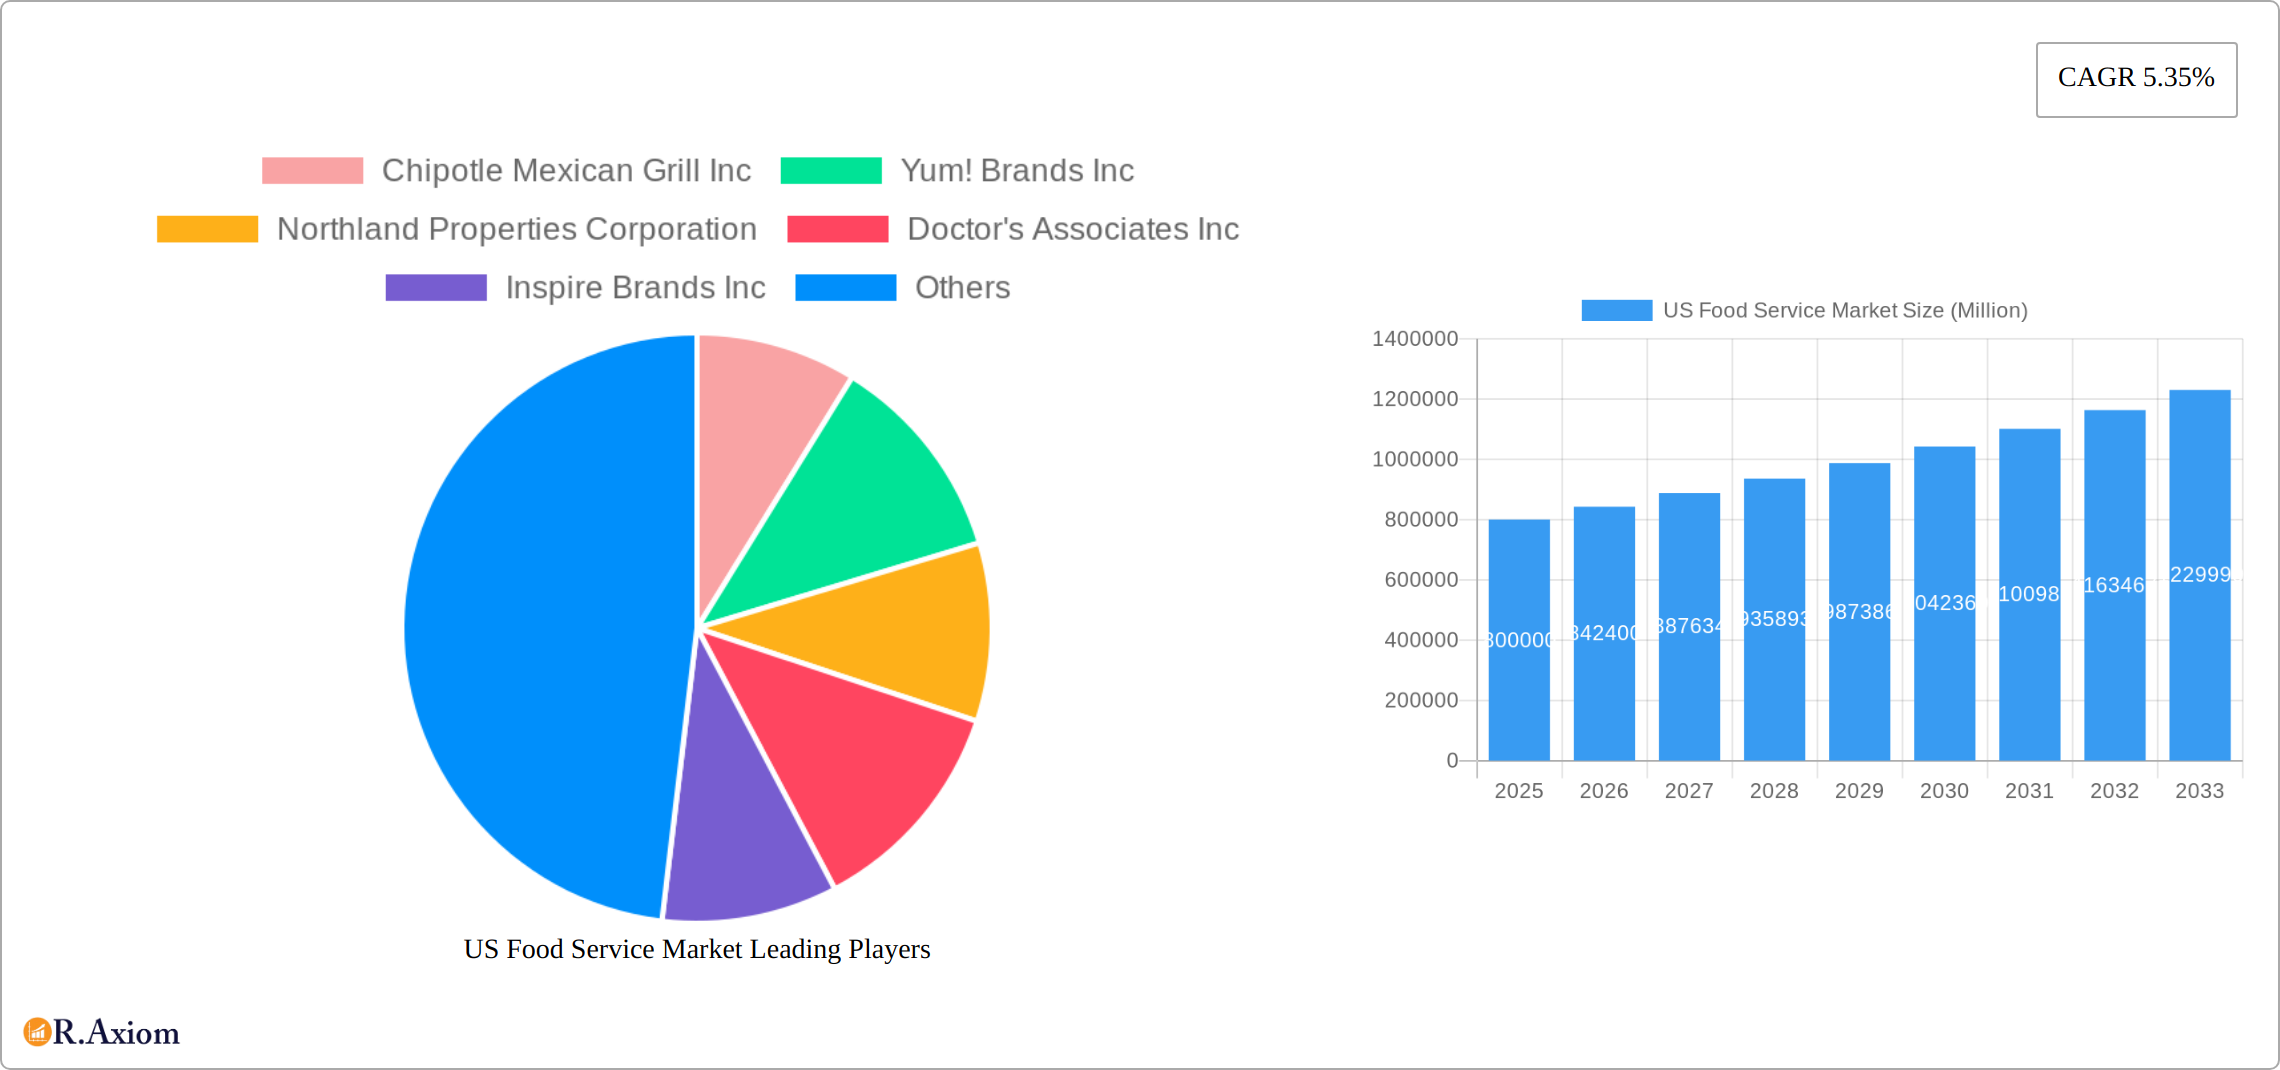
US Food Service Market Market Size (In Billion)
Despite these challenges, the market's resilience is evident in its consistent growth trajectory. Regional variations exist, with states like California, Texas, and New York likely accounting for a significant portion of the overall market size due to their large populations and high concentrations of restaurants. The future success of food service businesses will hinge on adapting to consumer preferences, embracing technological advancements, and implementing efficient operational strategies to navigate economic fluctuations and maintain profitability. Strategies like personalized marketing, loyalty programs, and diversifying menu offerings to cater to health-conscious and adventurous consumers will be crucial for continued success within this competitive landscape. The forecast anticipates that the market will continue its trajectory, reaching well over a trillion dollars by 2033.
US Food Service Market Company Market Share
US Food Service Market: A Comprehensive Report (2019-2033)
This detailed report provides a comprehensive analysis of the US Food Service Market, offering invaluable insights for industry stakeholders, investors, and strategic decision-makers. Covering the period from 2019 to 2033, with a focus on 2025, this report unveils the market's dynamics, key players, and future trajectory. The report leverages rigorous data analysis to project a robust forecast (2025-2033), supported by historical data (2019-2024) and current market trends.
US Food Service Market Market Concentration & Innovation
The US food service market exhibits a high degree of concentration, with a few major players commanding significant market share. Market leaders such as McDonald's Corporation and Yum! Brands Inc. benefit from extensive brand recognition, established supply chains, and economies of scale. However, smaller, niche players are also thriving through innovative offerings and targeted marketing. The market’s competitive landscape is further shaped by frequent mergers and acquisitions (M&A), driving consolidation and influencing market dynamics. For example, the M&A deal value in 2024 reached xx Million, reflecting the significant investment in market expansion and brand diversification. Innovation in the sector is fueled by technological advancements, including digital ordering systems, personalized menu options, and data-driven insights for enhancing customer experience and operational efficiency. Regulatory frameworks, such as food safety regulations and labor laws, also influence market behavior. Meanwhile, evolving consumer preferences, particularly for healthier and more sustainable food options, are compelling companies to adapt their offerings and adopt responsible sourcing practices. Product substitutes, such as meal kits and home-cooked meals, exert a competitive pressure, requiring the industry to continually innovate to maintain market share.
- Market Share: McDonald's Corporation holds approximately xx% market share in 2025. Yum! Brands Inc. holds approximately xx%.
- M&A Deal Values (2024): xx Million
- Key Innovation Drivers: Technological advancements, changing consumer preferences, and evolving regulatory landscape.
US Food Service Market Industry Trends & Insights
The US Food Service market is characterized by robust growth, driven by several key factors. The rising disposable incomes, coupled with changing lifestyles and increasing urbanization, are leading to a greater demand for convenient and diverse food options. Technological disruptions, including mobile ordering, online delivery platforms, and personalized recommendations, have significantly impacted the sector. The market is experiencing increased penetration of digital technologies, with xx% of consumers utilizing mobile ordering in 2025. Consumer preferences are shifting towards healthier, sustainable, and ethically sourced food options, driving demand for organic, plant-based, and locally sourced ingredients. Competitive dynamics are characterized by intense rivalry, particularly among large national chains and regional players. This competition manifests through price wars, promotional offers, and continuous innovation in menu offerings and service models. The compound annual growth rate (CAGR) for the US Food Service market during the forecast period (2025-2033) is estimated to be xx%. Market penetration of various QSR cuisines is also experiencing a rise, with xx% market penetration for Other QSR Cuisines in 2025.
Dominant Markets & Segments in US Food Service Market
The US Food Service market showcases dominance across various segments. Chained outlets hold a significantly larger market share compared to independent outlets, owing to their established brand recognition, economies of scale, and efficient operational models. Standalone locations represent a major segment, driven by ease of access and consumer preference. The retail segment is experiencing significant growth, fueled by the increasing demand for convenient food options in grocery stores and other retail settings. The Cafes & Bars segment exhibits dynamism, driven by the preference for social dining experiences and the growth of specialty coffee shops and craft breweries. Growth is also seen in the Leisure and Travel segments, facilitated by the expanding tourism sector and increased consumer spending on recreational activities.
- Key Drivers for Chained Outlets: Economies of scale, brand recognition, efficient operations.
- Key Drivers for Standalone Locations: Accessibility, convenience for consumers.
- Key Drivers for Retail Segment: Increasing demand for convenient food options in retail settings.
- Key Drivers for Cafes & Bars: Growing demand for social dining experiences, expanding specialty coffee and craft beer markets.
US Food Service Market Product Developments
The US Food Service market witnesses continuous product innovations focused on enhancing customer experience, improving efficiency, and catering to evolving consumer preferences. This includes the integration of technology in ordering systems, personalized menu options through data analytics, and expansion of delivery services. Companies are emphasizing healthier, plant-based, and sustainable options to cater to health-conscious consumers. These product developments often leverage technological advancements, such as AI-powered recommendation systems and automated kitchen equipment, to enhance speed, efficiency and cost-effectiveness. The successful market fit hinges on providing value through convenience, taste, customization and affordability.
Report Scope & Segmentation Analysis
This report segments the US Food Service market based on Outlet type (Chained Outlets, Independent Outlets), Location (Leisure, Lodging, Retail, Standalone, Travel), Foodservice Type (Cafes & Bars), and Other QSR Cuisines. Each segment's growth projections, market size, and competitive dynamics are analyzed, providing a detailed understanding of the market's structure and potential. Growth projections for Chained Outlets are higher than for Independent Outlets due to their ability to reach a wider audience and leverage marketing and supply chain efficiencies. Market size for Standalone Locations is significant given their widespread presence and consumer preference. The Cafes & Bars segment experiences strong growth due to the evolving trends in dining preferences. Other QSR Cuisines segment growth is driven by consumer interest in diverse culinary experiences.
Key Drivers of US Food Service Market Growth
Several factors fuel the growth of the US Food Service market. Rising disposable incomes allow consumers to spend more on dining out. The increasing urbanization trend leads to a higher demand for convenient food options. Technological advancements, such as online ordering and delivery platforms, enhance accessibility and convenience. Favorable government policies and regulations also support market expansion. The growing preference for diverse culinary experiences further drives market growth.
Challenges in the US Food Service Market Sector
The US Food Service market faces significant headwinds, primarily driven by escalating labor costs which directly impact profitability. Supply chain vulnerabilities continue to cause ingredient shortages and operational disruptions. The intensely competitive landscape necessitates innovative strategies and agile adaptation to maintain market share. Furthermore, stringent food safety and hygiene regulations demand substantial investments in compliance, adding to operational expenses. Finally, macroeconomic fluctuations, particularly economic downturns, can significantly reduce consumer discretionary spending on dining out, directly impacting overall market revenue and growth.
Emerging Opportunities in US Food Service Market
Despite the challenges, several compelling opportunities are emerging within the US Food Service market. The explosive growth of food delivery services offers unparalleled convenience to consumers, driving demand for efficient delivery infrastructure and partnerships. The increasing desire for personalized dining experiences presents lucrative avenues for customized menu options, targeted marketing campaigns, and data-driven menu engineering. The rising popularity of health-conscious food choices presents significant opportunities for businesses offering organic, plant-based, sustainable, and ethically sourced food items. Finally, technological advancements, encompassing AI-powered recommendation systems, automated kitchen equipment, and sophisticated point-of-sale systems, offer potential for enhanced operational efficiency, cost reduction, and improved customer service.
Leading Players in the US Food Service Market Market
- Chipotle Mexican Grill Inc
- Yum! Brands Inc
- Northland Properties Corporation
- Doctor's Associates Inc
- Inspire Brands Inc
- Seven & I Holdings Co Ltd
- Brinker International Inc
- Darden Restaurants Inc
- The Wendy's Company
- Domino's Pizza Inc
- Starbucks Corporation
- Papa John's International Inc
- Restaurant Brands International Inc
- McDonald's Corporation
- Bloomin' Brands Inc
- MTY Food Group Inc
Key Developments in US Food Service Market Industry
- November 2022: Papa John's strategically expanded its presence by opening its 500th restaurant featuring a Chipotlane®-style drive-thru in Louisville, Kentucky, highlighting its commitment to digital ordering and enhanced convenience.
- December 2022: MTY Food Group Inc. significantly broadened its portfolio and market reach through the acquisition of Wetzel’s Pretzels, strengthening its position in the fast-casual segment.
- January 2023: Bloomin' Brands invested in modernizing its brand image and enhancing customer experience through a comprehensive redesign of its Outback Steakhouse locations.
- Ongoing Trends: The industry is witnessing a strong focus on ghost kitchens, the rise of cloud kitchens and virtual brands, and increased investment in sustainable and ethical sourcing practices.
Strategic Outlook for US Food Service Market Market
The US Food Service market is poised for continued growth, driven by evolving consumer preferences, technological advancements, and strategic investments by major players. Opportunities lie in leveraging data analytics for personalized customer experiences, expanding into new markets and segments, and focusing on sustainable and health-conscious food options. The market's future trajectory will depend on factors such as economic stability, technological innovation and adaptation to shifting consumer demands. The focus on enhancing customer experience through technology and innovative food offerings will determine the success of businesses in this competitive market.
US Food Service Market Segmentation
-
1. Foodservice Type
-
1.1. Cafes & Bars
-
1.1.1. By Cuisine
- 1.1.1.1. Bars & Pubs
- 1.1.1.2. Juice/Smoothie/Desserts Bars
- 1.1.1.3. Specialist Coffee & Tea Shops
-
1.1.1. By Cuisine
- 1.2. Cloud Kitchen
-
1.3. Full Service Restaurants
- 1.3.1. Asian
- 1.3.2. European
- 1.3.3. Latin American
- 1.3.4. Middle Eastern
- 1.3.5. North American
- 1.3.6. Other FSR Cuisines
-
1.4. Quick Service Restaurants
- 1.4.1. Bakeries
- 1.4.2. Burger
- 1.4.3. Ice Cream
- 1.4.4. Meat-based Cuisines
- 1.4.5. Pizza
- 1.4.6. Other QSR Cuisines
-
1.1. Cafes & Bars
-
2. Outlet
- 2.1. Chained Outlets
- 2.2. Independent Outlets
-
3. Location
- 3.1. Leisure
- 3.2. Lodging
- 3.3. Retail
- 3.4. Standalone
- 3.5. Travel
US Food Service Market Segmentation By Geography
-
1. North America
- 1.1. United States
- 1.2. Canada
- 1.3. Mexico
-
2. South America
- 2.1. Brazil
- 2.2. Argentina
- 2.3. Rest of South America
-
3. Europe
- 3.1. United Kingdom
- 3.2. Germany
- 3.3. France
- 3.4. Italy
- 3.5. Spain
- 3.6. Russia
- 3.7. Benelux
- 3.8. Nordics
- 3.9. Rest of Europe
-
4. Middle East & Africa
- 4.1. Turkey
- 4.2. Israel
- 4.3. GCC
- 4.4. North Africa
- 4.5. South Africa
- 4.6. Rest of Middle East & Africa
-
5. Asia Pacific
- 5.1. China
- 5.2. India
- 5.3. Japan
- 5.4. South Korea
- 5.5. ASEAN
- 5.6. Oceania
- 5.7. Rest of Asia Pacific
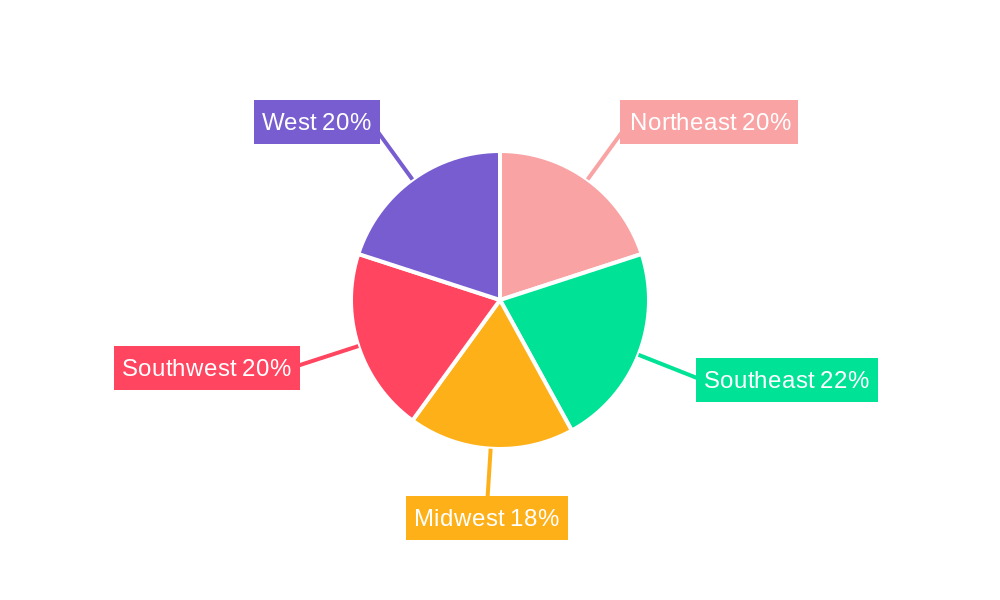
US Food Service Market Regional Market Share
Geographic Coverage of US Food Service Market
US Food Service Market REPORT HIGHLIGHTS
| Aspects | Details |
|---|---|
| Study Period | 2020-2034 |
| Base Year | 2025 |
| Estimated Year | 2026 |
| Forecast Period | 2026-2034 |
| Historical Period | 2020-2025 |
| Growth Rate | CAGR of 5.93% from 2020-2034 |
| Segmentation |
|
Table of Contents
- 1. Introduction
- 1.1. Research Scope
- 1.2. Market Segmentation
- 1.3. Research Methodology
- 1.4. Definitions and Assumptions
- 2. Executive Summary
- 2.1. Introduction
- 3. Market Dynamics
- 3.1. Introduction
- 3.2. Market Drivers
- 3.2.1. Growing Inclination Towards Vegan/Plant-based Protein Sources; Increasing Demand for Functional Protein Beverages
- 3.3. Market Restrains
- 3.3.1. Competition from Substitute Products
- 3.4. Market Trends
- 3.4.1 The introduction of vegan
- 3.4.2 low-sugar
- 3.4.3 and gluten-free options has fuelled the full-service restaurant's growth
- 4. Market Factor Analysis
- 4.1. Porters Five Forces
- 4.2. Supply/Value Chain
- 4.3. PESTEL analysis
- 4.4. Market Entropy
- 4.5. Patent/Trademark Analysis
- 5. Global US Food Service Market Analysis, Insights and Forecast, 2020-2032
- 5.1. Market Analysis, Insights and Forecast - by Foodservice Type
- 5.1.1. Cafes & Bars
- 5.1.1.1. By Cuisine
- 5.1.1.1.1. Bars & Pubs
- 5.1.1.1.2. Juice/Smoothie/Desserts Bars
- 5.1.1.1.3. Specialist Coffee & Tea Shops
- 5.1.1.1. By Cuisine
- 5.1.2. Cloud Kitchen
- 5.1.3. Full Service Restaurants
- 5.1.3.1. Asian
- 5.1.3.2. European
- 5.1.3.3. Latin American
- 5.1.3.4. Middle Eastern
- 5.1.3.5. North American
- 5.1.3.6. Other FSR Cuisines
- 5.1.4. Quick Service Restaurants
- 5.1.4.1. Bakeries
- 5.1.4.2. Burger
- 5.1.4.3. Ice Cream
- 5.1.4.4. Meat-based Cuisines
- 5.1.4.5. Pizza
- 5.1.4.6. Other QSR Cuisines
- 5.1.1. Cafes & Bars
- 5.2. Market Analysis, Insights and Forecast - by Outlet
- 5.2.1. Chained Outlets
- 5.2.2. Independent Outlets
- 5.3. Market Analysis, Insights and Forecast - by Location
- 5.3.1. Leisure
- 5.3.2. Lodging
- 5.3.3. Retail
- 5.3.4. Standalone
- 5.3.5. Travel
- 5.4. Market Analysis, Insights and Forecast - by Region
- 5.4.1. North America
- 5.4.2. South America
- 5.4.3. Europe
- 5.4.4. Middle East & Africa
- 5.4.5. Asia Pacific
- 5.1. Market Analysis, Insights and Forecast - by Foodservice Type
- 6. North America US Food Service Market Analysis, Insights and Forecast, 2020-2032
- 6.1. Market Analysis, Insights and Forecast - by Foodservice Type
- 6.1.1. Cafes & Bars
- 6.1.1.1. By Cuisine
- 6.1.1.1.1. Bars & Pubs
- 6.1.1.1.2. Juice/Smoothie/Desserts Bars
- 6.1.1.1.3. Specialist Coffee & Tea Shops
- 6.1.1.1. By Cuisine
- 6.1.2. Cloud Kitchen
- 6.1.3. Full Service Restaurants
- 6.1.3.1. Asian
- 6.1.3.2. European
- 6.1.3.3. Latin American
- 6.1.3.4. Middle Eastern
- 6.1.3.5. North American
- 6.1.3.6. Other FSR Cuisines
- 6.1.4. Quick Service Restaurants
- 6.1.4.1. Bakeries
- 6.1.4.2. Burger
- 6.1.4.3. Ice Cream
- 6.1.4.4. Meat-based Cuisines
- 6.1.4.5. Pizza
- 6.1.4.6. Other QSR Cuisines
- 6.1.1. Cafes & Bars
- 6.2. Market Analysis, Insights and Forecast - by Outlet
- 6.2.1. Chained Outlets
- 6.2.2. Independent Outlets
- 6.3. Market Analysis, Insights and Forecast - by Location
- 6.3.1. Leisure
- 6.3.2. Lodging
- 6.3.3. Retail
- 6.3.4. Standalone
- 6.3.5. Travel
- 6.1. Market Analysis, Insights and Forecast - by Foodservice Type
- 7. South America US Food Service Market Analysis, Insights and Forecast, 2020-2032
- 7.1. Market Analysis, Insights and Forecast - by Foodservice Type
- 7.1.1. Cafes & Bars
- 7.1.1.1. By Cuisine
- 7.1.1.1.1. Bars & Pubs
- 7.1.1.1.2. Juice/Smoothie/Desserts Bars
- 7.1.1.1.3. Specialist Coffee & Tea Shops
- 7.1.1.1. By Cuisine
- 7.1.2. Cloud Kitchen
- 7.1.3. Full Service Restaurants
- 7.1.3.1. Asian
- 7.1.3.2. European
- 7.1.3.3. Latin American
- 7.1.3.4. Middle Eastern
- 7.1.3.5. North American
- 7.1.3.6. Other FSR Cuisines
- 7.1.4. Quick Service Restaurants
- 7.1.4.1. Bakeries
- 7.1.4.2. Burger
- 7.1.4.3. Ice Cream
- 7.1.4.4. Meat-based Cuisines
- 7.1.4.5. Pizza
- 7.1.4.6. Other QSR Cuisines
- 7.1.1. Cafes & Bars
- 7.2. Market Analysis, Insights and Forecast - by Outlet
- 7.2.1. Chained Outlets
- 7.2.2. Independent Outlets
- 7.3. Market Analysis, Insights and Forecast - by Location
- 7.3.1. Leisure
- 7.3.2. Lodging
- 7.3.3. Retail
- 7.3.4. Standalone
- 7.3.5. Travel
- 7.1. Market Analysis, Insights and Forecast - by Foodservice Type
- 8. Europe US Food Service Market Analysis, Insights and Forecast, 2020-2032
- 8.1. Market Analysis, Insights and Forecast - by Foodservice Type
- 8.1.1. Cafes & Bars
- 8.1.1.1. By Cuisine
- 8.1.1.1.1. Bars & Pubs
- 8.1.1.1.2. Juice/Smoothie/Desserts Bars
- 8.1.1.1.3. Specialist Coffee & Tea Shops
- 8.1.1.1. By Cuisine
- 8.1.2. Cloud Kitchen
- 8.1.3. Full Service Restaurants
- 8.1.3.1. Asian
- 8.1.3.2. European
- 8.1.3.3. Latin American
- 8.1.3.4. Middle Eastern
- 8.1.3.5. North American
- 8.1.3.6. Other FSR Cuisines
- 8.1.4. Quick Service Restaurants
- 8.1.4.1. Bakeries
- 8.1.4.2. Burger
- 8.1.4.3. Ice Cream
- 8.1.4.4. Meat-based Cuisines
- 8.1.4.5. Pizza
- 8.1.4.6. Other QSR Cuisines
- 8.1.1. Cafes & Bars
- 8.2. Market Analysis, Insights and Forecast - by Outlet
- 8.2.1. Chained Outlets
- 8.2.2. Independent Outlets
- 8.3. Market Analysis, Insights and Forecast - by Location
- 8.3.1. Leisure
- 8.3.2. Lodging
- 8.3.3. Retail
- 8.3.4. Standalone
- 8.3.5. Travel
- 8.1. Market Analysis, Insights and Forecast - by Foodservice Type
- 9. Middle East & Africa US Food Service Market Analysis, Insights and Forecast, 2020-2032
- 9.1. Market Analysis, Insights and Forecast - by Foodservice Type
- 9.1.1. Cafes & Bars
- 9.1.1.1. By Cuisine
- 9.1.1.1.1. Bars & Pubs
- 9.1.1.1.2. Juice/Smoothie/Desserts Bars
- 9.1.1.1.3. Specialist Coffee & Tea Shops
- 9.1.1.1. By Cuisine
- 9.1.2. Cloud Kitchen
- 9.1.3. Full Service Restaurants
- 9.1.3.1. Asian
- 9.1.3.2. European
- 9.1.3.3. Latin American
- 9.1.3.4. Middle Eastern
- 9.1.3.5. North American
- 9.1.3.6. Other FSR Cuisines
- 9.1.4. Quick Service Restaurants
- 9.1.4.1. Bakeries
- 9.1.4.2. Burger
- 9.1.4.3. Ice Cream
- 9.1.4.4. Meat-based Cuisines
- 9.1.4.5. Pizza
- 9.1.4.6. Other QSR Cuisines
- 9.1.1. Cafes & Bars
- 9.2. Market Analysis, Insights and Forecast - by Outlet
- 9.2.1. Chained Outlets
- 9.2.2. Independent Outlets
- 9.3. Market Analysis, Insights and Forecast - by Location
- 9.3.1. Leisure
- 9.3.2. Lodging
- 9.3.3. Retail
- 9.3.4. Standalone
- 9.3.5. Travel
- 9.1. Market Analysis, Insights and Forecast - by Foodservice Type
- 10. Asia Pacific US Food Service Market Analysis, Insights and Forecast, 2020-2032
- 10.1. Market Analysis, Insights and Forecast - by Foodservice Type
- 10.1.1. Cafes & Bars
- 10.1.1.1. By Cuisine
- 10.1.1.1.1. Bars & Pubs
- 10.1.1.1.2. Juice/Smoothie/Desserts Bars
- 10.1.1.1.3. Specialist Coffee & Tea Shops
- 10.1.1.1. By Cuisine
- 10.1.2. Cloud Kitchen
- 10.1.3. Full Service Restaurants
- 10.1.3.1. Asian
- 10.1.3.2. European
- 10.1.3.3. Latin American
- 10.1.3.4. Middle Eastern
- 10.1.3.5. North American
- 10.1.3.6. Other FSR Cuisines
- 10.1.4. Quick Service Restaurants
- 10.1.4.1. Bakeries
- 10.1.4.2. Burger
- 10.1.4.3. Ice Cream
- 10.1.4.4. Meat-based Cuisines
- 10.1.4.5. Pizza
- 10.1.4.6. Other QSR Cuisines
- 10.1.1. Cafes & Bars
- 10.2. Market Analysis, Insights and Forecast - by Outlet
- 10.2.1. Chained Outlets
- 10.2.2. Independent Outlets
- 10.3. Market Analysis, Insights and Forecast - by Location
- 10.3.1. Leisure
- 10.3.2. Lodging
- 10.3.3. Retail
- 10.3.4. Standalone
- 10.3.5. Travel
- 10.1. Market Analysis, Insights and Forecast - by Foodservice Type
- 11. Competitive Analysis
- 11.1. Global Market Share Analysis 2025
- 11.2. Company Profiles
- 11.2.1 Chipotle Mexican Grill Inc
- 11.2.1.1. Overview
- 11.2.1.2. Products
- 11.2.1.3. SWOT Analysis
- 11.2.1.4. Recent Developments
- 11.2.1.5. Financials (Based on Availability)
- 11.2.2 Yum! Brands Inc
- 11.2.2.1. Overview
- 11.2.2.2. Products
- 11.2.2.3. SWOT Analysis
- 11.2.2.4. Recent Developments
- 11.2.2.5. Financials (Based on Availability)
- 11.2.3 Northland Properties Corporation
- 11.2.3.1. Overview
- 11.2.3.2. Products
- 11.2.3.3. SWOT Analysis
- 11.2.3.4. Recent Developments
- 11.2.3.5. Financials (Based on Availability)
- 11.2.4 Doctor's Associates Inc
- 11.2.4.1. Overview
- 11.2.4.2. Products
- 11.2.4.3. SWOT Analysis
- 11.2.4.4. Recent Developments
- 11.2.4.5. Financials (Based on Availability)
- 11.2.5 Inspire Brands Inc
- 11.2.5.1. Overview
- 11.2.5.2. Products
- 11.2.5.3. SWOT Analysis
- 11.2.5.4. Recent Developments
- 11.2.5.5. Financials (Based on Availability)
- 11.2.6 Seven & I Holdings Co Ltd
- 11.2.6.1. Overview
- 11.2.6.2. Products
- 11.2.6.3. SWOT Analysis
- 11.2.6.4. Recent Developments
- 11.2.6.5. Financials (Based on Availability)
- 11.2.7 Brinker International Inc
- 11.2.7.1. Overview
- 11.2.7.2. Products
- 11.2.7.3. SWOT Analysis
- 11.2.7.4. Recent Developments
- 11.2.7.5. Financials (Based on Availability)
- 11.2.8 Darden Restaurants Inc
- 11.2.8.1. Overview
- 11.2.8.2. Products
- 11.2.8.3. SWOT Analysis
- 11.2.8.4. Recent Developments
- 11.2.8.5. Financials (Based on Availability)
- 11.2.9 The Wendy's Company
- 11.2.9.1. Overview
- 11.2.9.2. Products
- 11.2.9.3. SWOT Analysis
- 11.2.9.4. Recent Developments
- 11.2.9.5. Financials (Based on Availability)
- 11.2.10 Domino's Pizza Inc
- 11.2.10.1. Overview
- 11.2.10.2. Products
- 11.2.10.3. SWOT Analysis
- 11.2.10.4. Recent Developments
- 11.2.10.5. Financials (Based on Availability)
- 11.2.11 Starbucks Corporation
- 11.2.11.1. Overview
- 11.2.11.2. Products
- 11.2.11.3. SWOT Analysis
- 11.2.11.4. Recent Developments
- 11.2.11.5. Financials (Based on Availability)
- 11.2.12 Papa John's International Inc
- 11.2.12.1. Overview
- 11.2.12.2. Products
- 11.2.12.3. SWOT Analysis
- 11.2.12.4. Recent Developments
- 11.2.12.5. Financials (Based on Availability)
- 11.2.13 Restaurant Brands International Inc
- 11.2.13.1. Overview
- 11.2.13.2. Products
- 11.2.13.3. SWOT Analysis
- 11.2.13.4. Recent Developments
- 11.2.13.5. Financials (Based on Availability)
- 11.2.14 McDonald's Corporation
- 11.2.14.1. Overview
- 11.2.14.2. Products
- 11.2.14.3. SWOT Analysis
- 11.2.14.4. Recent Developments
- 11.2.14.5. Financials (Based on Availability)
- 11.2.15 Bloomin' Brands Inc
- 11.2.15.1. Overview
- 11.2.15.2. Products
- 11.2.15.3. SWOT Analysis
- 11.2.15.4. Recent Developments
- 11.2.15.5. Financials (Based on Availability)
- 11.2.16 MTY Food Group Inc
- 11.2.16.1. Overview
- 11.2.16.2. Products
- 11.2.16.3. SWOT Analysis
- 11.2.16.4. Recent Developments
- 11.2.16.5. Financials (Based on Availability)
- 11.2.1 Chipotle Mexican Grill Inc
List of Figures
- Figure 1: Global US Food Service Market Revenue Breakdown (undefined, %) by Region 2025 & 2033
- Figure 2: North America US Food Service Market Revenue (undefined), by Foodservice Type 2025 & 2033
- Figure 3: North America US Food Service Market Revenue Share (%), by Foodservice Type 2025 & 2033
- Figure 4: North America US Food Service Market Revenue (undefined), by Outlet 2025 & 2033
- Figure 5: North America US Food Service Market Revenue Share (%), by Outlet 2025 & 2033
- Figure 6: North America US Food Service Market Revenue (undefined), by Location 2025 & 2033
- Figure 7: North America US Food Service Market Revenue Share (%), by Location 2025 & 2033
- Figure 8: North America US Food Service Market Revenue (undefined), by Country 2025 & 2033
- Figure 9: North America US Food Service Market Revenue Share (%), by Country 2025 & 2033
- Figure 10: South America US Food Service Market Revenue (undefined), by Foodservice Type 2025 & 2033
- Figure 11: South America US Food Service Market Revenue Share (%), by Foodservice Type 2025 & 2033
- Figure 12: South America US Food Service Market Revenue (undefined), by Outlet 2025 & 2033
- Figure 13: South America US Food Service Market Revenue Share (%), by Outlet 2025 & 2033
- Figure 14: South America US Food Service Market Revenue (undefined), by Location 2025 & 2033
- Figure 15: South America US Food Service Market Revenue Share (%), by Location 2025 & 2033
- Figure 16: South America US Food Service Market Revenue (undefined), by Country 2025 & 2033
- Figure 17: South America US Food Service Market Revenue Share (%), by Country 2025 & 2033
- Figure 18: Europe US Food Service Market Revenue (undefined), by Foodservice Type 2025 & 2033
- Figure 19: Europe US Food Service Market Revenue Share (%), by Foodservice Type 2025 & 2033
- Figure 20: Europe US Food Service Market Revenue (undefined), by Outlet 2025 & 2033
- Figure 21: Europe US Food Service Market Revenue Share (%), by Outlet 2025 & 2033
- Figure 22: Europe US Food Service Market Revenue (undefined), by Location 2025 & 2033
- Figure 23: Europe US Food Service Market Revenue Share (%), by Location 2025 & 2033
- Figure 24: Europe US Food Service Market Revenue (undefined), by Country 2025 & 2033
- Figure 25: Europe US Food Service Market Revenue Share (%), by Country 2025 & 2033
- Figure 26: Middle East & Africa US Food Service Market Revenue (undefined), by Foodservice Type 2025 & 2033
- Figure 27: Middle East & Africa US Food Service Market Revenue Share (%), by Foodservice Type 2025 & 2033
- Figure 28: Middle East & Africa US Food Service Market Revenue (undefined), by Outlet 2025 & 2033
- Figure 29: Middle East & Africa US Food Service Market Revenue Share (%), by Outlet 2025 & 2033
- Figure 30: Middle East & Africa US Food Service Market Revenue (undefined), by Location 2025 & 2033
- Figure 31: Middle East & Africa US Food Service Market Revenue Share (%), by Location 2025 & 2033
- Figure 32: Middle East & Africa US Food Service Market Revenue (undefined), by Country 2025 & 2033
- Figure 33: Middle East & Africa US Food Service Market Revenue Share (%), by Country 2025 & 2033
- Figure 34: Asia Pacific US Food Service Market Revenue (undefined), by Foodservice Type 2025 & 2033
- Figure 35: Asia Pacific US Food Service Market Revenue Share (%), by Foodservice Type 2025 & 2033
- Figure 36: Asia Pacific US Food Service Market Revenue (undefined), by Outlet 2025 & 2033
- Figure 37: Asia Pacific US Food Service Market Revenue Share (%), by Outlet 2025 & 2033
- Figure 38: Asia Pacific US Food Service Market Revenue (undefined), by Location 2025 & 2033
- Figure 39: Asia Pacific US Food Service Market Revenue Share (%), by Location 2025 & 2033
- Figure 40: Asia Pacific US Food Service Market Revenue (undefined), by Country 2025 & 2033
- Figure 41: Asia Pacific US Food Service Market Revenue Share (%), by Country 2025 & 2033
List of Tables
- Table 1: Global US Food Service Market Revenue undefined Forecast, by Foodservice Type 2020 & 2033
- Table 2: Global US Food Service Market Revenue undefined Forecast, by Outlet 2020 & 2033
- Table 3: Global US Food Service Market Revenue undefined Forecast, by Location 2020 & 2033
- Table 4: Global US Food Service Market Revenue undefined Forecast, by Region 2020 & 2033
- Table 5: Global US Food Service Market Revenue undefined Forecast, by Foodservice Type 2020 & 2033
- Table 6: Global US Food Service Market Revenue undefined Forecast, by Outlet 2020 & 2033
- Table 7: Global US Food Service Market Revenue undefined Forecast, by Location 2020 & 2033
- Table 8: Global US Food Service Market Revenue undefined Forecast, by Country 2020 & 2033
- Table 9: United States US Food Service Market Revenue (undefined) Forecast, by Application 2020 & 2033
- Table 10: Canada US Food Service Market Revenue (undefined) Forecast, by Application 2020 & 2033
- Table 11: Mexico US Food Service Market Revenue (undefined) Forecast, by Application 2020 & 2033
- Table 12: Global US Food Service Market Revenue undefined Forecast, by Foodservice Type 2020 & 2033
- Table 13: Global US Food Service Market Revenue undefined Forecast, by Outlet 2020 & 2033
- Table 14: Global US Food Service Market Revenue undefined Forecast, by Location 2020 & 2033
- Table 15: Global US Food Service Market Revenue undefined Forecast, by Country 2020 & 2033
- Table 16: Brazil US Food Service Market Revenue (undefined) Forecast, by Application 2020 & 2033
- Table 17: Argentina US Food Service Market Revenue (undefined) Forecast, by Application 2020 & 2033
- Table 18: Rest of South America US Food Service Market Revenue (undefined) Forecast, by Application 2020 & 2033
- Table 19: Global US Food Service Market Revenue undefined Forecast, by Foodservice Type 2020 & 2033
- Table 20: Global US Food Service Market Revenue undefined Forecast, by Outlet 2020 & 2033
- Table 21: Global US Food Service Market Revenue undefined Forecast, by Location 2020 & 2033
- Table 22: Global US Food Service Market Revenue undefined Forecast, by Country 2020 & 2033
- Table 23: United Kingdom US Food Service Market Revenue (undefined) Forecast, by Application 2020 & 2033
- Table 24: Germany US Food Service Market Revenue (undefined) Forecast, by Application 2020 & 2033
- Table 25: France US Food Service Market Revenue (undefined) Forecast, by Application 2020 & 2033
- Table 26: Italy US Food Service Market Revenue (undefined) Forecast, by Application 2020 & 2033
- Table 27: Spain US Food Service Market Revenue (undefined) Forecast, by Application 2020 & 2033
- Table 28: Russia US Food Service Market Revenue (undefined) Forecast, by Application 2020 & 2033
- Table 29: Benelux US Food Service Market Revenue (undefined) Forecast, by Application 2020 & 2033
- Table 30: Nordics US Food Service Market Revenue (undefined) Forecast, by Application 2020 & 2033
- Table 31: Rest of Europe US Food Service Market Revenue (undefined) Forecast, by Application 2020 & 2033
- Table 32: Global US Food Service Market Revenue undefined Forecast, by Foodservice Type 2020 & 2033
- Table 33: Global US Food Service Market Revenue undefined Forecast, by Outlet 2020 & 2033
- Table 34: Global US Food Service Market Revenue undefined Forecast, by Location 2020 & 2033
- Table 35: Global US Food Service Market Revenue undefined Forecast, by Country 2020 & 2033
- Table 36: Turkey US Food Service Market Revenue (undefined) Forecast, by Application 2020 & 2033
- Table 37: Israel US Food Service Market Revenue (undefined) Forecast, by Application 2020 & 2033
- Table 38: GCC US Food Service Market Revenue (undefined) Forecast, by Application 2020 & 2033
- Table 39: North Africa US Food Service Market Revenue (undefined) Forecast, by Application 2020 & 2033
- Table 40: South Africa US Food Service Market Revenue (undefined) Forecast, by Application 2020 & 2033
- Table 41: Rest of Middle East & Africa US Food Service Market Revenue (undefined) Forecast, by Application 2020 & 2033
- Table 42: Global US Food Service Market Revenue undefined Forecast, by Foodservice Type 2020 & 2033
- Table 43: Global US Food Service Market Revenue undefined Forecast, by Outlet 2020 & 2033
- Table 44: Global US Food Service Market Revenue undefined Forecast, by Location 2020 & 2033
- Table 45: Global US Food Service Market Revenue undefined Forecast, by Country 2020 & 2033
- Table 46: China US Food Service Market Revenue (undefined) Forecast, by Application 2020 & 2033
- Table 47: India US Food Service Market Revenue (undefined) Forecast, by Application 2020 & 2033
- Table 48: Japan US Food Service Market Revenue (undefined) Forecast, by Application 2020 & 2033
- Table 49: South Korea US Food Service Market Revenue (undefined) Forecast, by Application 2020 & 2033
- Table 50: ASEAN US Food Service Market Revenue (undefined) Forecast, by Application 2020 & 2033
- Table 51: Oceania US Food Service Market Revenue (undefined) Forecast, by Application 2020 & 2033
- Table 52: Rest of Asia Pacific US Food Service Market Revenue (undefined) Forecast, by Application 2020 & 2033
Frequently Asked Questions
1. What is the projected Compound Annual Growth Rate (CAGR) of the US Food Service Market?
The projected CAGR is approximately 5.93%.
2. Which companies are prominent players in the US Food Service Market?
Key companies in the market include Chipotle Mexican Grill Inc, Yum! Brands Inc, Northland Properties Corporation, Doctor's Associates Inc, Inspire Brands Inc, Seven & I Holdings Co Ltd, Brinker International Inc, Darden Restaurants Inc, The Wendy's Company, Domino's Pizza Inc, Starbucks Corporation, Papa John's International Inc, Restaurant Brands International Inc, McDonald's Corporation, Bloomin' Brands Inc, MTY Food Group Inc.
3. What are the main segments of the US Food Service Market?
The market segments include Foodservice Type, Outlet, Location.
4. Can you provide details about the market size?
The market size is estimated to be USD XXX N/A as of 2022.
5. What are some drivers contributing to market growth?
Growing Inclination Towards Vegan/Plant-based Protein Sources; Increasing Demand for Functional Protein Beverages.
6. What are the notable trends driving market growth?
The introduction of vegan. low-sugar. and gluten-free options has fuelled the full-service restaurant's growth.
7. Are there any restraints impacting market growth?
Competition from Substitute Products.
8. Can you provide examples of recent developments in the market?
January 2023: Bloomin' Brands declared that its brand Outback Steakhouse opened its redesigned stores in Spring's Grand Parkway Marketplace.December 2022: MTY Food Group Inc., one of its wholly owned subsidiaries, acquired all of the issued and outstanding shares of COP WP Parent Inc. (Wetzel’s Pretzels) from CenterOak Partners. Wetzel’s Pretzels is an American chain of fast-food restaurants specializing in pretzels and hot dogs, operating in the United States, Canada, and Central America.November 2022: Papa John's opened its 500th restaurant with a Chipotlane®, the brand's digital order drive-thru pick-up lane in Louisville, United States.
9. What pricing options are available for accessing the report?
Pricing options include single-user, multi-user, and enterprise licenses priced at USD 3800, USD 4500, and USD 5800 respectively.
10. Is the market size provided in terms of value or volume?
The market size is provided in terms of value, measured in N/A.
11. Are there any specific market keywords associated with the report?
Yes, the market keyword associated with the report is "US Food Service Market," which aids in identifying and referencing the specific market segment covered.
12. How do I determine which pricing option suits my needs best?
The pricing options vary based on user requirements and access needs. Individual users may opt for single-user licenses, while businesses requiring broader access may choose multi-user or enterprise licenses for cost-effective access to the report.
13. Are there any additional resources or data provided in the US Food Service Market report?
While the report offers comprehensive insights, it's advisable to review the specific contents or supplementary materials provided to ascertain if additional resources or data are available.
14. How can I stay updated on further developments or reports in the US Food Service Market?
To stay informed about further developments, trends, and reports in the US Food Service Market, consider subscribing to industry newsletters, following relevant companies and organizations, or regularly checking reputable industry news sources and publications.
Methodology
Step 1 - Identification of Relevant Samples Size from Population Database


Step 2 - Approaches for Defining Global Market Size (Value, Volume* & Price*)

Note*: In applicable scenarios
Step 3 - Data Sources
Primary Research
- Web Analytics
- Survey Reports
- Research Institute
- Latest Research Reports
- Opinion Leaders
Secondary Research
- Annual Reports
- White Paper
- Latest Press Release
- Industry Association
- Paid Database
- Investor Presentations

Step 4 - Data Triangulation
Involves using different sources of information in order to increase the validity of a study
These sources are likely to be stakeholders in a program - participants, other researchers, program staff, other community members, and so on.
Then we put all data in single framework & apply various statistical tools to find out the dynamic on the market.
During the analysis stage, feedback from the stakeholder groups would be compared to determine areas of agreement as well as areas of divergence

