

Key Insights
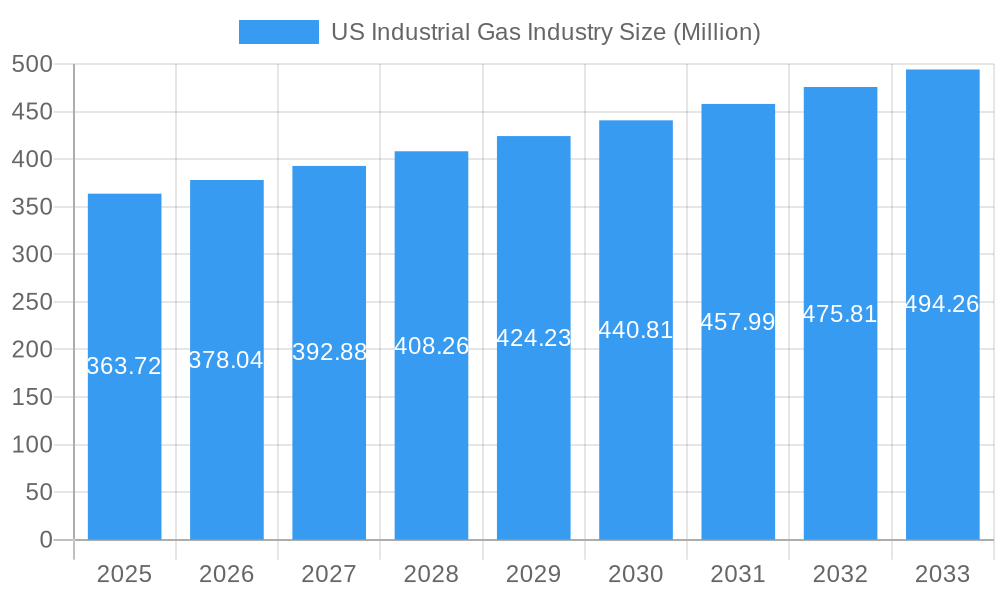
The US industrial gas market, valued at $363.72 million in 2025, is projected to experience steady growth, driven by increasing demand across key end-user industries. A compound annual growth rate (CAGR) of 3.79% from 2025 to 2033 signifies a robust market expansion, fueled primarily by the burgeoning oil and gas sector, the expanding petrochemical and chemical manufacturing industry, and the growth of the energy and power generation sectors. These industries heavily rely on gases like nitrogen, oxygen, hydrogen, and argon for various processes, including refining, processing, and power generation. Furthermore, the medical and pharmaceutical sectors are contributing to growth through increased demand for high-purity gases in manufacturing and research. Growth is also expected in food and beverage processing due to the use of industrial gases in packaging, freezing, and other preservation techniques. While challenges such as fluctuating raw material prices and stringent environmental regulations may act as restraints, technological advancements in gas production and delivery, alongside increasing adoption of efficient and sustainable industrial practices, are expected to mitigate these effects.
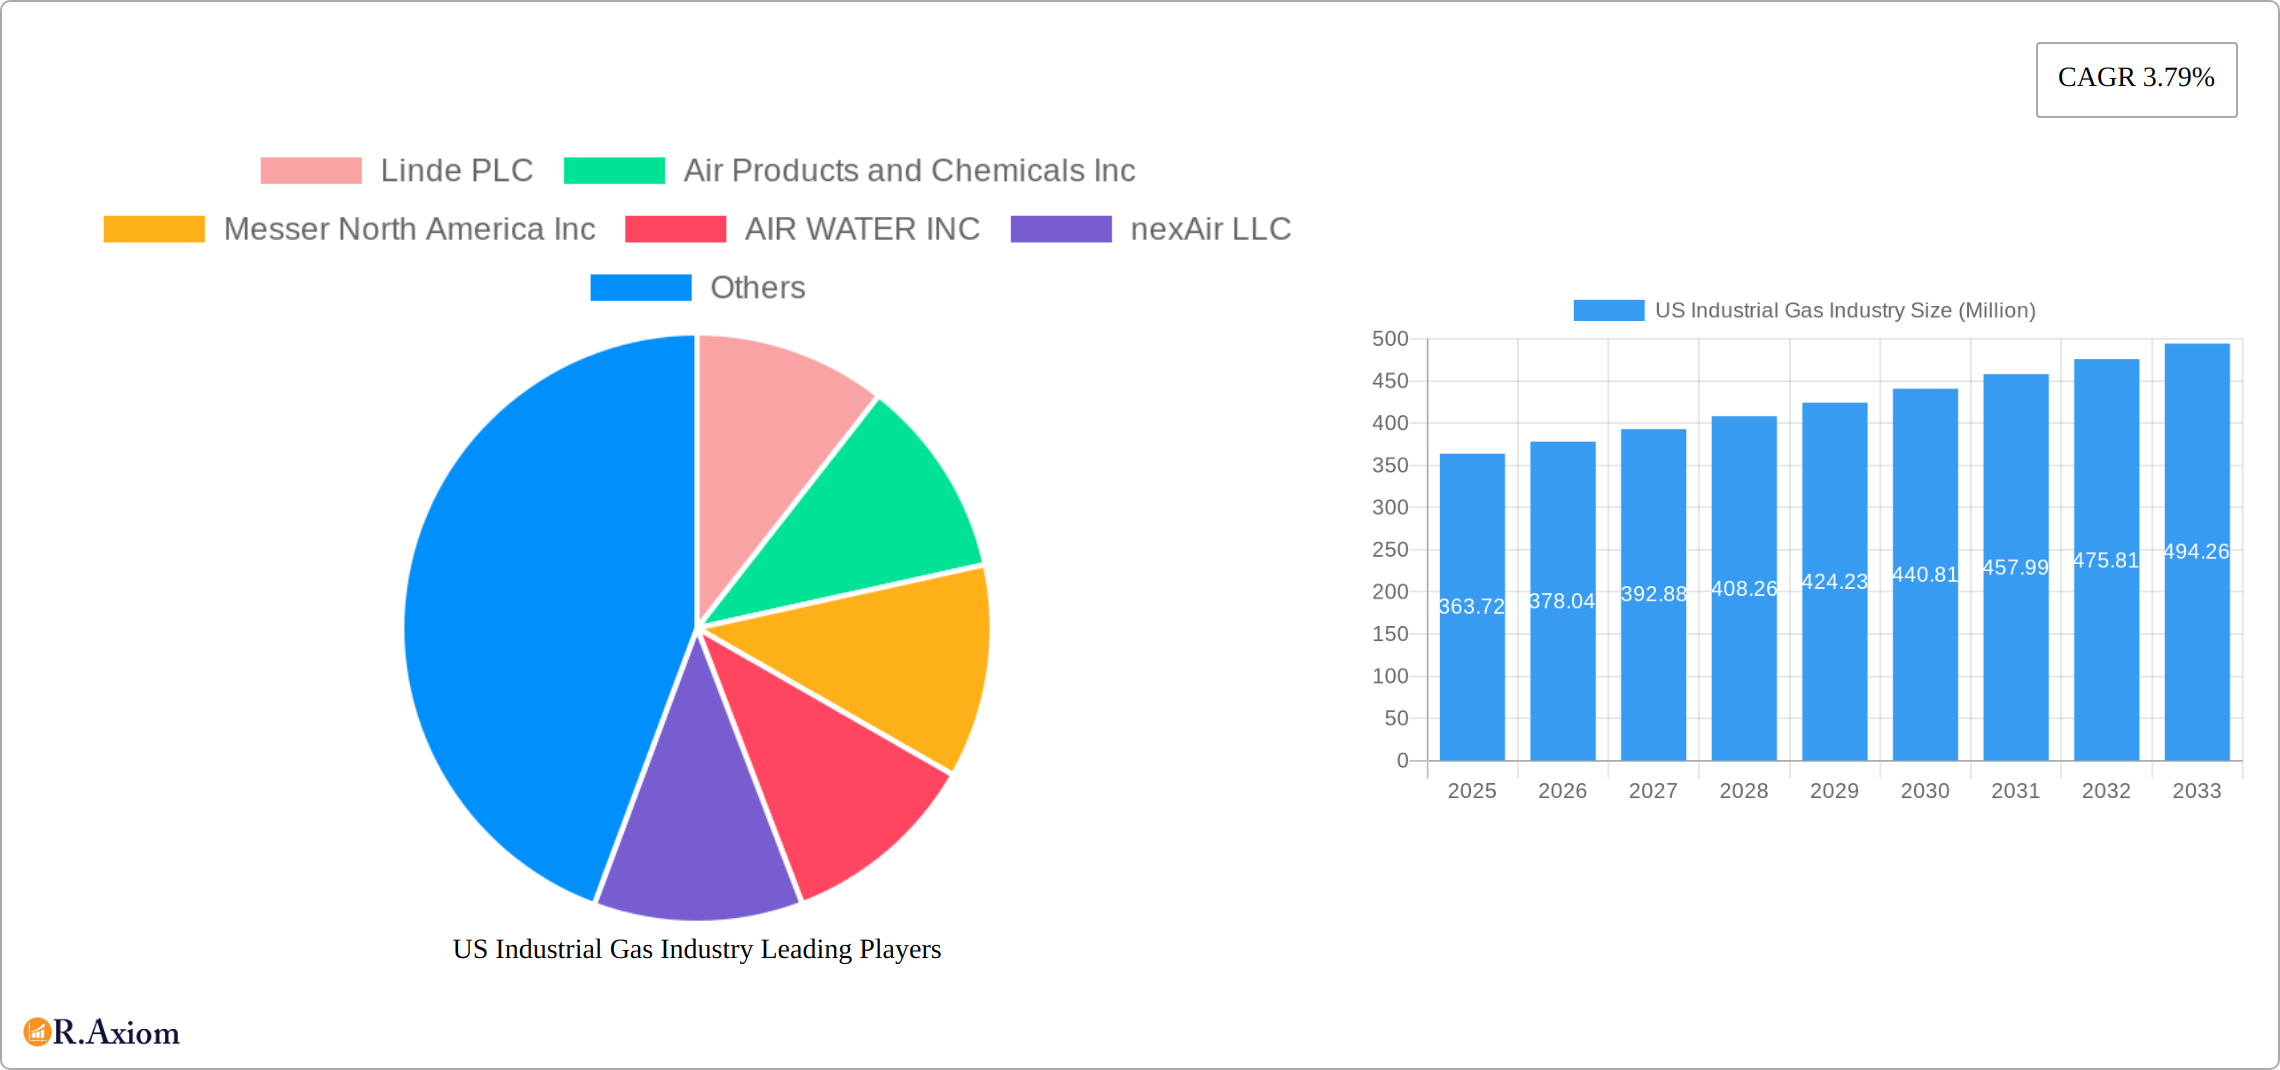
US Industrial Gas Industry Market Size (In Million)
The market segmentation reveals a diverse landscape. Nitrogen, oxygen, and carbon dioxide represent the largest product segments, while the oil and gas sector is the dominant end-user industry. However, growth is anticipated across other segments, including medical and pharmaceutical, and food and beverage, reflecting the increasing applications of industrial gases in diverse sectors. The competitive landscape features both large multinational corporations like Linde PLC, Air Products and Chemicals Inc., and Air Liquide, along with smaller, regional players. This competitive dynamic contributes to innovation and efficient service delivery within the market. Regional analysis suggests variations in growth rates across the US, with potentially higher growth in regions experiencing significant industrial expansion. This presents opportunities for strategic investments and localized market penetration for companies serving the US industrial gas market.
US Industrial Gas Industry Company Market Share
US Industrial Gas Industry: Market Analysis & Forecast 2019-2033
This comprehensive report provides a detailed analysis of the US industrial gas industry, covering market size, segmentation, key players, growth drivers, and future outlook. The study period spans from 2019 to 2033, with 2025 as the base year and estimated year. The report offers invaluable insights for industry stakeholders, investors, and strategic decision-makers.
US Industrial Gas Industry Market Concentration & Innovation
The US industrial gas market is moderately concentrated, dominated by a few multinational corporations. Linde PLC, Air Products and Chemicals Inc., and Air Liquide command substantial market share, collectively exceeding [Insert Updated Percentage]% in 2025. Other significant players include Messer North America Inc., AIR WATER INC, nexAir LLC, and Matheson Tri-Gas Inc., although their individual shares are smaller than the top three. This concentrated structure stems from the significant capital investment needed for production facilities and extensive distribution networks. The industry's high barriers to entry further contribute to this consolidated market landscape.
Innovation within the US industrial gas industry is driven by the need for enhanced efficiency, reduced environmental impact, and the discovery of novel applications for industrial gases. Stringent regulatory frameworks, such as EPA emission standards and comprehensive safety regulations, strongly influence technological advancements, prompting the adoption of cleaner production processes and robust safety features. The rise of alternative energy sources, notably hydrogen, is fueling innovation in gas production and delivery, leading to the development of new technologies and infrastructure. Furthermore, mergers and acquisitions (M&A) activity has played a crucial role in consolidating the market and accelerating the pace of innovation by integrating diverse technologies and broadening market reach. This trend reflects the strategic importance of scale and technological diversification within the sector.
Recent years have witnessed significant M&A deals, totaling approximately $[Insert Updated Value] billion (2019-2024), indicating a clear consolidation trend. These transactions, including the multi-billion dollar deals and the acquisition of Aspen Air US, LLC by Iwatani Corporation, highlight the strategic interest in market expansion and technological integration. This activity not only shapes the market structure but also fuels innovation by bringing together complementary expertise and resources.
US Industrial Gas Industry Industry Trends & Insights
The US industrial gas market is poised for robust growth, driven by rising demand across various end-user industries. The compound annual growth rate (CAGR) during the forecast period (2025-2033) is projected to be xx%, fueled by expanding industrial activity, particularly within the Oil & Gas, Energy & Power, and Chemical Manufacturing sectors. Technological disruptions, such as the adoption of advanced gas separation techniques and the increasing use of renewable energy sources for gas production, are reshaping the competitive landscape.
Consumer preferences are increasingly favoring sustainable and environmentally friendly solutions, leading to increased demand for gases produced using renewable energy sources and reduced carbon footprint practices. Competitive dynamics are primarily shaped by pricing strategies, technological advancements, and customer relationship management, with the major players investing heavily in R&D and expanding their geographical reach. Market penetration is high in established industrial clusters, but untapped potential exists in emerging markets and underserved regions, particularly those with growing industrial activity.
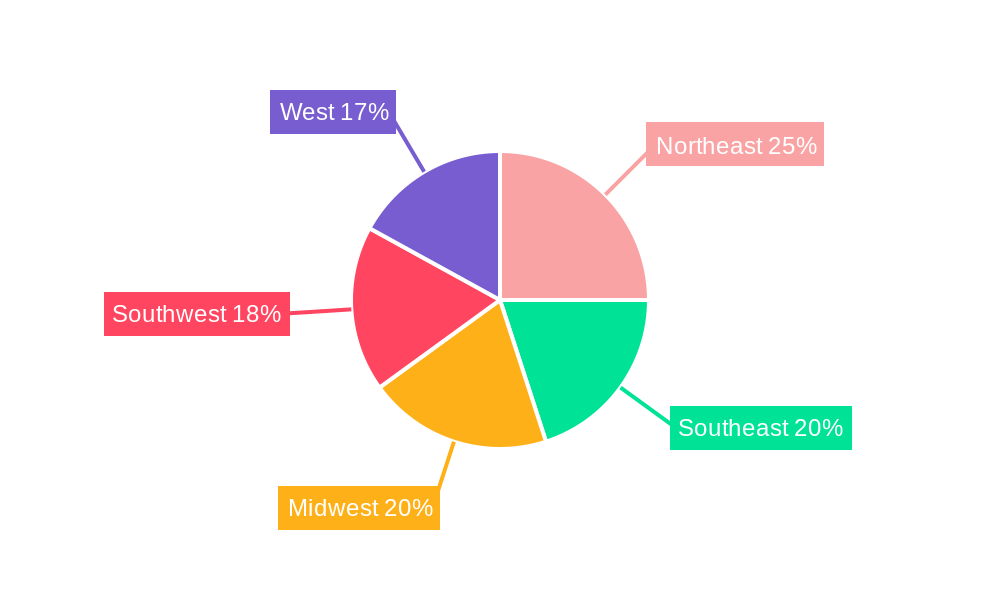
Dominant Markets & Segments in US Industrial Gas Industry
Leading Region: The Midwest and South regions, with their established industrial bases and strong manufacturing sectors, hold the largest market share in the US industrial gas market.
Dominant Product Type: Nitrogen and Oxygen account for the largest volume share, driven by their extensive applications in various industries, from manufacturing and food processing to healthcare and energy production. Hydrogen's market share is expected to grow significantly in the coming years, propelled by the expanding hydrogen economy and associated applications.
Leading End-User Industry: The Oil & Gas, Chemical Manufacturing, and Energy & Power sectors are currently the largest consumers of industrial gases in the US. Growth in these industries directly correlates with the growth of the industrial gas market.
Key drivers within these dominant segments include:
- Strong economic growth within targeted industries.
- Robust government policies supporting infrastructure development and industrial expansion.
- Increasing investments in research and development.
The dominance analysis reveals a strong correlation between the growth of key end-user industries and the overall demand for industrial gases. This interdependence highlights the strategic importance of this industry to the US economy.
US Industrial Gas Industry Product Developments
Recent product innovations focus on enhancing gas purity, improving delivery efficiency, and incorporating sustainable practices. For example, several companies are now offering gases produced from renewable energy sources, satisfying the growing demand for environmentally friendly solutions. Advances in gas separation and purification technologies are also enhancing the efficiency of gas production. This trend is creating competitive advantages by delivering higher-purity gases and improving overall operational efficiency. These developments are shaping market trends by reducing production costs and expanding applications across various industries.
Report Scope & Segmentation Analysis
This report provides a comprehensive segmentation of the US industrial gas market based on product type (Nitrogen, Oxygen, Carbon Dioxide, Hydrogen, Helium, Argon, Ammonia, Methane, Propane, Butane, and Other Product Types) and end-user industry (Oil and Gas, Energy and Power, Petrochemical and Chemical Manufacturing, Medical and Pharmaceutical, Food and Beverage, Metal Manufacturing and Fabrication, Transportation, and Other End-User Industries). The report delves into each segment's growth projections, market size, and competitive landscape, highlighting the variations in growth rates across different segments. These variations reflect the diverse expansion rates and unique technological trends within each end-user sector.
Key Drivers of US Industrial Gas Industry Growth
The US industrial gas market's growth is propelled by several factors. Technological advancements, such as efficient gas separation techniques, have reduced production costs and enhanced product quality. Strong economic growth in major end-user industries has driven up demand. Furthermore, favorable government policies that support industrial expansion and infrastructure development further contribute to market growth. The increasing adoption of renewable energy sources in gas production is also bolstering market expansion.
Challenges in the US Industrial Gas Industry Sector
The US industrial gas industry faces numerous challenges, including volatile energy prices directly affecting production costs, increasingly stringent environmental regulations mandating continuous investment in emission reduction technologies, and fierce competition from both domestic and international players. Supply chain disruptions can also cause production bottlenecks and price volatility, creating an environment prone to uncertainty. These combined challenges necessitate adaptable and resilient strategies to navigate the complexities of the market. The estimated cumulative impact of these challenges on overall market growth is projected to be a reduction of [Insert Updated Percentage]% over the forecast period.
Emerging Opportunities in US Industrial Gas Industry
Emerging opportunities lie in the expanding hydrogen economy, the growing demand for high-purity gases in specialized applications, and the increasing use of industrial gases in emerging technologies. The expansion into new applications, especially within renewable energy and sustainable technologies, presents significant growth potential. Furthermore, the increasing focus on sustainable practices and reducing environmental impact offers opportunities for gas providers who adopt eco-friendly production methods.
Leading Players in the US Industrial Gas Industry Market
- Linde PLC
- Air Products and Chemicals Inc
- Messer North America Inc
- AIR WATER INC
- nexAir LLC
- Matheson Tri-Gas Inc
- BASF SE
- Iwatani Corporation
- NIPPON SANSO HOLDINGS CORPORATION
- Air Liquide
- UIG
Key Developments in US Industrial Gas Industry Industry
- May 2022: Air Liquide's USD 250 Million investment in a large-scale liquid hydrogen production facility in Nevada underscores the industry's strategic shift towards renewable energy sources and its commitment to serving the expanding hydrogen mobility sector. This exemplifies a proactive response to environmental concerns and market demands.
- January 2023: Iwatani Corporation's acquisition of Aspen Air US, LLC represents a significant expansion into the US industrial gas market by a major international player. This move highlights the ongoing consolidation trend and the pursuit of enhanced market share within this competitive landscape.
- [Add 2-3 more recent key developments with dates and brief descriptions. Include links where possible.]
Strategic Outlook for US Industrial Gas Industry Market
The US industrial gas market holds significant growth potential driven by expanding industrial activity, technological advancements focusing on sustainability, and government support for infrastructure development. Strategic players should focus on expanding their product portfolios to meet the rising demand for high-purity gases and those produced from renewable sources. Moreover, strategic partnerships and investments in R&D will be crucial for maintaining a competitive edge and capitalizing on emerging opportunities within the burgeoning renewable energy sector.
US Industrial Gas Industry Segmentation
-
1. Product Type
- 1.1. Nitrogen
- 1.2. Oxygen
- 1.3. Carbon Dioxide
- 1.4. Hydrogen
- 1.5. Helium
- 1.6. Argon
- 1.7. Ammonia
- 1.8. Methane
- 1.9. Propane
- 1.10. Butane
- 1.11. Other Product Types
-
2. End-User Industry
- 2.1. Oil and Gas
- 2.2. Energy and Power
- 2.3. Petrochemical and Chemical Manufacturing
- 2.4. Medical and Pharmaceutical
- 2.5. Food and Beverage
- 2.6. Metal Manufacturing and Fabrication
- 2.7. Transportation
- 2.8. Other En
US Industrial Gas Industry Segmentation By Geography
-
1. North America
- 1.1. United States
- 1.2. Canada
- 1.3. Mexico
-
2. South America
- 2.1. Brazil
- 2.2. Argentina
- 2.3. Rest of South America
-
3. Europe
- 3.1. United Kingdom
- 3.2. Germany
- 3.3. France
- 3.4. Italy
- 3.5. Spain
- 3.6. Russia
- 3.7. Benelux
- 3.8. Nordics
- 3.9. Rest of Europe
-
4. Middle East & Africa
- 4.1. Turkey
- 4.2. Israel
- 4.3. GCC
- 4.4. North Africa
- 4.5. South Africa
- 4.6. Rest of Middle East & Africa
-
5. Asia Pacific
- 5.1. China
- 5.2. India
- 5.3. Japan
- 5.4. South Korea
- 5.5. ASEAN
- 5.6. Oceania
- 5.7. Rest of Asia Pacific
US Industrial Gas Industry Regional Market Share
Geographic Coverage of US Industrial Gas Industry
US Industrial Gas Industry REPORT HIGHLIGHTS
| Aspects | Details |
|---|---|
| Study Period | 2020-2034 |
| Base Year | 2025 |
| Estimated Year | 2026 |
| Forecast Period | 2026-2034 |
| Historical Period | 2020-2025 |
| Growth Rate | CAGR of 3.79% from 2020-2034 |
| Segmentation |
|
Table of Contents
- 1. Introduction
- 1.1. Research Scope
- 1.2. Market Segmentation
- 1.3. Research Objective
- 1.4. Definitions and Assumptions
- 2. Executive Summary
- 2.1. Market Snapshot
- 3. Market Dynamics
- 3.1. Market Drivers
- 3.2. Market Restrains
- 3.3. Market Trends
- 3.4. Market Opportunities
- 4. Market Factor Analysis
- 4.1. Porters Five Forces
- 4.1.1. Bargaining Power of Suppliers
- 4.1.2. Bargaining Power of Buyers
- 4.1.3. Threat of New Entrants
- 4.1.4. Threat of Substitutes
- 4.1.5. Competitive Rivalry
- 4.2. PESTEL analysis
- 4.3. BCG Analysis
- 4.3.1. Stars (High Growth, High Market Share)
- 4.3.2. Cash Cows (Low Growth, High Market Share)
- 4.3.3. Question Mark (High Growth, Low Market Share)
- 4.3.4. Dogs (Low Growth, Low Market Share)
- 4.4. Ansoff Matrix Analysis
- 4.5. Supply Chain Analysis
- 4.6. Regulatory Landscape
- 4.7. Current Market Potential and Opportunity Assessment (TAM–SAM–SOM Framework)
- 4.8. RAX Analyst Note
- 4.1. Porters Five Forces
- 5. Market Analysis, Insights and Forecast 2021-2033
- 5.1. Market Analysis, Insights and Forecast - by Product Type
- 5.1.1. Nitrogen
- 5.1.2. Oxygen
- 5.1.3. Carbon Dioxide
- 5.1.4. Hydrogen
- 5.1.5. Helium
- 5.1.6. Argon
- 5.1.7. Ammonia
- 5.1.8. Methane
- 5.1.9. Propane
- 5.1.10. Butane
- 5.1.11. Other Product Types
- 5.2. Market Analysis, Insights and Forecast - by End-User Industry
- 5.2.1. Oil and Gas
- 5.2.2. Energy and Power
- 5.2.3. Petrochemical and Chemical Manufacturing
- 5.2.4. Medical and Pharmaceutical
- 5.2.5. Food and Beverage
- 5.2.6. Metal Manufacturing and Fabrication
- 5.2.7. Transportation
- 5.2.8. Other En
- 5.3. Market Analysis, Insights and Forecast - by Region
- 5.3.1. North America
- 5.3.2. South America
- 5.3.3. Europe
- 5.3.4. Middle East & Africa
- 5.3.5. Asia Pacific
- 5.1. Market Analysis, Insights and Forecast - by Product Type
- 6. Global US Industrial Gas Industry Analysis, Insights and Forecast, 2021-2033
- 6.1. Market Analysis, Insights and Forecast - by Product Type
- 6.1.1. Nitrogen
- 6.1.2. Oxygen
- 6.1.3. Carbon Dioxide
- 6.1.4. Hydrogen
- 6.1.5. Helium
- 6.1.6. Argon
- 6.1.7. Ammonia
- 6.1.8. Methane
- 6.1.9. Propane
- 6.1.10. Butane
- 6.1.11. Other Product Types
- 6.2. Market Analysis, Insights and Forecast - by End-User Industry
- 6.2.1. Oil and Gas
- 6.2.2. Energy and Power
- 6.2.3. Petrochemical and Chemical Manufacturing
- 6.2.4. Medical and Pharmaceutical
- 6.2.5. Food and Beverage
- 6.2.6. Metal Manufacturing and Fabrication
- 6.2.7. Transportation
- 6.2.8. Other En
- 6.1. Market Analysis, Insights and Forecast - by Product Type
- 7. North America US Industrial Gas Industry Analysis, Insights and Forecast, 2020-2032
- 7.1. Market Analysis, Insights and Forecast - by Product Type
- 7.1.1. Nitrogen
- 7.1.2. Oxygen
- 7.1.3. Carbon Dioxide
- 7.1.4. Hydrogen
- 7.1.5. Helium
- 7.1.6. Argon
- 7.1.7. Ammonia
- 7.1.8. Methane
- 7.1.9. Propane
- 7.1.10. Butane
- 7.1.11. Other Product Types
- 7.2. Market Analysis, Insights and Forecast - by End-User Industry
- 7.2.1. Oil and Gas
- 7.2.2. Energy and Power
- 7.2.3. Petrochemical and Chemical Manufacturing
- 7.2.4. Medical and Pharmaceutical
- 7.2.5. Food and Beverage
- 7.2.6. Metal Manufacturing and Fabrication
- 7.2.7. Transportation
- 7.2.8. Other En
- 7.1. Market Analysis, Insights and Forecast - by Product Type
- 8. South America US Industrial Gas Industry Analysis, Insights and Forecast, 2020-2032
- 8.1. Market Analysis, Insights and Forecast - by Product Type
- 8.1.1. Nitrogen
- 8.1.2. Oxygen
- 8.1.3. Carbon Dioxide
- 8.1.4. Hydrogen
- 8.1.5. Helium
- 8.1.6. Argon
- 8.1.7. Ammonia
- 8.1.8. Methane
- 8.1.9. Propane
- 8.1.10. Butane
- 8.1.11. Other Product Types
- 8.2. Market Analysis, Insights and Forecast - by End-User Industry
- 8.2.1. Oil and Gas
- 8.2.2. Energy and Power
- 8.2.3. Petrochemical and Chemical Manufacturing
- 8.2.4. Medical and Pharmaceutical
- 8.2.5. Food and Beverage
- 8.2.6. Metal Manufacturing and Fabrication
- 8.2.7. Transportation
- 8.2.8. Other En
- 8.1. Market Analysis, Insights and Forecast - by Product Type
- 9. Europe US Industrial Gas Industry Analysis, Insights and Forecast, 2020-2032
- 9.1. Market Analysis, Insights and Forecast - by Product Type
- 9.1.1. Nitrogen
- 9.1.2. Oxygen
- 9.1.3. Carbon Dioxide
- 9.1.4. Hydrogen
- 9.1.5. Helium
- 9.1.6. Argon
- 9.1.7. Ammonia
- 9.1.8. Methane
- 9.1.9. Propane
- 9.1.10. Butane
- 9.1.11. Other Product Types
- 9.2. Market Analysis, Insights and Forecast - by End-User Industry
- 9.2.1. Oil and Gas
- 9.2.2. Energy and Power
- 9.2.3. Petrochemical and Chemical Manufacturing
- 9.2.4. Medical and Pharmaceutical
- 9.2.5. Food and Beverage
- 9.2.6. Metal Manufacturing and Fabrication
- 9.2.7. Transportation
- 9.2.8. Other En
- 9.1. Market Analysis, Insights and Forecast - by Product Type
- 10. Middle East & Africa US Industrial Gas Industry Analysis, Insights and Forecast, 2020-2032
- 10.1. Market Analysis, Insights and Forecast - by Product Type
- 10.1.1. Nitrogen
- 10.1.2. Oxygen
- 10.1.3. Carbon Dioxide
- 10.1.4. Hydrogen
- 10.1.5. Helium
- 10.1.6. Argon
- 10.1.7. Ammonia
- 10.1.8. Methane
- 10.1.9. Propane
- 10.1.10. Butane
- 10.1.11. Other Product Types
- 10.2. Market Analysis, Insights and Forecast - by End-User Industry
- 10.2.1. Oil and Gas
- 10.2.2. Energy and Power
- 10.2.3. Petrochemical and Chemical Manufacturing
- 10.2.4. Medical and Pharmaceutical
- 10.2.5. Food and Beverage
- 10.2.6. Metal Manufacturing and Fabrication
- 10.2.7. Transportation
- 10.2.8. Other En
- 10.1. Market Analysis, Insights and Forecast - by Product Type
- 11. Asia Pacific US Industrial Gas Industry Analysis, Insights and Forecast, 2020-2032
- 11.1. Market Analysis, Insights and Forecast - by Product Type
- 11.1.1. Nitrogen
- 11.1.2. Oxygen
- 11.1.3. Carbon Dioxide
- 11.1.4. Hydrogen
- 11.1.5. Helium
- 11.1.6. Argon
- 11.1.7. Ammonia
- 11.1.8. Methane
- 11.1.9. Propane
- 11.1.10. Butane
- 11.1.11. Other Product Types
- 11.2. Market Analysis, Insights and Forecast - by End-User Industry
- 11.2.1. Oil and Gas
- 11.2.2. Energy and Power
- 11.2.3. Petrochemical and Chemical Manufacturing
- 11.2.4. Medical and Pharmaceutical
- 11.2.5. Food and Beverage
- 11.2.6. Metal Manufacturing and Fabrication
- 11.2.7. Transportation
- 11.2.8. Other En
- 11.1. Market Analysis, Insights and Forecast - by Product Type
- 12. Competitive Analysis
- 12.1. Company Profiles
- 12.1.1 Linde PLC
- 12.1.1.1. Company Overview
- 12.1.1.2. Products
- 12.1.1.3. Company Financials
- 12.1.1.4. SWOT Analysis
- 12.1.2 Air Products and Chemicals Inc
- 12.1.2.1. Company Overview
- 12.1.2.2. Products
- 12.1.2.3. Company Financials
- 12.1.2.4. SWOT Analysis
- 12.1.3 Messer North America Inc
- 12.1.3.1. Company Overview
- 12.1.3.2. Products
- 12.1.3.3. Company Financials
- 12.1.3.4. SWOT Analysis
- 12.1.4 AIR WATER INC
- 12.1.4.1. Company Overview
- 12.1.4.2. Products
- 12.1.4.3. Company Financials
- 12.1.4.4. SWOT Analysis
- 12.1.5 nexAir LLC
- 12.1.5.1. Company Overview
- 12.1.5.2. Products
- 12.1.5.3. Company Financials
- 12.1.5.4. SWOT Analysis
- 12.1.6 Matheson Tri-Gas Inc
- 12.1.6.1. Company Overview
- 12.1.6.2. Products
- 12.1.6.3. Company Financials
- 12.1.6.4. SWOT Analysis
- 12.1.7 BASF SE
- 12.1.7.1. Company Overview
- 12.1.7.2. Products
- 12.1.7.3. Company Financials
- 12.1.7.4. SWOT Analysis
- 12.1.8 Iwatani Corporation
- 12.1.8.1. Company Overview
- 12.1.8.2. Products
- 12.1.8.3. Company Financials
- 12.1.8.4. SWOT Analysis
- 12.1.9 NIPPON SANSO HOLDINGS CORPORATION
- 12.1.9.1. Company Overview
- 12.1.9.2. Products
- 12.1.9.3. Company Financials
- 12.1.9.4. SWOT Analysis
- 12.1.10 Air Liquide
- 12.1.10.1. Company Overview
- 12.1.10.2. Products
- 12.1.10.3. Company Financials
- 12.1.10.4. SWOT Analysis
- 12.1.11 UIG*List Not Exhaustive
- 12.1.11.1. Company Overview
- 12.1.11.2. Products
- 12.1.11.3. Company Financials
- 12.1.11.4. SWOT Analysis
- 12.1.1 Linde PLC
- 12.2. Market Entropy
- 12.2.1 Company's Key Areas Served
- 12.2.2 Recent Developments
- 12.3. Company Market Share Analysis 2025
- 12.3.1 Top 5 Companies Market Share Analysis
- 12.3.2 Top 3 Companies Market Share Analysis
- 12.4. List of Potential Customers
- 13. Research Methodology
List of Figures
- Figure 1: Global US Industrial Gas Industry Revenue Breakdown (Million, %) by Region 2025 & 2033
- Figure 2: Global US Industrial Gas Industry Volume Breakdown (K Tons, %) by Region 2025 & 2033
- Figure 3: North America US Industrial Gas Industry Revenue (Million), by Product Type 2025 & 2033
- Figure 4: North America US Industrial Gas Industry Volume (K Tons), by Product Type 2025 & 2033
- Figure 5: North America US Industrial Gas Industry Revenue Share (%), by Product Type 2025 & 2033
- Figure 6: North America US Industrial Gas Industry Volume Share (%), by Product Type 2025 & 2033
- Figure 7: North America US Industrial Gas Industry Revenue (Million), by End-User Industry 2025 & 2033
- Figure 8: North America US Industrial Gas Industry Volume (K Tons), by End-User Industry 2025 & 2033
- Figure 9: North America US Industrial Gas Industry Revenue Share (%), by End-User Industry 2025 & 2033
- Figure 10: North America US Industrial Gas Industry Volume Share (%), by End-User Industry 2025 & 2033
- Figure 11: North America US Industrial Gas Industry Revenue (Million), by Country 2025 & 2033
- Figure 12: North America US Industrial Gas Industry Volume (K Tons), by Country 2025 & 2033
- Figure 13: North America US Industrial Gas Industry Revenue Share (%), by Country 2025 & 2033
- Figure 14: North America US Industrial Gas Industry Volume Share (%), by Country 2025 & 2033
- Figure 15: South America US Industrial Gas Industry Revenue (Million), by Product Type 2025 & 2033
- Figure 16: South America US Industrial Gas Industry Volume (K Tons), by Product Type 2025 & 2033
- Figure 17: South America US Industrial Gas Industry Revenue Share (%), by Product Type 2025 & 2033
- Figure 18: South America US Industrial Gas Industry Volume Share (%), by Product Type 2025 & 2033
- Figure 19: South America US Industrial Gas Industry Revenue (Million), by End-User Industry 2025 & 2033
- Figure 20: South America US Industrial Gas Industry Volume (K Tons), by End-User Industry 2025 & 2033
- Figure 21: South America US Industrial Gas Industry Revenue Share (%), by End-User Industry 2025 & 2033
- Figure 22: South America US Industrial Gas Industry Volume Share (%), by End-User Industry 2025 & 2033
- Figure 23: South America US Industrial Gas Industry Revenue (Million), by Country 2025 & 2033
- Figure 24: South America US Industrial Gas Industry Volume (K Tons), by Country 2025 & 2033
- Figure 25: South America US Industrial Gas Industry Revenue Share (%), by Country 2025 & 2033
- Figure 26: South America US Industrial Gas Industry Volume Share (%), by Country 2025 & 2033
- Figure 27: Europe US Industrial Gas Industry Revenue (Million), by Product Type 2025 & 2033
- Figure 28: Europe US Industrial Gas Industry Volume (K Tons), by Product Type 2025 & 2033
- Figure 29: Europe US Industrial Gas Industry Revenue Share (%), by Product Type 2025 & 2033
- Figure 30: Europe US Industrial Gas Industry Volume Share (%), by Product Type 2025 & 2033
- Figure 31: Europe US Industrial Gas Industry Revenue (Million), by End-User Industry 2025 & 2033
- Figure 32: Europe US Industrial Gas Industry Volume (K Tons), by End-User Industry 2025 & 2033
- Figure 33: Europe US Industrial Gas Industry Revenue Share (%), by End-User Industry 2025 & 2033
- Figure 34: Europe US Industrial Gas Industry Volume Share (%), by End-User Industry 2025 & 2033
- Figure 35: Europe US Industrial Gas Industry Revenue (Million), by Country 2025 & 2033
- Figure 36: Europe US Industrial Gas Industry Volume (K Tons), by Country 2025 & 2033
- Figure 37: Europe US Industrial Gas Industry Revenue Share (%), by Country 2025 & 2033
- Figure 38: Europe US Industrial Gas Industry Volume Share (%), by Country 2025 & 2033
- Figure 39: Middle East & Africa US Industrial Gas Industry Revenue (Million), by Product Type 2025 & 2033
- Figure 40: Middle East & Africa US Industrial Gas Industry Volume (K Tons), by Product Type 2025 & 2033
- Figure 41: Middle East & Africa US Industrial Gas Industry Revenue Share (%), by Product Type 2025 & 2033
- Figure 42: Middle East & Africa US Industrial Gas Industry Volume Share (%), by Product Type 2025 & 2033
- Figure 43: Middle East & Africa US Industrial Gas Industry Revenue (Million), by End-User Industry 2025 & 2033
- Figure 44: Middle East & Africa US Industrial Gas Industry Volume (K Tons), by End-User Industry 2025 & 2033
- Figure 45: Middle East & Africa US Industrial Gas Industry Revenue Share (%), by End-User Industry 2025 & 2033
- Figure 46: Middle East & Africa US Industrial Gas Industry Volume Share (%), by End-User Industry 2025 & 2033
- Figure 47: Middle East & Africa US Industrial Gas Industry Revenue (Million), by Country 2025 & 2033
- Figure 48: Middle East & Africa US Industrial Gas Industry Volume (K Tons), by Country 2025 & 2033
- Figure 49: Middle East & Africa US Industrial Gas Industry Revenue Share (%), by Country 2025 & 2033
- Figure 50: Middle East & Africa US Industrial Gas Industry Volume Share (%), by Country 2025 & 2033
- Figure 51: Asia Pacific US Industrial Gas Industry Revenue (Million), by Product Type 2025 & 2033
- Figure 52: Asia Pacific US Industrial Gas Industry Volume (K Tons), by Product Type 2025 & 2033
- Figure 53: Asia Pacific US Industrial Gas Industry Revenue Share (%), by Product Type 2025 & 2033
- Figure 54: Asia Pacific US Industrial Gas Industry Volume Share (%), by Product Type 2025 & 2033
- Figure 55: Asia Pacific US Industrial Gas Industry Revenue (Million), by End-User Industry 2025 & 2033
- Figure 56: Asia Pacific US Industrial Gas Industry Volume (K Tons), by End-User Industry 2025 & 2033
- Figure 57: Asia Pacific US Industrial Gas Industry Revenue Share (%), by End-User Industry 2025 & 2033
- Figure 58: Asia Pacific US Industrial Gas Industry Volume Share (%), by End-User Industry 2025 & 2033
- Figure 59: Asia Pacific US Industrial Gas Industry Revenue (Million), by Country 2025 & 2033
- Figure 60: Asia Pacific US Industrial Gas Industry Volume (K Tons), by Country 2025 & 2033
- Figure 61: Asia Pacific US Industrial Gas Industry Revenue Share (%), by Country 2025 & 2033
- Figure 62: Asia Pacific US Industrial Gas Industry Volume Share (%), by Country 2025 & 2033
List of Tables
- Table 1: Global US Industrial Gas Industry Revenue Million Forecast, by Product Type 2020 & 2033
- Table 2: Global US Industrial Gas Industry Volume K Tons Forecast, by Product Type 2020 & 2033
- Table 3: Global US Industrial Gas Industry Revenue Million Forecast, by End-User Industry 2020 & 2033
- Table 4: Global US Industrial Gas Industry Volume K Tons Forecast, by End-User Industry 2020 & 2033
- Table 5: Global US Industrial Gas Industry Revenue Million Forecast, by Region 2020 & 2033
- Table 6: Global US Industrial Gas Industry Volume K Tons Forecast, by Region 2020 & 2033
- Table 7: Global US Industrial Gas Industry Revenue Million Forecast, by Product Type 2020 & 2033
- Table 8: Global US Industrial Gas Industry Volume K Tons Forecast, by Product Type 2020 & 2033
- Table 9: Global US Industrial Gas Industry Revenue Million Forecast, by End-User Industry 2020 & 2033
- Table 10: Global US Industrial Gas Industry Volume K Tons Forecast, by End-User Industry 2020 & 2033
- Table 11: Global US Industrial Gas Industry Revenue Million Forecast, by Country 2020 & 2033
- Table 12: Global US Industrial Gas Industry Volume K Tons Forecast, by Country 2020 & 2033
- Table 13: United States US Industrial Gas Industry Revenue (Million) Forecast, by Application 2020 & 2033
- Table 14: United States US Industrial Gas Industry Volume (K Tons) Forecast, by Application 2020 & 2033
- Table 15: Canada US Industrial Gas Industry Revenue (Million) Forecast, by Application 2020 & 2033
- Table 16: Canada US Industrial Gas Industry Volume (K Tons) Forecast, by Application 2020 & 2033
- Table 17: Mexico US Industrial Gas Industry Revenue (Million) Forecast, by Application 2020 & 2033
- Table 18: Mexico US Industrial Gas Industry Volume (K Tons) Forecast, by Application 2020 & 2033
- Table 19: Global US Industrial Gas Industry Revenue Million Forecast, by Product Type 2020 & 2033
- Table 20: Global US Industrial Gas Industry Volume K Tons Forecast, by Product Type 2020 & 2033
- Table 21: Global US Industrial Gas Industry Revenue Million Forecast, by End-User Industry 2020 & 2033
- Table 22: Global US Industrial Gas Industry Volume K Tons Forecast, by End-User Industry 2020 & 2033
- Table 23: Global US Industrial Gas Industry Revenue Million Forecast, by Country 2020 & 2033
- Table 24: Global US Industrial Gas Industry Volume K Tons Forecast, by Country 2020 & 2033
- Table 25: Brazil US Industrial Gas Industry Revenue (Million) Forecast, by Application 2020 & 2033
- Table 26: Brazil US Industrial Gas Industry Volume (K Tons) Forecast, by Application 2020 & 2033
- Table 27: Argentina US Industrial Gas Industry Revenue (Million) Forecast, by Application 2020 & 2033
- Table 28: Argentina US Industrial Gas Industry Volume (K Tons) Forecast, by Application 2020 & 2033
- Table 29: Rest of South America US Industrial Gas Industry Revenue (Million) Forecast, by Application 2020 & 2033
- Table 30: Rest of South America US Industrial Gas Industry Volume (K Tons) Forecast, by Application 2020 & 2033
- Table 31: Global US Industrial Gas Industry Revenue Million Forecast, by Product Type 2020 & 2033
- Table 32: Global US Industrial Gas Industry Volume K Tons Forecast, by Product Type 2020 & 2033
- Table 33: Global US Industrial Gas Industry Revenue Million Forecast, by End-User Industry 2020 & 2033
- Table 34: Global US Industrial Gas Industry Volume K Tons Forecast, by End-User Industry 2020 & 2033
- Table 35: Global US Industrial Gas Industry Revenue Million Forecast, by Country 2020 & 2033
- Table 36: Global US Industrial Gas Industry Volume K Tons Forecast, by Country 2020 & 2033
- Table 37: United Kingdom US Industrial Gas Industry Revenue (Million) Forecast, by Application 2020 & 2033
- Table 38: United Kingdom US Industrial Gas Industry Volume (K Tons) Forecast, by Application 2020 & 2033
- Table 39: Germany US Industrial Gas Industry Revenue (Million) Forecast, by Application 2020 & 2033
- Table 40: Germany US Industrial Gas Industry Volume (K Tons) Forecast, by Application 2020 & 2033
- Table 41: France US Industrial Gas Industry Revenue (Million) Forecast, by Application 2020 & 2033
- Table 42: France US Industrial Gas Industry Volume (K Tons) Forecast, by Application 2020 & 2033
- Table 43: Italy US Industrial Gas Industry Revenue (Million) Forecast, by Application 2020 & 2033
- Table 44: Italy US Industrial Gas Industry Volume (K Tons) Forecast, by Application 2020 & 2033
- Table 45: Spain US Industrial Gas Industry Revenue (Million) Forecast, by Application 2020 & 2033
- Table 46: Spain US Industrial Gas Industry Volume (K Tons) Forecast, by Application 2020 & 2033
- Table 47: Russia US Industrial Gas Industry Revenue (Million) Forecast, by Application 2020 & 2033
- Table 48: Russia US Industrial Gas Industry Volume (K Tons) Forecast, by Application 2020 & 2033
- Table 49: Benelux US Industrial Gas Industry Revenue (Million) Forecast, by Application 2020 & 2033
- Table 50: Benelux US Industrial Gas Industry Volume (K Tons) Forecast, by Application 2020 & 2033
- Table 51: Nordics US Industrial Gas Industry Revenue (Million) Forecast, by Application 2020 & 2033
- Table 52: Nordics US Industrial Gas Industry Volume (K Tons) Forecast, by Application 2020 & 2033
- Table 53: Rest of Europe US Industrial Gas Industry Revenue (Million) Forecast, by Application 2020 & 2033
- Table 54: Rest of Europe US Industrial Gas Industry Volume (K Tons) Forecast, by Application 2020 & 2033
- Table 55: Global US Industrial Gas Industry Revenue Million Forecast, by Product Type 2020 & 2033
- Table 56: Global US Industrial Gas Industry Volume K Tons Forecast, by Product Type 2020 & 2033
- Table 57: Global US Industrial Gas Industry Revenue Million Forecast, by End-User Industry 2020 & 2033
- Table 58: Global US Industrial Gas Industry Volume K Tons Forecast, by End-User Industry 2020 & 2033
- Table 59: Global US Industrial Gas Industry Revenue Million Forecast, by Country 2020 & 2033
- Table 60: Global US Industrial Gas Industry Volume K Tons Forecast, by Country 2020 & 2033
- Table 61: Turkey US Industrial Gas Industry Revenue (Million) Forecast, by Application 2020 & 2033
- Table 62: Turkey US Industrial Gas Industry Volume (K Tons) Forecast, by Application 2020 & 2033
- Table 63: Israel US Industrial Gas Industry Revenue (Million) Forecast, by Application 2020 & 2033
- Table 64: Israel US Industrial Gas Industry Volume (K Tons) Forecast, by Application 2020 & 2033
- Table 65: GCC US Industrial Gas Industry Revenue (Million) Forecast, by Application 2020 & 2033
- Table 66: GCC US Industrial Gas Industry Volume (K Tons) Forecast, by Application 2020 & 2033
- Table 67: North Africa US Industrial Gas Industry Revenue (Million) Forecast, by Application 2020 & 2033
- Table 68: North Africa US Industrial Gas Industry Volume (K Tons) Forecast, by Application 2020 & 2033
- Table 69: South Africa US Industrial Gas Industry Revenue (Million) Forecast, by Application 2020 & 2033
- Table 70: South Africa US Industrial Gas Industry Volume (K Tons) Forecast, by Application 2020 & 2033
- Table 71: Rest of Middle East & Africa US Industrial Gas Industry Revenue (Million) Forecast, by Application 2020 & 2033
- Table 72: Rest of Middle East & Africa US Industrial Gas Industry Volume (K Tons) Forecast, by Application 2020 & 2033
- Table 73: Global US Industrial Gas Industry Revenue Million Forecast, by Product Type 2020 & 2033
- Table 74: Global US Industrial Gas Industry Volume K Tons Forecast, by Product Type 2020 & 2033
- Table 75: Global US Industrial Gas Industry Revenue Million Forecast, by End-User Industry 2020 & 2033
- Table 76: Global US Industrial Gas Industry Volume K Tons Forecast, by End-User Industry 2020 & 2033
- Table 77: Global US Industrial Gas Industry Revenue Million Forecast, by Country 2020 & 2033
- Table 78: Global US Industrial Gas Industry Volume K Tons Forecast, by Country 2020 & 2033
- Table 79: China US Industrial Gas Industry Revenue (Million) Forecast, by Application 2020 & 2033
- Table 80: China US Industrial Gas Industry Volume (K Tons) Forecast, by Application 2020 & 2033
- Table 81: India US Industrial Gas Industry Revenue (Million) Forecast, by Application 2020 & 2033
- Table 82: India US Industrial Gas Industry Volume (K Tons) Forecast, by Application 2020 & 2033
- Table 83: Japan US Industrial Gas Industry Revenue (Million) Forecast, by Application 2020 & 2033
- Table 84: Japan US Industrial Gas Industry Volume (K Tons) Forecast, by Application 2020 & 2033
- Table 85: South Korea US Industrial Gas Industry Revenue (Million) Forecast, by Application 2020 & 2033
- Table 86: South Korea US Industrial Gas Industry Volume (K Tons) Forecast, by Application 2020 & 2033
- Table 87: ASEAN US Industrial Gas Industry Revenue (Million) Forecast, by Application 2020 & 2033
- Table 88: ASEAN US Industrial Gas Industry Volume (K Tons) Forecast, by Application 2020 & 2033
- Table 89: Oceania US Industrial Gas Industry Revenue (Million) Forecast, by Application 2020 & 2033
- Table 90: Oceania US Industrial Gas Industry Volume (K Tons) Forecast, by Application 2020 & 2033
- Table 91: Rest of Asia Pacific US Industrial Gas Industry Revenue (Million) Forecast, by Application 2020 & 2033
- Table 92: Rest of Asia Pacific US Industrial Gas Industry Volume (K Tons) Forecast, by Application 2020 & 2033
Frequently Asked Questions
1. What is the projected Compound Annual Growth Rate (CAGR) of the US Industrial Gas Industry?
The projected CAGR is approximately 3.79%.
2. Which companies are prominent players in the US Industrial Gas Industry?
Key companies in the market include Linde PLC, Air Products and Chemicals Inc, Messer North America Inc, AIR WATER INC, nexAir LLC, Matheson Tri-Gas Inc, BASF SE, Iwatani Corporation, NIPPON SANSO HOLDINGS CORPORATION, Air Liquide, UIG*List Not Exhaustive.
3. What are the main segments of the US Industrial Gas Industry?
The market segments include Product Type, End-User Industry.
4. Can you provide details about the market size?
The market size is estimated to be USD 363.72 Million as of 2022.
5. What are some drivers contributing to market growth?
Increasing Demand from the Healthcare Sector; Increasing Demand for Frozen and Stored Food; Growing Need for Alternate Energy Sources.
6. What are the notable trends driving market growth?
Resilient Demand from the Healthcare Industry.
7. Are there any restraints impacting market growth?
Environmental Regulations and Safety Issues; Other Restraints.
8. Can you provide examples of recent developments in the market?
January 2023: Iwatani Corporation of America, a wholly-owned subsidiary of Iwatani Corporation, announced the acquisition of Aspen Air US, LLC, a leading manufacturer and distributor of bulk liquid industrial gases. This acquisition marks Iwatani's entrance into the United States Industrial Gases sector and highlights the company's expansion focus in this business segment.
9. What pricing options are available for accessing the report?
Pricing options include single-user, multi-user, and enterprise licenses priced at USD 3800, USD 4500, and USD 5800 respectively.
10. Is the market size provided in terms of value or volume?
The market size is provided in terms of value, measured in Million and volume, measured in K Tons.
11. Are there any specific market keywords associated with the report?
Yes, the market keyword associated with the report is "US Industrial Gas Industry," which aids in identifying and referencing the specific market segment covered.
12. How do I determine which pricing option suits my needs best?
The pricing options vary based on user requirements and access needs. Individual users may opt for single-user licenses, while businesses requiring broader access may choose multi-user or enterprise licenses for cost-effective access to the report.
13. Are there any additional resources or data provided in the US Industrial Gas Industry report?
While the report offers comprehensive insights, it's advisable to review the specific contents or supplementary materials provided to ascertain if additional resources or data are available.
14. How can I stay updated on further developments or reports in the US Industrial Gas Industry?
To stay informed about further developments, trends, and reports in the US Industrial Gas Industry, consider subscribing to industry newsletters, following relevant companies and organizations, or regularly checking reputable industry news sources and publications.
Methodology
Step 1 - Identification of Relevant Samples Size from Population Database


Step 2 - Approaches for Defining Global Market Size (Value, Volume* & Price*)

Note*: In applicable scenarios
Step 3 - Data Sources
Primary Research
- Web Analytics
- Survey Reports
- Research Institute
- Latest Research Reports
- Opinion Leaders
Secondary Research
- Annual Reports
- White Paper
- Latest Press Release
- Industry Association
- Paid Database
- Investor Presentations

Step 4 - Data Triangulation
Involves using different sources of information in order to increase the validity of a study
These sources are likely to be stakeholders in a program - participants, other researchers, program staff, other community members, and so on.
Then we put all data in single framework & apply various statistical tools to find out the dynamic on the market.
During the analysis stage, feedback from the stakeholder groups would be compared to determine areas of agreement as well as areas of divergence