
Key Insights
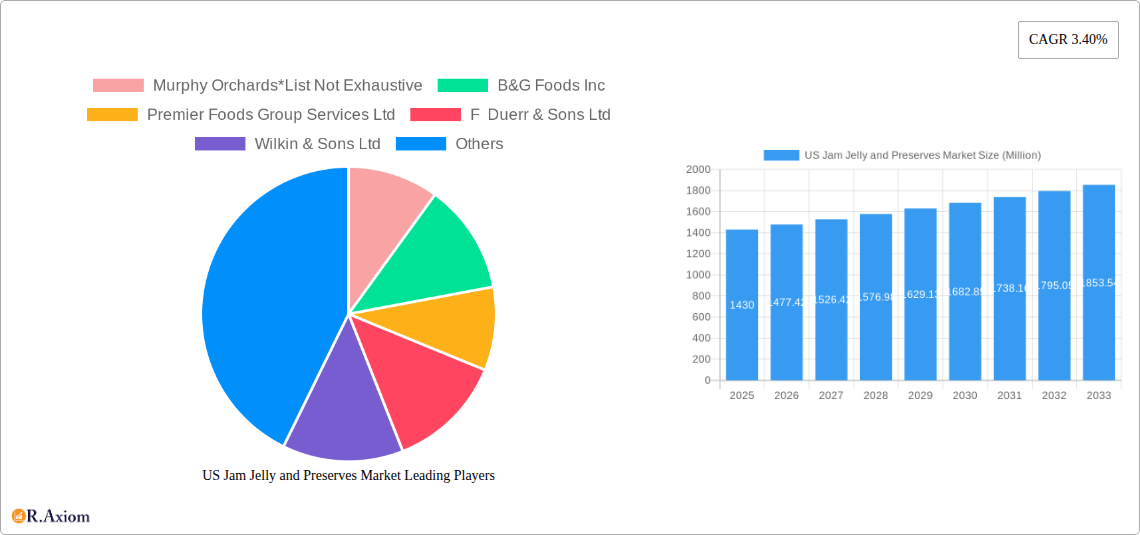
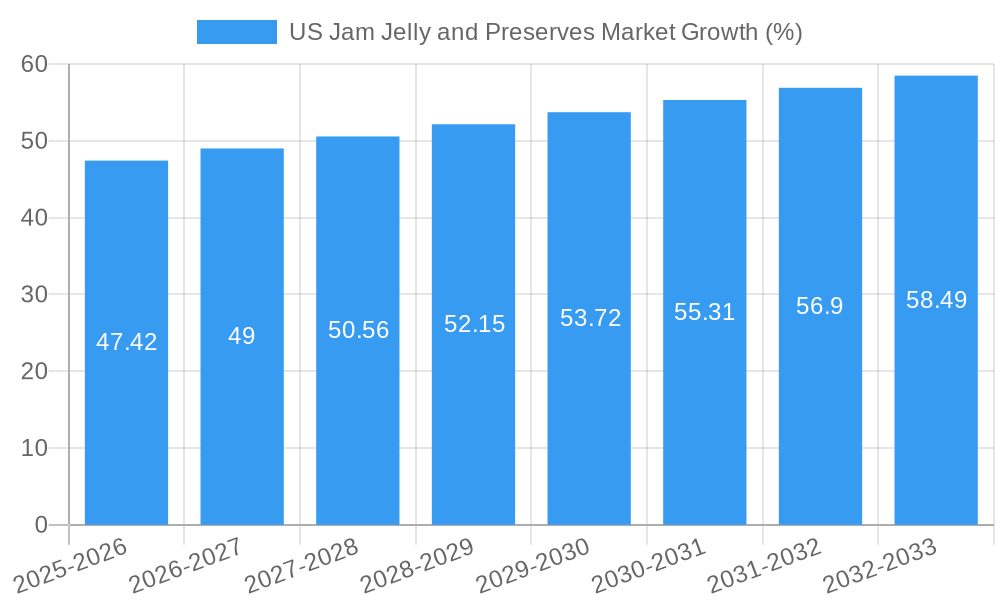
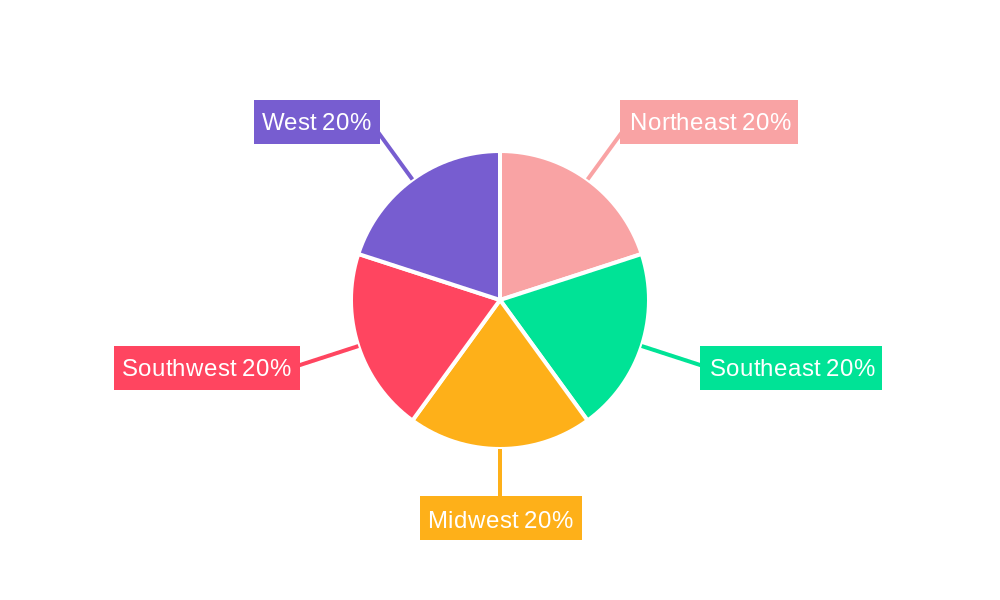
The US jam, jelly, and preserves market, valued at $1.43 billion in 2025, is projected to experience steady growth, with a compound annual growth rate (CAGR) of 3.40% from 2025 to 2033. This growth is driven by several factors. Consumer demand for convenient breakfast options and healthy spreads continues to fuel the market. The increasing popularity of artisanal and organic jams and preserves, catering to health-conscious consumers, is another significant driver. Furthermore, the expansion of online retail channels provides convenient access to a wider variety of products, boosting sales. While the market faces challenges such as fluctuating fruit prices and increasing competition from other breakfast alternatives, these are largely offset by the aforementioned positive trends. Market segmentation reveals supermarket/hypermarkets as the dominant distribution channel, reflecting established consumer shopping habits. However, online stores are experiencing significant growth, indicating a shift towards e-commerce within the sector. Key players like Smucker's, Kraft Heinz, and smaller regional brands like Murphy Orchards are vying for market share, leading to innovation in flavors, packaging, and marketing strategies. The regional distribution across the US shows relatively even distribution across the Northeast, Southeast, Midwest, Southwest, and West, suggesting consistent demand nationwide. Looking ahead, the market’s future hinges on maintaining consistent product innovation and adapting to evolving consumer preferences, particularly in the health and wellness space.
The competitive landscape is dynamic, with both established multinational corporations and smaller, regional producers competing for market share. This competition fuels innovation, resulting in new product offerings, such as unique flavor combinations and organic options, to cater to diverse consumer tastes. Successful strategies will involve leveraging online sales channels, building strong brand recognition, and developing effective marketing campaigns that emphasize product quality, health benefits, and convenience. Continued growth in the artisanal and specialty jam and preserve segment is anticipated, driving premiumization and further differentiation within the market. This continued growth should ensure that the US jam, jelly, and preserves market maintains a steady trajectory over the forecast period, reflecting the enduring consumer appeal of these traditional breakfast staples.
US Jam, Jelly, and Preserves Market: A Comprehensive Report (2019-2033)
This in-depth report provides a comprehensive analysis of the US jam, jelly, and preserves market, offering valuable insights for industry stakeholders, investors, and businesses seeking to navigate this dynamic sector. The report covers the period from 2019 to 2033, with a focus on the 2025-2033 forecast period and detailed analysis of 2025, the base year. We delve into market segmentation, key players, growth drivers, challenges, and emerging opportunities, equipping you with actionable intelligence to make informed decisions. The US Jam, Jelly, and Preserves market is estimated to be valued at xx Million in 2025.
US Jam Jelly and Preserves Market Market Concentration & Innovation
The US jam, jelly, and preserves market exhibits a moderately concentrated structure, with a handful of major players holding significant market share. However, the presence of numerous smaller regional brands and emerging players contributes to a dynamic competitive landscape. Market share data for 2025 reveals that The J M Smucker Company and The Kraft Heinz Company hold the largest shares, estimated at xx% and xx% respectively. Other significant players include B&G Foods Inc, Conagra Foods Inc, and Andros Group, each commanding a share of xx% or less.
Innovation within the sector is driven by consumer demand for healthier, more convenient, and diverse product offerings. This is evident in the growing popularity of organic, low-sugar, and specialty jams and preserves. Regulatory frameworks, including labeling requirements and food safety standards, significantly influence product development and market access. The increasing prevalence of product substitutes, such as fruit spreads made from alternative ingredients, presents both a challenge and an opportunity for established players. Mergers and acquisitions (M&A) activity is relatively moderate, with recent deals primarily focused on strengthening product portfolios and expanding distribution networks. The total value of M&A deals in the last 5 years is estimated at xx Million.
- Key Metrics:
- Market Concentration Ratio (CR4): xx%
- Average M&A Deal Value (2020-2024): xx Million
- Number of M&A Deals (2020-2024): xx
US Jam Jelly and Preserves Market Industry Trends & Insights
The US jam, jelly, and preserves market is projected to witness steady growth throughout the forecast period (2025-2033), with a CAGR of xx%. This growth is fueled by several factors: increasing consumer awareness of the health benefits of fruit consumption, rising disposable incomes in several demographic groups, and a growing preference for convenient breakfast and snack options. Technological advancements, such as improved processing and packaging techniques, are enhancing product shelf life and appealing to health-conscious consumers. Consumer preferences are shifting towards premium, organic, and specialty products, creating opportunities for manufacturers to cater to these evolving tastes. The competitive landscape is marked by intense rivalry, with companies investing heavily in product innovation, brand building, and efficient supply chain management. Market penetration is highest within the supermarket/hypermarket distribution channel. However, the growth of online retail channels presents new avenues for market expansion.
Dominant Markets & Segments in US Jam Jelly and Preserves Market
Within the US jam, jelly, and preserves market, the Jam and Jellies segment dominates in terms of volume and value, accounting for xx% of the total market in 2025. This dominance is driven by high consumer preference for these classic options and their extensive usage in various culinary preparations. Geographically, the Northeast region of the United States shows the strongest performance owing to favorable demographic factors and higher per capita consumption rates. In terms of distribution channels, Supermarket/Hypermarket channels maintain their market leadership due to established distribution networks and wide reach.
Key Drivers for Dominant Segments:
- Jam and Jellies: Established consumer preference, versatility in culinary applications.
- Northeast Region: High population density, favorable consumer preferences, strong retail presence.
- Supermarket/Hypermarket: Established distribution networks, wide reach and accessibility to consumers.
Detailed Dominance Analysis: The dominance of jam and jellies is attributable to their long-standing presence in US kitchens. The Northeast's higher consumption rates might reflect the region's demographics and established food culture. The supermarket/hypermarket dominance highlights the importance of traditional retail channels for product distribution.
US Jam Jelly and Preserves Market Product Developments
Recent product developments emphasize convenience, health, and diversification. Manufacturers are introducing innovative flavors, formats (such as single-serve cups), and functional ingredients (such as added probiotics or antioxidants). The trend towards natural and organic ingredients is driving the growth of premium, health-conscious product offerings. This focus on meeting consumer demands for healthier options is a critical aspect of creating competitive advantages. Technological advancements in processing and packaging are improving product shelf-life and convenience, ensuring better market fit and improved competitiveness.
Report Scope & Segmentation Analysis
This report segments the US jam, jelly, and preserves market based on product type (Jam and Jellies, Marmalade, Preserves) and distribution channel (Supermarket/Hypermarket, Convenience Store, Online Stores, Other Distribution Channels). Each segment is analyzed in terms of market size, growth projections, and competitive dynamics. For instance, the Jam and Jellies segment is expected to maintain a high growth rate due to consumer demand, while online stores are projected to witness significant expansion due to the growing trend of e-commerce. Market sizes vary significantly across segments, with jams and jellies holding the largest portion of the market followed by preserves and then marmalade.
Key Drivers of US Jam Jelly and Preserves Market Growth
Several factors contribute to the market's growth. Firstly, the increasing health-consciousness among consumers has spurred the demand for low-sugar and organic jams and preserves. Secondly, the rising disposable incomes in certain demographics are leading to increased spending on premium food products. Thirdly, the growing popularity of jams and preserves in various culinary applications, from breakfast spreads to desserts, drives volume growth. Finally, improved processing and packaging technologies offer enhanced convenience and shelf-life.
Challenges in the US Jam Jelly and Preserves Market Sector
The US jam, jelly, and preserves market faces several challenges. Fluctuating raw material prices, particularly fruit prices, pose a major threat to profitability. Intense competition among established players and new entrants creates pressure on margins. Furthermore, changing consumer preferences and the rise of substitute products, like fruit spreads and nut butters, also pose threats to market share. These factors can collectively impact market growth, particularly in certain segments.
Emerging Opportunities in US Jam Jelly and Preserves Market
Emerging opportunities lie in the growth of the organic and specialty jam and preserves markets. The demand for keto-friendly, vegan, and gluten-free options is increasing, creating new niche segments for manufacturers. Furthermore, the expansion of e-commerce channels presents significant opportunities for reaching new customer demographics. Developing innovative product formats and flavors catering to specific dietary restrictions or preferences could significantly boost market growth.
Leading Players in the US Jam Jelly and Preserves Market Market
- Murphy Orchards
- B&G Foods Inc
- Premier Foods Group Services Ltd
- F Duerr & Sons Ltd
- Wilkin & Sons Ltd
- The Hain Celestial Group Inc
- National Grape Cooperative Association
- The J M Smucker Company
- The Kraft Heinz Company
- Andros Group
- Conagra Foods Inc
Key Developments in US Jam Jelly and Preserves Market Industry
- January 2023: Conagra Brands launched Snack Pack Starburst All Pink Juicy Gels, expanding its product line and tapping into the popularity of confectionery-inspired flavors.
- September 2022: Kraft Heinz collaborated with StartLife, an agri-food tech accelerator, to foster innovation and meet evolving consumer demands.
- February 2021: Good Good, an Icelandic brand, introduced three new keto-friendly and vegan jam flavors, targeting health-conscious consumers.
Strategic Outlook for US Jam Jelly and Preserves Market Market
The US jam, jelly, and preserves market is poised for continued growth, driven by evolving consumer preferences, technological advancements, and the expansion of e-commerce. Strategic investments in product innovation, particularly in organic, healthy, and convenient options, are crucial for success. Companies that effectively adapt to evolving consumer needs and leverage digital channels will be well-positioned to capture market share and drive future growth. The market is expected to experience significant growth in the coming years, particularly in the premium and specialized segments.
US Jam Jelly and Preserves Market Segmentation
-
1. Product Type
- 1.1. Jam and Jellies
- 1.2. Marmalade
- 1.3. Preserves
-
2. Distribution Channel
- 2.1. Supermarket/Hypermarket
- 2.2. Convenience Store
- 2.3. Online Stores
- 2.4. Other Distribution Channels
US Jam Jelly and Preserves Market Segmentation By Geography
-
1. North America
- 1.1. United States
- 1.2. Canada
- 1.3. Mexico
-
2. South America
- 2.1. Brazil
- 2.2. Argentina
- 2.3. Rest of South America
-
3. Europe
- 3.1. United Kingdom
- 3.2. Germany
- 3.3. France
- 3.4. Italy
- 3.5. Spain
- 3.6. Russia
- 3.7. Benelux
- 3.8. Nordics
- 3.9. Rest of Europe
-
4. Middle East & Africa
- 4.1. Turkey
- 4.2. Israel
- 4.3. GCC
- 4.4. North Africa
- 4.5. South Africa
- 4.6. Rest of Middle East & Africa
-
5. Asia Pacific
- 5.1. China
- 5.2. India
- 5.3. Japan
- 5.4. South Korea
- 5.5. ASEAN
- 5.6. Oceania
- 5.7. Rest of Asia Pacific
US Jam Jelly and Preserves Market REPORT HIGHLIGHTS
| Aspects | Details |
|---|---|
| Study Period | 2019-2033 |
| Base Year | 2024 |
| Estimated Year | 2025 |
| Forecast Period | 2025-2033 |
| Historical Period | 2019-2024 |
| Growth Rate | CAGR of 3.40% from 2019-2033 |
| Segmentation |
|
Table of Contents
- 1. Introduction
- 1.1. Research Scope
- 1.2. Market Segmentation
- 1.3. Research Methodology
- 1.4. Definitions and Assumptions
- 2. Executive Summary
- 2.1. Introduction
- 3. Market Dynamics
- 3.1. Introduction
- 3.2. Market Drivers
- 3.2.1. Prevalence of Lactose Intolerance Driving the Market; Growing Influence of Healthy Lifestyle Trends and Rising Non-Traditional Users
- 3.3. Market Restrains
- 3.3.1. Wide Availability of Alternative Protein Sources
- 3.4. Market Trends
- 3.4.1. Increasing Demand for Organic Food Products
- 4. Market Factor Analysis
- 4.1. Porters Five Forces
- 4.2. Supply/Value Chain
- 4.3. PESTEL analysis
- 4.4. Market Entropy
- 4.5. Patent/Trademark Analysis
- 5. Global US Jam Jelly and Preserves Market Analysis, Insights and Forecast, 2019-2031
- 5.1. Market Analysis, Insights and Forecast - by Product Type
- 5.1.1. Jam and Jellies
- 5.1.2. Marmalade
- 5.1.3. Preserves
- 5.2. Market Analysis, Insights and Forecast - by Distribution Channel
- 5.2.1. Supermarket/Hypermarket
- 5.2.2. Convenience Store
- 5.2.3. Online Stores
- 5.2.4. Other Distribution Channels
- 5.3. Market Analysis, Insights and Forecast - by Region
- 5.3.1. North America
- 5.3.2. South America
- 5.3.3. Europe
- 5.3.4. Middle East & Africa
- 5.3.5. Asia Pacific
- 5.1. Market Analysis, Insights and Forecast - by Product Type
- 6. North America US Jam Jelly and Preserves Market Analysis, Insights and Forecast, 2019-2031
- 6.1. Market Analysis, Insights and Forecast - by Product Type
- 6.1.1. Jam and Jellies
- 6.1.2. Marmalade
- 6.1.3. Preserves
- 6.2. Market Analysis, Insights and Forecast - by Distribution Channel
- 6.2.1. Supermarket/Hypermarket
- 6.2.2. Convenience Store
- 6.2.3. Online Stores
- 6.2.4. Other Distribution Channels
- 6.1. Market Analysis, Insights and Forecast - by Product Type
- 7. South America US Jam Jelly and Preserves Market Analysis, Insights and Forecast, 2019-2031
- 7.1. Market Analysis, Insights and Forecast - by Product Type
- 7.1.1. Jam and Jellies
- 7.1.2. Marmalade
- 7.1.3. Preserves
- 7.2. Market Analysis, Insights and Forecast - by Distribution Channel
- 7.2.1. Supermarket/Hypermarket
- 7.2.2. Convenience Store
- 7.2.3. Online Stores
- 7.2.4. Other Distribution Channels
- 7.1. Market Analysis, Insights and Forecast - by Product Type
- 8. Europe US Jam Jelly and Preserves Market Analysis, Insights and Forecast, 2019-2031
- 8.1. Market Analysis, Insights and Forecast - by Product Type
- 8.1.1. Jam and Jellies
- 8.1.2. Marmalade
- 8.1.3. Preserves
- 8.2. Market Analysis, Insights and Forecast - by Distribution Channel
- 8.2.1. Supermarket/Hypermarket
- 8.2.2. Convenience Store
- 8.2.3. Online Stores
- 8.2.4. Other Distribution Channels
- 8.1. Market Analysis, Insights and Forecast - by Product Type
- 9. Middle East & Africa US Jam Jelly and Preserves Market Analysis, Insights and Forecast, 2019-2031
- 9.1. Market Analysis, Insights and Forecast - by Product Type
- 9.1.1. Jam and Jellies
- 9.1.2. Marmalade
- 9.1.3. Preserves
- 9.2. Market Analysis, Insights and Forecast - by Distribution Channel
- 9.2.1. Supermarket/Hypermarket
- 9.2.2. Convenience Store
- 9.2.3. Online Stores
- 9.2.4. Other Distribution Channels
- 9.1. Market Analysis, Insights and Forecast - by Product Type
- 10. Asia Pacific US Jam Jelly and Preserves Market Analysis, Insights and Forecast, 2019-2031
- 10.1. Market Analysis, Insights and Forecast - by Product Type
- 10.1.1. Jam and Jellies
- 10.1.2. Marmalade
- 10.1.3. Preserves
- 10.2. Market Analysis, Insights and Forecast - by Distribution Channel
- 10.2.1. Supermarket/Hypermarket
- 10.2.2. Convenience Store
- 10.2.3. Online Stores
- 10.2.4. Other Distribution Channels
- 10.1. Market Analysis, Insights and Forecast - by Product Type
- 11. Northeast US Jam Jelly and Preserves Market Analysis, Insights and Forecast, 2019-2031
- 12. Southeast US Jam Jelly and Preserves Market Analysis, Insights and Forecast, 2019-2031
- 13. Midwest US Jam Jelly and Preserves Market Analysis, Insights and Forecast, 2019-2031
- 14. Southwest US Jam Jelly and Preserves Market Analysis, Insights and Forecast, 2019-2031
- 15. West US Jam Jelly and Preserves Market Analysis, Insights and Forecast, 2019-2031
- 16. Competitive Analysis
- 16.1. Global Market Share Analysis 2024
- 16.2. Company Profiles
- 16.2.1 Murphy Orchards*List Not Exhaustive
- 16.2.1.1. Overview
- 16.2.1.2. Products
- 16.2.1.3. SWOT Analysis
- 16.2.1.4. Recent Developments
- 16.2.1.5. Financials (Based on Availability)
- 16.2.2 B&G Foods Inc
- 16.2.2.1. Overview
- 16.2.2.2. Products
- 16.2.2.3. SWOT Analysis
- 16.2.2.4. Recent Developments
- 16.2.2.5. Financials (Based on Availability)
- 16.2.3 Premier Foods Group Services Ltd
- 16.2.3.1. Overview
- 16.2.3.2. Products
- 16.2.3.3. SWOT Analysis
- 16.2.3.4. Recent Developments
- 16.2.3.5. Financials (Based on Availability)
- 16.2.4 F Duerr & Sons Ltd
- 16.2.4.1. Overview
- 16.2.4.2. Products
- 16.2.4.3. SWOT Analysis
- 16.2.4.4. Recent Developments
- 16.2.4.5. Financials (Based on Availability)
- 16.2.5 Wilkin & Sons Ltd
- 16.2.5.1. Overview
- 16.2.5.2. Products
- 16.2.5.3. SWOT Analysis
- 16.2.5.4. Recent Developments
- 16.2.5.5. Financials (Based on Availability)
- 16.2.6 The Hain Celestial Group Inc
- 16.2.6.1. Overview
- 16.2.6.2. Products
- 16.2.6.3. SWOT Analysis
- 16.2.6.4. Recent Developments
- 16.2.6.5. Financials (Based on Availability)
- 16.2.7 National Grape Cooperative Association
- 16.2.7.1. Overview
- 16.2.7.2. Products
- 16.2.7.3. SWOT Analysis
- 16.2.7.4. Recent Developments
- 16.2.7.5. Financials (Based on Availability)
- 16.2.8 The J M Smucker Company
- 16.2.8.1. Overview
- 16.2.8.2. Products
- 16.2.8.3. SWOT Analysis
- 16.2.8.4. Recent Developments
- 16.2.8.5. Financials (Based on Availability)
- 16.2.9 The Kraft Heinz Company
- 16.2.9.1. Overview
- 16.2.9.2. Products
- 16.2.9.3. SWOT Analysis
- 16.2.9.4. Recent Developments
- 16.2.9.5. Financials (Based on Availability)
- 16.2.10 Andros Group
- 16.2.10.1. Overview
- 16.2.10.2. Products
- 16.2.10.3. SWOT Analysis
- 16.2.10.4. Recent Developments
- 16.2.10.5. Financials (Based on Availability)
- 16.2.11 Conagra Foods Inc
- 16.2.11.1. Overview
- 16.2.11.2. Products
- 16.2.11.3. SWOT Analysis
- 16.2.11.4. Recent Developments
- 16.2.11.5. Financials (Based on Availability)
- 16.2.1 Murphy Orchards*List Not Exhaustive
List of Figures
- Figure 1: Global US Jam Jelly and Preserves Market Revenue Breakdown (Million, %) by Region 2024 & 2032
- Figure 2: Global US Jam Jelly and Preserves Market Volume Breakdown (Liters, %) by Region 2024 & 2032
- Figure 3: United states US Jam Jelly and Preserves Market Revenue (Million), by Country 2024 & 2032
- Figure 4: United states US Jam Jelly and Preserves Market Volume (Liters), by Country 2024 & 2032
- Figure 5: United states US Jam Jelly and Preserves Market Revenue Share (%), by Country 2024 & 2032
- Figure 6: United states US Jam Jelly and Preserves Market Volume Share (%), by Country 2024 & 2032
- Figure 7: North America US Jam Jelly and Preserves Market Revenue (Million), by Product Type 2024 & 2032
- Figure 8: North America US Jam Jelly and Preserves Market Volume (Liters), by Product Type 2024 & 2032
- Figure 9: North America US Jam Jelly and Preserves Market Revenue Share (%), by Product Type 2024 & 2032
- Figure 10: North America US Jam Jelly and Preserves Market Volume Share (%), by Product Type 2024 & 2032
- Figure 11: North America US Jam Jelly and Preserves Market Revenue (Million), by Distribution Channel 2024 & 2032
- Figure 12: North America US Jam Jelly and Preserves Market Volume (Liters), by Distribution Channel 2024 & 2032
- Figure 13: North America US Jam Jelly and Preserves Market Revenue Share (%), by Distribution Channel 2024 & 2032
- Figure 14: North America US Jam Jelly and Preserves Market Volume Share (%), by Distribution Channel 2024 & 2032
- Figure 15: North America US Jam Jelly and Preserves Market Revenue (Million), by Country 2024 & 2032
- Figure 16: North America US Jam Jelly and Preserves Market Volume (Liters), by Country 2024 & 2032
- Figure 17: North America US Jam Jelly and Preserves Market Revenue Share (%), by Country 2024 & 2032
- Figure 18: North America US Jam Jelly and Preserves Market Volume Share (%), by Country 2024 & 2032
- Figure 19: South America US Jam Jelly and Preserves Market Revenue (Million), by Product Type 2024 & 2032
- Figure 20: South America US Jam Jelly and Preserves Market Volume (Liters), by Product Type 2024 & 2032
- Figure 21: South America US Jam Jelly and Preserves Market Revenue Share (%), by Product Type 2024 & 2032
- Figure 22: South America US Jam Jelly and Preserves Market Volume Share (%), by Product Type 2024 & 2032
- Figure 23: South America US Jam Jelly and Preserves Market Revenue (Million), by Distribution Channel 2024 & 2032
- Figure 24: South America US Jam Jelly and Preserves Market Volume (Liters), by Distribution Channel 2024 & 2032
- Figure 25: South America US Jam Jelly and Preserves Market Revenue Share (%), by Distribution Channel 2024 & 2032
- Figure 26: South America US Jam Jelly and Preserves Market Volume Share (%), by Distribution Channel 2024 & 2032
- Figure 27: South America US Jam Jelly and Preserves Market Revenue (Million), by Country 2024 & 2032
- Figure 28: South America US Jam Jelly and Preserves Market Volume (Liters), by Country 2024 & 2032
- Figure 29: South America US Jam Jelly and Preserves Market Revenue Share (%), by Country 2024 & 2032
- Figure 30: South America US Jam Jelly and Preserves Market Volume Share (%), by Country 2024 & 2032
- Figure 31: Europe US Jam Jelly and Preserves Market Revenue (Million), by Product Type 2024 & 2032
- Figure 32: Europe US Jam Jelly and Preserves Market Volume (Liters), by Product Type 2024 & 2032
- Figure 33: Europe US Jam Jelly and Preserves Market Revenue Share (%), by Product Type 2024 & 2032
- Figure 34: Europe US Jam Jelly and Preserves Market Volume Share (%), by Product Type 2024 & 2032
- Figure 35: Europe US Jam Jelly and Preserves Market Revenue (Million), by Distribution Channel 2024 & 2032
- Figure 36: Europe US Jam Jelly and Preserves Market Volume (Liters), by Distribution Channel 2024 & 2032
- Figure 37: Europe US Jam Jelly and Preserves Market Revenue Share (%), by Distribution Channel 2024 & 2032
- Figure 38: Europe US Jam Jelly and Preserves Market Volume Share (%), by Distribution Channel 2024 & 2032
- Figure 39: Europe US Jam Jelly and Preserves Market Revenue (Million), by Country 2024 & 2032
- Figure 40: Europe US Jam Jelly and Preserves Market Volume (Liters), by Country 2024 & 2032
- Figure 41: Europe US Jam Jelly and Preserves Market Revenue Share (%), by Country 2024 & 2032
- Figure 42: Europe US Jam Jelly and Preserves Market Volume Share (%), by Country 2024 & 2032
- Figure 43: Middle East & Africa US Jam Jelly and Preserves Market Revenue (Million), by Product Type 2024 & 2032
- Figure 44: Middle East & Africa US Jam Jelly and Preserves Market Volume (Liters), by Product Type 2024 & 2032
- Figure 45: Middle East & Africa US Jam Jelly and Preserves Market Revenue Share (%), by Product Type 2024 & 2032
- Figure 46: Middle East & Africa US Jam Jelly and Preserves Market Volume Share (%), by Product Type 2024 & 2032
- Figure 47: Middle East & Africa US Jam Jelly and Preserves Market Revenue (Million), by Distribution Channel 2024 & 2032
- Figure 48: Middle East & Africa US Jam Jelly and Preserves Market Volume (Liters), by Distribution Channel 2024 & 2032
- Figure 49: Middle East & Africa US Jam Jelly and Preserves Market Revenue Share (%), by Distribution Channel 2024 & 2032
- Figure 50: Middle East & Africa US Jam Jelly and Preserves Market Volume Share (%), by Distribution Channel 2024 & 2032
- Figure 51: Middle East & Africa US Jam Jelly and Preserves Market Revenue (Million), by Country 2024 & 2032
- Figure 52: Middle East & Africa US Jam Jelly and Preserves Market Volume (Liters), by Country 2024 & 2032
- Figure 53: Middle East & Africa US Jam Jelly and Preserves Market Revenue Share (%), by Country 2024 & 2032
- Figure 54: Middle East & Africa US Jam Jelly and Preserves Market Volume Share (%), by Country 2024 & 2032
- Figure 55: Asia Pacific US Jam Jelly and Preserves Market Revenue (Million), by Product Type 2024 & 2032
- Figure 56: Asia Pacific US Jam Jelly and Preserves Market Volume (Liters), by Product Type 2024 & 2032
- Figure 57: Asia Pacific US Jam Jelly and Preserves Market Revenue Share (%), by Product Type 2024 & 2032
- Figure 58: Asia Pacific US Jam Jelly and Preserves Market Volume Share (%), by Product Type 2024 & 2032
- Figure 59: Asia Pacific US Jam Jelly and Preserves Market Revenue (Million), by Distribution Channel 2024 & 2032
- Figure 60: Asia Pacific US Jam Jelly and Preserves Market Volume (Liters), by Distribution Channel 2024 & 2032
- Figure 61: Asia Pacific US Jam Jelly and Preserves Market Revenue Share (%), by Distribution Channel 2024 & 2032
- Figure 62: Asia Pacific US Jam Jelly and Preserves Market Volume Share (%), by Distribution Channel 2024 & 2032
- Figure 63: Asia Pacific US Jam Jelly and Preserves Market Revenue (Million), by Country 2024 & 2032
- Figure 64: Asia Pacific US Jam Jelly and Preserves Market Volume (Liters), by Country 2024 & 2032
- Figure 65: Asia Pacific US Jam Jelly and Preserves Market Revenue Share (%), by Country 2024 & 2032
- Figure 66: Asia Pacific US Jam Jelly and Preserves Market Volume Share (%), by Country 2024 & 2032
List of Tables
- Table 1: Global US Jam Jelly and Preserves Market Revenue Million Forecast, by Region 2019 & 2032
- Table 2: Global US Jam Jelly and Preserves Market Volume Liters Forecast, by Region 2019 & 2032
- Table 3: Global US Jam Jelly and Preserves Market Revenue Million Forecast, by Product Type 2019 & 2032
- Table 4: Global US Jam Jelly and Preserves Market Volume Liters Forecast, by Product Type 2019 & 2032
- Table 5: Global US Jam Jelly and Preserves Market Revenue Million Forecast, by Distribution Channel 2019 & 2032
- Table 6: Global US Jam Jelly and Preserves Market Volume Liters Forecast, by Distribution Channel 2019 & 2032
- Table 7: Global US Jam Jelly and Preserves Market Revenue Million Forecast, by Region 2019 & 2032
- Table 8: Global US Jam Jelly and Preserves Market Volume Liters Forecast, by Region 2019 & 2032
- Table 9: Global US Jam Jelly and Preserves Market Revenue Million Forecast, by Country 2019 & 2032
- Table 10: Global US Jam Jelly and Preserves Market Volume Liters Forecast, by Country 2019 & 2032
- Table 11: Northeast US Jam Jelly and Preserves Market Revenue (Million) Forecast, by Application 2019 & 2032
- Table 12: Northeast US Jam Jelly and Preserves Market Volume (Liters) Forecast, by Application 2019 & 2032
- Table 13: Southeast US Jam Jelly and Preserves Market Revenue (Million) Forecast, by Application 2019 & 2032
- Table 14: Southeast US Jam Jelly and Preserves Market Volume (Liters) Forecast, by Application 2019 & 2032
- Table 15: Midwest US Jam Jelly and Preserves Market Revenue (Million) Forecast, by Application 2019 & 2032
- Table 16: Midwest US Jam Jelly and Preserves Market Volume (Liters) Forecast, by Application 2019 & 2032
- Table 17: Southwest US Jam Jelly and Preserves Market Revenue (Million) Forecast, by Application 2019 & 2032
- Table 18: Southwest US Jam Jelly and Preserves Market Volume (Liters) Forecast, by Application 2019 & 2032
- Table 19: West US Jam Jelly and Preserves Market Revenue (Million) Forecast, by Application 2019 & 2032
- Table 20: West US Jam Jelly and Preserves Market Volume (Liters) Forecast, by Application 2019 & 2032
- Table 21: Global US Jam Jelly and Preserves Market Revenue Million Forecast, by Product Type 2019 & 2032
- Table 22: Global US Jam Jelly and Preserves Market Volume Liters Forecast, by Product Type 2019 & 2032
- Table 23: Global US Jam Jelly and Preserves Market Revenue Million Forecast, by Distribution Channel 2019 & 2032
- Table 24: Global US Jam Jelly and Preserves Market Volume Liters Forecast, by Distribution Channel 2019 & 2032
- Table 25: Global US Jam Jelly and Preserves Market Revenue Million Forecast, by Country 2019 & 2032
- Table 26: Global US Jam Jelly and Preserves Market Volume Liters Forecast, by Country 2019 & 2032
- Table 27: United States US Jam Jelly and Preserves Market Revenue (Million) Forecast, by Application 2019 & 2032
- Table 28: United States US Jam Jelly and Preserves Market Volume (Liters) Forecast, by Application 2019 & 2032
- Table 29: Canada US Jam Jelly and Preserves Market Revenue (Million) Forecast, by Application 2019 & 2032
- Table 30: Canada US Jam Jelly and Preserves Market Volume (Liters) Forecast, by Application 2019 & 2032
- Table 31: Mexico US Jam Jelly and Preserves Market Revenue (Million) Forecast, by Application 2019 & 2032
- Table 32: Mexico US Jam Jelly and Preserves Market Volume (Liters) Forecast, by Application 2019 & 2032
- Table 33: Global US Jam Jelly and Preserves Market Revenue Million Forecast, by Product Type 2019 & 2032
- Table 34: Global US Jam Jelly and Preserves Market Volume Liters Forecast, by Product Type 2019 & 2032
- Table 35: Global US Jam Jelly and Preserves Market Revenue Million Forecast, by Distribution Channel 2019 & 2032
- Table 36: Global US Jam Jelly and Preserves Market Volume Liters Forecast, by Distribution Channel 2019 & 2032
- Table 37: Global US Jam Jelly and Preserves Market Revenue Million Forecast, by Country 2019 & 2032
- Table 38: Global US Jam Jelly and Preserves Market Volume Liters Forecast, by Country 2019 & 2032
- Table 39: Brazil US Jam Jelly and Preserves Market Revenue (Million) Forecast, by Application 2019 & 2032
- Table 40: Brazil US Jam Jelly and Preserves Market Volume (Liters) Forecast, by Application 2019 & 2032
- Table 41: Argentina US Jam Jelly and Preserves Market Revenue (Million) Forecast, by Application 2019 & 2032
- Table 42: Argentina US Jam Jelly and Preserves Market Volume (Liters) Forecast, by Application 2019 & 2032
- Table 43: Rest of South America US Jam Jelly and Preserves Market Revenue (Million) Forecast, by Application 2019 & 2032
- Table 44: Rest of South America US Jam Jelly and Preserves Market Volume (Liters) Forecast, by Application 2019 & 2032
- Table 45: Global US Jam Jelly and Preserves Market Revenue Million Forecast, by Product Type 2019 & 2032
- Table 46: Global US Jam Jelly and Preserves Market Volume Liters Forecast, by Product Type 2019 & 2032
- Table 47: Global US Jam Jelly and Preserves Market Revenue Million Forecast, by Distribution Channel 2019 & 2032
- Table 48: Global US Jam Jelly and Preserves Market Volume Liters Forecast, by Distribution Channel 2019 & 2032
- Table 49: Global US Jam Jelly and Preserves Market Revenue Million Forecast, by Country 2019 & 2032
- Table 50: Global US Jam Jelly and Preserves Market Volume Liters Forecast, by Country 2019 & 2032
- Table 51: United Kingdom US Jam Jelly and Preserves Market Revenue (Million) Forecast, by Application 2019 & 2032
- Table 52: United Kingdom US Jam Jelly and Preserves Market Volume (Liters) Forecast, by Application 2019 & 2032
- Table 53: Germany US Jam Jelly and Preserves Market Revenue (Million) Forecast, by Application 2019 & 2032
- Table 54: Germany US Jam Jelly and Preserves Market Volume (Liters) Forecast, by Application 2019 & 2032
- Table 55: France US Jam Jelly and Preserves Market Revenue (Million) Forecast, by Application 2019 & 2032
- Table 56: France US Jam Jelly and Preserves Market Volume (Liters) Forecast, by Application 2019 & 2032
- Table 57: Italy US Jam Jelly and Preserves Market Revenue (Million) Forecast, by Application 2019 & 2032
- Table 58: Italy US Jam Jelly and Preserves Market Volume (Liters) Forecast, by Application 2019 & 2032
- Table 59: Spain US Jam Jelly and Preserves Market Revenue (Million) Forecast, by Application 2019 & 2032
- Table 60: Spain US Jam Jelly and Preserves Market Volume (Liters) Forecast, by Application 2019 & 2032
- Table 61: Russia US Jam Jelly and Preserves Market Revenue (Million) Forecast, by Application 2019 & 2032
- Table 62: Russia US Jam Jelly and Preserves Market Volume (Liters) Forecast, by Application 2019 & 2032
- Table 63: Benelux US Jam Jelly and Preserves Market Revenue (Million) Forecast, by Application 2019 & 2032
- Table 64: Benelux US Jam Jelly and Preserves Market Volume (Liters) Forecast, by Application 2019 & 2032
- Table 65: Nordics US Jam Jelly and Preserves Market Revenue (Million) Forecast, by Application 2019 & 2032
- Table 66: Nordics US Jam Jelly and Preserves Market Volume (Liters) Forecast, by Application 2019 & 2032
- Table 67: Rest of Europe US Jam Jelly and Preserves Market Revenue (Million) Forecast, by Application 2019 & 2032
- Table 68: Rest of Europe US Jam Jelly and Preserves Market Volume (Liters) Forecast, by Application 2019 & 2032
- Table 69: Global US Jam Jelly and Preserves Market Revenue Million Forecast, by Product Type 2019 & 2032
- Table 70: Global US Jam Jelly and Preserves Market Volume Liters Forecast, by Product Type 2019 & 2032
- Table 71: Global US Jam Jelly and Preserves Market Revenue Million Forecast, by Distribution Channel 2019 & 2032
- Table 72: Global US Jam Jelly and Preserves Market Volume Liters Forecast, by Distribution Channel 2019 & 2032
- Table 73: Global US Jam Jelly and Preserves Market Revenue Million Forecast, by Country 2019 & 2032
- Table 74: Global US Jam Jelly and Preserves Market Volume Liters Forecast, by Country 2019 & 2032
- Table 75: Turkey US Jam Jelly and Preserves Market Revenue (Million) Forecast, by Application 2019 & 2032
- Table 76: Turkey US Jam Jelly and Preserves Market Volume (Liters) Forecast, by Application 2019 & 2032
- Table 77: Israel US Jam Jelly and Preserves Market Revenue (Million) Forecast, by Application 2019 & 2032
- Table 78: Israel US Jam Jelly and Preserves Market Volume (Liters) Forecast, by Application 2019 & 2032
- Table 79: GCC US Jam Jelly and Preserves Market Revenue (Million) Forecast, by Application 2019 & 2032
- Table 80: GCC US Jam Jelly and Preserves Market Volume (Liters) Forecast, by Application 2019 & 2032
- Table 81: North Africa US Jam Jelly and Preserves Market Revenue (Million) Forecast, by Application 2019 & 2032
- Table 82: North Africa US Jam Jelly and Preserves Market Volume (Liters) Forecast, by Application 2019 & 2032
- Table 83: South Africa US Jam Jelly and Preserves Market Revenue (Million) Forecast, by Application 2019 & 2032
- Table 84: South Africa US Jam Jelly and Preserves Market Volume (Liters) Forecast, by Application 2019 & 2032
- Table 85: Rest of Middle East & Africa US Jam Jelly and Preserves Market Revenue (Million) Forecast, by Application 2019 & 2032
- Table 86: Rest of Middle East & Africa US Jam Jelly and Preserves Market Volume (Liters) Forecast, by Application 2019 & 2032
- Table 87: Global US Jam Jelly and Preserves Market Revenue Million Forecast, by Product Type 2019 & 2032
- Table 88: Global US Jam Jelly and Preserves Market Volume Liters Forecast, by Product Type 2019 & 2032
- Table 89: Global US Jam Jelly and Preserves Market Revenue Million Forecast, by Distribution Channel 2019 & 2032
- Table 90: Global US Jam Jelly and Preserves Market Volume Liters Forecast, by Distribution Channel 2019 & 2032
- Table 91: Global US Jam Jelly and Preserves Market Revenue Million Forecast, by Country 2019 & 2032
- Table 92: Global US Jam Jelly and Preserves Market Volume Liters Forecast, by Country 2019 & 2032
- Table 93: China US Jam Jelly and Preserves Market Revenue (Million) Forecast, by Application 2019 & 2032
- Table 94: China US Jam Jelly and Preserves Market Volume (Liters) Forecast, by Application 2019 & 2032
- Table 95: India US Jam Jelly and Preserves Market Revenue (Million) Forecast, by Application 2019 & 2032
- Table 96: India US Jam Jelly and Preserves Market Volume (Liters) Forecast, by Application 2019 & 2032
- Table 97: Japan US Jam Jelly and Preserves Market Revenue (Million) Forecast, by Application 2019 & 2032
- Table 98: Japan US Jam Jelly and Preserves Market Volume (Liters) Forecast, by Application 2019 & 2032
- Table 99: South Korea US Jam Jelly and Preserves Market Revenue (Million) Forecast, by Application 2019 & 2032
- Table 100: South Korea US Jam Jelly and Preserves Market Volume (Liters) Forecast, by Application 2019 & 2032
- Table 101: ASEAN US Jam Jelly and Preserves Market Revenue (Million) Forecast, by Application 2019 & 2032
- Table 102: ASEAN US Jam Jelly and Preserves Market Volume (Liters) Forecast, by Application 2019 & 2032
- Table 103: Oceania US Jam Jelly and Preserves Market Revenue (Million) Forecast, by Application 2019 & 2032
- Table 104: Oceania US Jam Jelly and Preserves Market Volume (Liters) Forecast, by Application 2019 & 2032
- Table 105: Rest of Asia Pacific US Jam Jelly and Preserves Market Revenue (Million) Forecast, by Application 2019 & 2032
- Table 106: Rest of Asia Pacific US Jam Jelly and Preserves Market Volume (Liters) Forecast, by Application 2019 & 2032
Frequently Asked Questions
1. What is the projected Compound Annual Growth Rate (CAGR) of the US Jam Jelly and Preserves Market?
The projected CAGR is approximately 3.40%.
2. Which companies are prominent players in the US Jam Jelly and Preserves Market?
Key companies in the market include Murphy Orchards*List Not Exhaustive, B&G Foods Inc, Premier Foods Group Services Ltd, F Duerr & Sons Ltd, Wilkin & Sons Ltd, The Hain Celestial Group Inc, National Grape Cooperative Association, The J M Smucker Company, The Kraft Heinz Company, Andros Group, Conagra Foods Inc.
3. What are the main segments of the US Jam Jelly and Preserves Market?
The market segments include Product Type, Distribution Channel.
4. Can you provide details about the market size?
The market size is estimated to be USD 1430 Million as of 2022.
5. What are some drivers contributing to market growth?
Prevalence of Lactose Intolerance Driving the Market; Growing Influence of Healthy Lifestyle Trends and Rising Non-Traditional Users.
6. What are the notable trends driving market growth?
Increasing Demand for Organic Food Products.
7. Are there any restraints impacting market growth?
Wide Availability of Alternative Protein Sources.
8. Can you provide examples of recent developments in the market?
January 2023: Conagra Brands unveiled a new line of products, including the Snack Pack Starburst All Pink Juicy Gels. These delightful treats are specifically crafted with the signature all-pink flavor to replicate the irresistible experience of savoring a strawberry-flavored Starburst.
9. What pricing options are available for accessing the report?
Pricing options include single-user, multi-user, and enterprise licenses priced at USD 3800, USD 4500, and USD 5800 respectively.
10. Is the market size provided in terms of value or volume?
The market size is provided in terms of value, measured in Million and volume, measured in Liters.
11. Are there any specific market keywords associated with the report?
Yes, the market keyword associated with the report is "US Jam Jelly and Preserves Market," which aids in identifying and referencing the specific market segment covered.
12. How do I determine which pricing option suits my needs best?
The pricing options vary based on user requirements and access needs. Individual users may opt for single-user licenses, while businesses requiring broader access may choose multi-user or enterprise licenses for cost-effective access to the report.
13. Are there any additional resources or data provided in the US Jam Jelly and Preserves Market report?
While the report offers comprehensive insights, it's advisable to review the specific contents or supplementary materials provided to ascertain if additional resources or data are available.
14. How can I stay updated on further developments or reports in the US Jam Jelly and Preserves Market?
To stay informed about further developments, trends, and reports in the US Jam Jelly and Preserves Market, consider subscribing to industry newsletters, following relevant companies and organizations, or regularly checking reputable industry news sources and publications.
Methodology
Step 1 - Identification of Relevant Samples Size from Population Database


Step 2 - Approaches for Defining Global Market Size (Value, Volume* & Price*)

Note*: In applicable scenarios
Step 3 - Data Sources
Primary Research
- Web Analytics
- Survey Reports
- Research Institute
- Latest Research Reports
- Opinion Leaders
Secondary Research
- Annual Reports
- White Paper
- Latest Press Release
- Industry Association
- Paid Database
- Investor Presentations

Step 4 - Data Triangulation
Involves using different sources of information in order to increase the validity of a study
These sources are likely to be stakeholders in a program - participants, other researchers, program staff, other community members, and so on.
Then we put all data in single framework & apply various statistical tools to find out the dynamic on the market.
During the analysis stage, feedback from the stakeholder groups would be compared to determine areas of agreement as well as areas of divergence


