

Key Insights
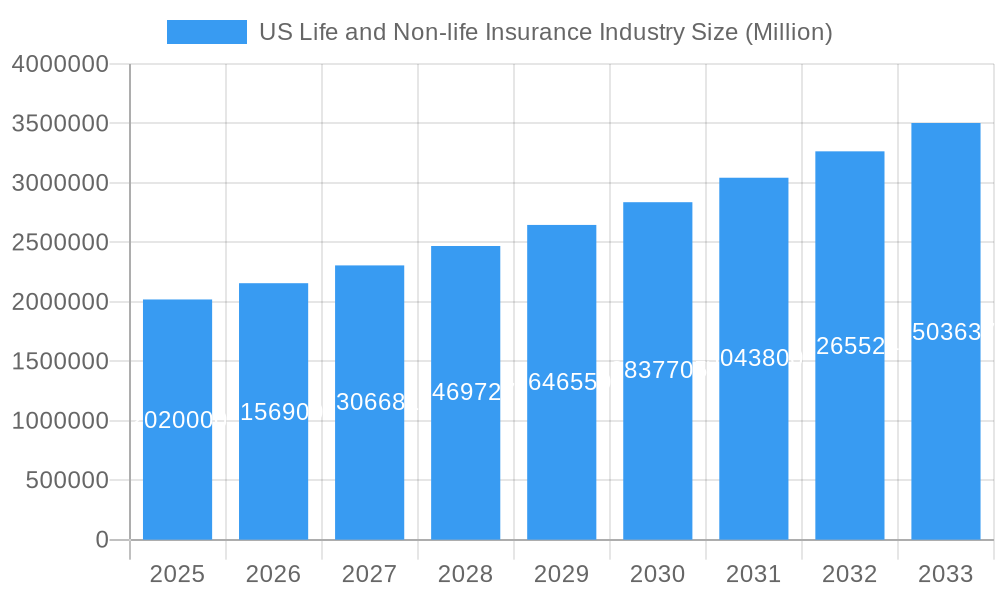
The US life and non-life insurance market, valued at $2.02 trillion in 2025, is projected to experience robust growth, fueled by several key factors. The aging population, increasing awareness of financial security needs, and rising disposable incomes are driving demand for both life and non-life insurance products. Furthermore, technological advancements, such as the adoption of InsurTech solutions for improved customer experience and streamlined processes, are contributing to market expansion. Government regulations aimed at consumer protection and financial stability also play a significant role in shaping the industry landscape. However, factors like economic downturns, increased competition from new entrants, and potential regulatory changes could pose challenges to sustained growth. The market segmentation is broad, encompassing various product categories within life (term, whole, universal) and non-life (auto, home, health) insurance. Major players like Massachusetts Mutual Life Insurance Company, UnitedHealth Group, Berkshire Hathaway, and others compete intensely, leading to innovation in product offerings and pricing strategies. The forecast period (2025-2033) anticipates a continuation of these trends, with a projected Compound Annual Growth Rate (CAGR) of 6.95%, indicating a substantial market expansion over the next decade.
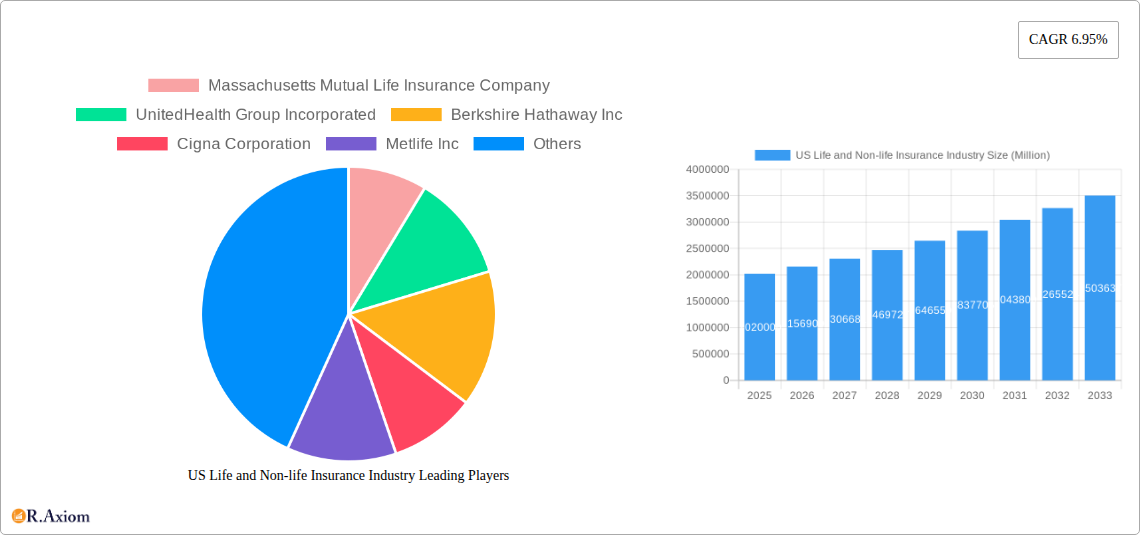
US Life and Non-life Insurance Industry Market Size (In Million)
The competitive landscape is characterized by a mix of established giants and emerging players. Established companies leverage their extensive networks and brand recognition to maintain market share, while newer companies often focus on niche markets and innovative technology to gain traction. The regional distribution of the market is likely skewed towards densely populated states with higher income levels. The historical period (2019-2024) likely witnessed fluctuating growth rates, influenced by economic conditions and regulatory changes. Future growth will depend on factors such as evolving consumer preferences, technological disruption, and the ability of insurance providers to adapt to changing market dynamics. Understanding these intricate factors is crucial for stakeholders to navigate the complexities of this dynamic market effectively.
US Life and Non-life Insurance Industry Company Market Share
US Life and Non-Life Insurance Industry: Market Analysis & Forecast (2019-2033)
This comprehensive report provides a detailed analysis of the US Life and Non-Life Insurance industry, covering market trends, competitive landscape, and future growth prospects. The study period spans from 2019 to 2033, with 2025 as the base and estimated year. The forecast period extends from 2025 to 2033, encompassing the historical period from 2019 to 2024. Key players analyzed include Massachusetts Mutual Life Insurance Company, UnitedHealth Group Incorporated, Berkshire Hathaway Inc, Cigna Corporation, Metlife Inc, Prudential Financial Inc, Aetna Inc, Centene Corporation, American International Group Inc, and State Farm (list not exhaustive).
US Life and Non-life Insurance Industry Market Concentration & Innovation
This section analyzes the market concentration, innovation drivers, regulatory frameworks, product substitutes, end-user trends, and M&A activities within the US Life and Non-Life Insurance industry. Market concentration is assessed through metrics such as market share held by leading players. The report also examines the impact of regulatory changes (e.g., Affordable Care Act) on market dynamics. Innovation drivers include technological advancements (e.g., AI, Big Data analytics for risk assessment) and evolving consumer preferences. The analysis incorporates data on M&A activities, including deal values and their influence on market consolidation. For example, while precise market share figures for each company require detailed data analysis, we predict a highly concentrated market with the top 10 companies holding approximately xx% of the total market share in 2025. M&A activity during the historical period involved deals valued at approximately USD xx million, primarily focused on expanding market reach and product portfolios.
US Life and Non-life Insurance Industry Industry Trends & Insights
This section delves into the key trends shaping the US Life and Non-Life Insurance landscape. It examines market growth drivers such as increasing health awareness, aging population, and rising disposable incomes. Technological disruptions, including the adoption of InsurTech solutions and digital platforms, are analyzed for their impact on efficiency and customer experience. The report explores shifts in consumer preferences toward personalized products and digital interactions, highlighting the competitive dynamics among established players and emerging InsurTech companies. The Compound Annual Growth Rate (CAGR) during the forecast period is projected to be approximately xx%, driven by increased demand for various insurance products and the expansion of digital channels. Market penetration is expected to reach approximately xx% by 2033.
Dominant Markets & Segments in US Life and Non-life Insurance Industry
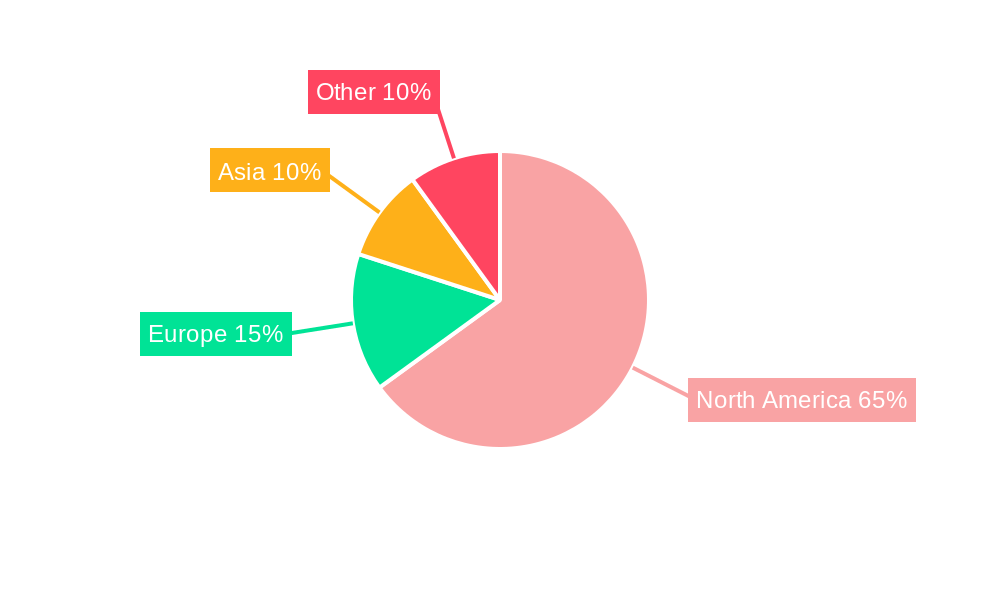
This section identifies the dominant segments within the US Life and Non-Life Insurance market. The analysis focuses on regional variations in market size and growth, pinpointing the leading regions and states based on factors such as population density, economic strength, and regulatory environment. Key drivers contributing to the dominance of specific segments are discussed in detail.
- Key Drivers of Dominance:
- Favorable demographics (e.g., aging population in certain regions).
- Robust economic growth and higher disposable incomes.
- Supportive government policies and regulations.
- Well-developed healthcare infrastructure.
- High levels of insurance penetration.
The report offers a detailed analysis of the dominant segment's characteristics and growth trajectory, examining factors influencing its market leadership.
US Life and Non-life Insurance Industry Product Developments
Recent product innovations in the US Life and Non-life Insurance industry focus on personalized, data-driven solutions. Insurers are leveraging technology to offer customized products, improved risk assessment, and enhanced customer experience through digital platforms and mobile applications. The integration of AI and machine learning is driving advancements in fraud detection, claims processing, and customer service. These innovations aim to improve market fit by catering to specific customer needs and offering competitive advantages in terms of pricing and service.
Report Scope & Segmentation Analysis
This report segments the US Life and Non-Life Insurance market along various dimensions, including product type (life insurance, health insurance, property and casualty insurance, etc.), distribution channel (direct sales, agents, brokers, online platforms), and customer segment (individuals, businesses, etc.). Each segment's growth projections, market size, and competitive dynamics are analyzed separately. For instance, the health insurance segment is projected to witness significant growth, driven by the increasing prevalence of chronic diseases and rising healthcare costs. The competitive landscape within each segment is explored, highlighting the strategies employed by leading players.
Key Drivers of US Life and Non-life Insurance Industry Growth
The US Life and Non-Life Insurance industry's growth is propelled by several key factors. Technological advancements, such as AI and big data analytics, are improving efficiency and personalization of insurance products. Economic factors like rising disposable incomes and increased awareness of financial security needs drive demand. Favorable regulatory policies supporting insurance innovation and consumer protection further stimulate market expansion. For instance, the increasing adoption of telemedicine is creating opportunities for insurance providers to offer innovative health insurance products.
Challenges in the US Life and Non-life Insurance Industry Sector
The industry faces challenges including stringent regulations, increasing competition from InsurTech startups, and the need to adapt to evolving customer expectations. Cybersecurity threats and data privacy concerns pose significant risks. Supply chain disruptions can impact the availability of insurance services. These factors can lead to decreased profitability and hinder market growth. For example, regulatory compliance costs amount to approximately USD xx million annually for the top 10 insurers.
Emerging Opportunities in US Life and Non-life Insurance Industry
Emerging opportunities include the expansion of InsurTech solutions, particularly AI and machine learning, to enhance efficiency, personalize products, and improve risk assessment. Growth is also expected in niche insurance segments such as cyber insurance and pet insurance. Furthermore, expanding into underserved markets and leveraging personalized digital marketing strategies offer significant potential for market expansion.
Leading Players in the US Life and Non-life Insurance Industry Market
Key Developments in US Life and Non-life Insurance Industry Industry
- 2022: UnitedHealth Group invested USD 100 million in health worker diversity to improve healthcare access, affordability, and outcomes.
- 2021: Cigna launched its Cigna ID card, providing clients with anytime, anywhere access to in-network doctors, care, and cost estimates.
Strategic Outlook for US Life and Non-life Insurance Industry Market
The US Life and Non-Life Insurance industry is poised for continued growth, driven by technological innovation, evolving consumer needs, and favorable economic conditions. The increasing adoption of digital technologies and personalized products will further shape market dynamics. Opportunities exist for insurers to leverage data analytics, AI, and InsurTech solutions to enhance operational efficiency, improve customer experience, and expand into new markets. The focus on preventative care and wellness programs will also influence future market development.
US Life and Non-life Insurance Industry Segmentation
-
1. Insurance type
-
1.1. Life Insurance
- 1.1.1. Individual
- 1.1.2. Group
-
1.2. Non-life Insurance
- 1.2.1. Home
- 1.2.2. Motor
- 1.2.3. Other Non-life Insurances
-
1.1. Life Insurance
-
2. Distribution Channel
- 2.1. Direct
- 2.2. Agency
- 2.3. Banks
- 2.4. Other Distribution Channels
US Life and Non-life Insurance Industry Segmentation By Geography
-
1. North America
- 1.1. United States
- 1.2. Canada
- 1.3. Mexico
-
2. South America
- 2.1. Brazil
- 2.2. Argentina
- 2.3. Rest of South America
-
3. Europe
- 3.1. United Kingdom
- 3.2. Germany
- 3.3. France
- 3.4. Italy
- 3.5. Spain
- 3.6. Russia
- 3.7. Benelux
- 3.8. Nordics
- 3.9. Rest of Europe
-
4. Middle East & Africa
- 4.1. Turkey
- 4.2. Israel
- 4.3. GCC
- 4.4. North Africa
- 4.5. South Africa
- 4.6. Rest of Middle East & Africa
-
5. Asia Pacific
- 5.1. China
- 5.2. India
- 5.3. Japan
- 5.4. South Korea
- 5.5. ASEAN
- 5.6. Oceania
- 5.7. Rest of Asia Pacific
US Life and Non-life Insurance Industry Regional Market Share
Geographic Coverage of US Life and Non-life Insurance Industry
US Life and Non-life Insurance Industry REPORT HIGHLIGHTS
| Aspects | Details |
|---|---|
| Study Period | 2020-2034 |
| Base Year | 2025 |
| Estimated Year | 2026 |
| Forecast Period | 2026-2034 |
| Historical Period | 2020-2025 |
| Growth Rate | CAGR of 6.95% from 2020-2034 |
| Segmentation |
|
Table of Contents
- 1. Introduction
- 1.1. Research Scope
- 1.2. Market Segmentation
- 1.3. Research Objective
- 1.4. Definitions and Assumptions
- 2. Executive Summary
- 2.1. Market Snapshot
- 3. Market Dynamics
- 3.1. Market Drivers
- 3.2. Market Restrains
- 3.3. Market Trends
- 3.4. Market Opportunities
- 4. Market Factor Analysis
- 4.1. Porters Five Forces
- 4.1.1. Bargaining Power of Suppliers
- 4.1.2. Bargaining Power of Buyers
- 4.1.3. Threat of New Entrants
- 4.1.4. Threat of Substitutes
- 4.1.5. Competitive Rivalry
- 4.2. PESTEL analysis
- 4.3. BCG Analysis
- 4.3.1. Stars (High Growth, High Market Share)
- 4.3.2. Cash Cows (Low Growth, High Market Share)
- 4.3.3. Question Mark (High Growth, Low Market Share)
- 4.3.4. Dogs (Low Growth, Low Market Share)
- 4.4. Ansoff Matrix Analysis
- 4.5. Supply Chain Analysis
- 4.6. Regulatory Landscape
- 4.7. Current Market Potential and Opportunity Assessment (TAM–SAM–SOM Framework)
- 4.8. RAX Analyst Note
- 4.1. Porters Five Forces
- 5. Market Analysis, Insights and Forecast 2021-2033
- 5.1. Market Analysis, Insights and Forecast - by Insurance type
- 5.1.1. Life Insurance
- 5.1.1.1. Individual
- 5.1.1.2. Group
- 5.1.2. Non-life Insurance
- 5.1.2.1. Home
- 5.1.2.2. Motor
- 5.1.2.3. Other Non-life Insurances
- 5.1.1. Life Insurance
- 5.2. Market Analysis, Insights and Forecast - by Distribution Channel
- 5.2.1. Direct
- 5.2.2. Agency
- 5.2.3. Banks
- 5.2.4. Other Distribution Channels
- 5.3. Market Analysis, Insights and Forecast - by Region
- 5.3.1. North America
- 5.3.2. South America
- 5.3.3. Europe
- 5.3.4. Middle East & Africa
- 5.3.5. Asia Pacific
- 5.1. Market Analysis, Insights and Forecast - by Insurance type
- 6. Global US Life and Non-life Insurance Industry Analysis, Insights and Forecast, 2021-2033
- 6.1. Market Analysis, Insights and Forecast - by Insurance type
- 6.1.1. Life Insurance
- 6.1.1.1. Individual
- 6.1.1.2. Group
- 6.1.2. Non-life Insurance
- 6.1.2.1. Home
- 6.1.2.2. Motor
- 6.1.2.3. Other Non-life Insurances
- 6.1.1. Life Insurance
- 6.2. Market Analysis, Insights and Forecast - by Distribution Channel
- 6.2.1. Direct
- 6.2.2. Agency
- 6.2.3. Banks
- 6.2.4. Other Distribution Channels
- 6.1. Market Analysis, Insights and Forecast - by Insurance type
- 7. North America US Life and Non-life Insurance Industry Analysis, Insights and Forecast, 2020-2032
- 7.1. Market Analysis, Insights and Forecast - by Insurance type
- 7.1.1. Life Insurance
- 7.1.1.1. Individual
- 7.1.1.2. Group
- 7.1.2. Non-life Insurance
- 7.1.2.1. Home
- 7.1.2.2. Motor
- 7.1.2.3. Other Non-life Insurances
- 7.1.1. Life Insurance
- 7.2. Market Analysis, Insights and Forecast - by Distribution Channel
- 7.2.1. Direct
- 7.2.2. Agency
- 7.2.3. Banks
- 7.2.4. Other Distribution Channels
- 7.1. Market Analysis, Insights and Forecast - by Insurance type
- 8. South America US Life and Non-life Insurance Industry Analysis, Insights and Forecast, 2020-2032
- 8.1. Market Analysis, Insights and Forecast - by Insurance type
- 8.1.1. Life Insurance
- 8.1.1.1. Individual
- 8.1.1.2. Group
- 8.1.2. Non-life Insurance
- 8.1.2.1. Home
- 8.1.2.2. Motor
- 8.1.2.3. Other Non-life Insurances
- 8.1.1. Life Insurance
- 8.2. Market Analysis, Insights and Forecast - by Distribution Channel
- 8.2.1. Direct
- 8.2.2. Agency
- 8.2.3. Banks
- 8.2.4. Other Distribution Channels
- 8.1. Market Analysis, Insights and Forecast - by Insurance type
- 9. Europe US Life and Non-life Insurance Industry Analysis, Insights and Forecast, 2020-2032
- 9.1. Market Analysis, Insights and Forecast - by Insurance type
- 9.1.1. Life Insurance
- 9.1.1.1. Individual
- 9.1.1.2. Group
- 9.1.2. Non-life Insurance
- 9.1.2.1. Home
- 9.1.2.2. Motor
- 9.1.2.3. Other Non-life Insurances
- 9.1.1. Life Insurance
- 9.2. Market Analysis, Insights and Forecast - by Distribution Channel
- 9.2.1. Direct
- 9.2.2. Agency
- 9.2.3. Banks
- 9.2.4. Other Distribution Channels
- 9.1. Market Analysis, Insights and Forecast - by Insurance type
- 10. Middle East & Africa US Life and Non-life Insurance Industry Analysis, Insights and Forecast, 2020-2032
- 10.1. Market Analysis, Insights and Forecast - by Insurance type
- 10.1.1. Life Insurance
- 10.1.1.1. Individual
- 10.1.1.2. Group
- 10.1.2. Non-life Insurance
- 10.1.2.1. Home
- 10.1.2.2. Motor
- 10.1.2.3. Other Non-life Insurances
- 10.1.1. Life Insurance
- 10.2. Market Analysis, Insights and Forecast - by Distribution Channel
- 10.2.1. Direct
- 10.2.2. Agency
- 10.2.3. Banks
- 10.2.4. Other Distribution Channels
- 10.1. Market Analysis, Insights and Forecast - by Insurance type
- 11. Asia Pacific US Life and Non-life Insurance Industry Analysis, Insights and Forecast, 2020-2032
- 11.1. Market Analysis, Insights and Forecast - by Insurance type
- 11.1.1. Life Insurance
- 11.1.1.1. Individual
- 11.1.1.2. Group
- 11.1.2. Non-life Insurance
- 11.1.2.1. Home
- 11.1.2.2. Motor
- 11.1.2.3. Other Non-life Insurances
- 11.1.1. Life Insurance
- 11.2. Market Analysis, Insights and Forecast - by Distribution Channel
- 11.2.1. Direct
- 11.2.2. Agency
- 11.2.3. Banks
- 11.2.4. Other Distribution Channels
- 11.1. Market Analysis, Insights and Forecast - by Insurance type
- 12. Competitive Analysis
- 12.1. Company Profiles
- 12.1.1 Massachusetts Mutual Life Insurance Company
- 12.1.1.1. Company Overview
- 12.1.1.2. Products
- 12.1.1.3. Company Financials
- 12.1.1.4. SWOT Analysis
- 12.1.2 UnitedHealth Group Incorporated
- 12.1.2.1. Company Overview
- 12.1.2.2. Products
- 12.1.2.3. Company Financials
- 12.1.2.4. SWOT Analysis
- 12.1.3 Berkshire Hathaway Inc
- 12.1.3.1. Company Overview
- 12.1.3.2. Products
- 12.1.3.3. Company Financials
- 12.1.3.4. SWOT Analysis
- 12.1.4 Cigna Corporation
- 12.1.4.1. Company Overview
- 12.1.4.2. Products
- 12.1.4.3. Company Financials
- 12.1.4.4. SWOT Analysis
- 12.1.5 Metlife Inc
- 12.1.5.1. Company Overview
- 12.1.5.2. Products
- 12.1.5.3. Company Financials
- 12.1.5.4. SWOT Analysis
- 12.1.6 Prudential Financial Inc
- 12.1.6.1. Company Overview
- 12.1.6.2. Products
- 12.1.6.3. Company Financials
- 12.1.6.4. SWOT Analysis
- 12.1.7 Aetna Inc
- 12.1.7.1. Company Overview
- 12.1.7.2. Products
- 12.1.7.3. Company Financials
- 12.1.7.4. SWOT Analysis
- 12.1.8 Centene Corporation
- 12.1.8.1. Company Overview
- 12.1.8.2. Products
- 12.1.8.3. Company Financials
- 12.1.8.4. SWOT Analysis
- 12.1.9 American International Group Inc
- 12.1.9.1. Company Overview
- 12.1.9.2. Products
- 12.1.9.3. Company Financials
- 12.1.9.4. SWOT Analysis
- 12.1.10 State Farm**List Not Exhaustive
- 12.1.10.1. Company Overview
- 12.1.10.2. Products
- 12.1.10.3. Company Financials
- 12.1.10.4. SWOT Analysis
- 12.1.1 Massachusetts Mutual Life Insurance Company
- 12.2. Market Entropy
- 12.2.1 Company's Key Areas Served
- 12.2.2 Recent Developments
- 12.3. Company Market Share Analysis 2025
- 12.3.1 Top 5 Companies Market Share Analysis
- 12.3.2 Top 3 Companies Market Share Analysis
- 12.4. List of Potential Customers
- 13. Research Methodology
List of Figures
- Figure 1: Global US Life and Non-life Insurance Industry Revenue Breakdown (Million, %) by Region 2025 & 2033
- Figure 2: Global US Life and Non-life Insurance Industry Volume Breakdown (Trillion, %) by Region 2025 & 2033
- Figure 3: North America US Life and Non-life Insurance Industry Revenue (Million), by Insurance type 2025 & 2033
- Figure 4: North America US Life and Non-life Insurance Industry Volume (Trillion), by Insurance type 2025 & 2033
- Figure 5: North America US Life and Non-life Insurance Industry Revenue Share (%), by Insurance type 2025 & 2033
- Figure 6: North America US Life and Non-life Insurance Industry Volume Share (%), by Insurance type 2025 & 2033
- Figure 7: North America US Life and Non-life Insurance Industry Revenue (Million), by Distribution Channel 2025 & 2033
- Figure 8: North America US Life and Non-life Insurance Industry Volume (Trillion), by Distribution Channel 2025 & 2033
- Figure 9: North America US Life and Non-life Insurance Industry Revenue Share (%), by Distribution Channel 2025 & 2033
- Figure 10: North America US Life and Non-life Insurance Industry Volume Share (%), by Distribution Channel 2025 & 2033
- Figure 11: North America US Life and Non-life Insurance Industry Revenue (Million), by Country 2025 & 2033
- Figure 12: North America US Life and Non-life Insurance Industry Volume (Trillion), by Country 2025 & 2033
- Figure 13: North America US Life and Non-life Insurance Industry Revenue Share (%), by Country 2025 & 2033
- Figure 14: North America US Life and Non-life Insurance Industry Volume Share (%), by Country 2025 & 2033
- Figure 15: South America US Life and Non-life Insurance Industry Revenue (Million), by Insurance type 2025 & 2033
- Figure 16: South America US Life and Non-life Insurance Industry Volume (Trillion), by Insurance type 2025 & 2033
- Figure 17: South America US Life and Non-life Insurance Industry Revenue Share (%), by Insurance type 2025 & 2033
- Figure 18: South America US Life and Non-life Insurance Industry Volume Share (%), by Insurance type 2025 & 2033
- Figure 19: South America US Life and Non-life Insurance Industry Revenue (Million), by Distribution Channel 2025 & 2033
- Figure 20: South America US Life and Non-life Insurance Industry Volume (Trillion), by Distribution Channel 2025 & 2033
- Figure 21: South America US Life and Non-life Insurance Industry Revenue Share (%), by Distribution Channel 2025 & 2033
- Figure 22: South America US Life and Non-life Insurance Industry Volume Share (%), by Distribution Channel 2025 & 2033
- Figure 23: South America US Life and Non-life Insurance Industry Revenue (Million), by Country 2025 & 2033
- Figure 24: South America US Life and Non-life Insurance Industry Volume (Trillion), by Country 2025 & 2033
- Figure 25: South America US Life and Non-life Insurance Industry Revenue Share (%), by Country 2025 & 2033
- Figure 26: South America US Life and Non-life Insurance Industry Volume Share (%), by Country 2025 & 2033
- Figure 27: Europe US Life and Non-life Insurance Industry Revenue (Million), by Insurance type 2025 & 2033
- Figure 28: Europe US Life and Non-life Insurance Industry Volume (Trillion), by Insurance type 2025 & 2033
- Figure 29: Europe US Life and Non-life Insurance Industry Revenue Share (%), by Insurance type 2025 & 2033
- Figure 30: Europe US Life and Non-life Insurance Industry Volume Share (%), by Insurance type 2025 & 2033
- Figure 31: Europe US Life and Non-life Insurance Industry Revenue (Million), by Distribution Channel 2025 & 2033
- Figure 32: Europe US Life and Non-life Insurance Industry Volume (Trillion), by Distribution Channel 2025 & 2033
- Figure 33: Europe US Life and Non-life Insurance Industry Revenue Share (%), by Distribution Channel 2025 & 2033
- Figure 34: Europe US Life and Non-life Insurance Industry Volume Share (%), by Distribution Channel 2025 & 2033
- Figure 35: Europe US Life and Non-life Insurance Industry Revenue (Million), by Country 2025 & 2033
- Figure 36: Europe US Life and Non-life Insurance Industry Volume (Trillion), by Country 2025 & 2033
- Figure 37: Europe US Life and Non-life Insurance Industry Revenue Share (%), by Country 2025 & 2033
- Figure 38: Europe US Life and Non-life Insurance Industry Volume Share (%), by Country 2025 & 2033
- Figure 39: Middle East & Africa US Life and Non-life Insurance Industry Revenue (Million), by Insurance type 2025 & 2033
- Figure 40: Middle East & Africa US Life and Non-life Insurance Industry Volume (Trillion), by Insurance type 2025 & 2033
- Figure 41: Middle East & Africa US Life and Non-life Insurance Industry Revenue Share (%), by Insurance type 2025 & 2033
- Figure 42: Middle East & Africa US Life and Non-life Insurance Industry Volume Share (%), by Insurance type 2025 & 2033
- Figure 43: Middle East & Africa US Life and Non-life Insurance Industry Revenue (Million), by Distribution Channel 2025 & 2033
- Figure 44: Middle East & Africa US Life and Non-life Insurance Industry Volume (Trillion), by Distribution Channel 2025 & 2033
- Figure 45: Middle East & Africa US Life and Non-life Insurance Industry Revenue Share (%), by Distribution Channel 2025 & 2033
- Figure 46: Middle East & Africa US Life and Non-life Insurance Industry Volume Share (%), by Distribution Channel 2025 & 2033
- Figure 47: Middle East & Africa US Life and Non-life Insurance Industry Revenue (Million), by Country 2025 & 2033
- Figure 48: Middle East & Africa US Life and Non-life Insurance Industry Volume (Trillion), by Country 2025 & 2033
- Figure 49: Middle East & Africa US Life and Non-life Insurance Industry Revenue Share (%), by Country 2025 & 2033
- Figure 50: Middle East & Africa US Life and Non-life Insurance Industry Volume Share (%), by Country 2025 & 2033
- Figure 51: Asia Pacific US Life and Non-life Insurance Industry Revenue (Million), by Insurance type 2025 & 2033
- Figure 52: Asia Pacific US Life and Non-life Insurance Industry Volume (Trillion), by Insurance type 2025 & 2033
- Figure 53: Asia Pacific US Life and Non-life Insurance Industry Revenue Share (%), by Insurance type 2025 & 2033
- Figure 54: Asia Pacific US Life and Non-life Insurance Industry Volume Share (%), by Insurance type 2025 & 2033
- Figure 55: Asia Pacific US Life and Non-life Insurance Industry Revenue (Million), by Distribution Channel 2025 & 2033
- Figure 56: Asia Pacific US Life and Non-life Insurance Industry Volume (Trillion), by Distribution Channel 2025 & 2033
- Figure 57: Asia Pacific US Life and Non-life Insurance Industry Revenue Share (%), by Distribution Channel 2025 & 2033
- Figure 58: Asia Pacific US Life and Non-life Insurance Industry Volume Share (%), by Distribution Channel 2025 & 2033
- Figure 59: Asia Pacific US Life and Non-life Insurance Industry Revenue (Million), by Country 2025 & 2033
- Figure 60: Asia Pacific US Life and Non-life Insurance Industry Volume (Trillion), by Country 2025 & 2033
- Figure 61: Asia Pacific US Life and Non-life Insurance Industry Revenue Share (%), by Country 2025 & 2033
- Figure 62: Asia Pacific US Life and Non-life Insurance Industry Volume Share (%), by Country 2025 & 2033
List of Tables
- Table 1: Global US Life and Non-life Insurance Industry Revenue Million Forecast, by Insurance type 2020 & 2033
- Table 2: Global US Life and Non-life Insurance Industry Volume Trillion Forecast, by Insurance type 2020 & 2033
- Table 3: Global US Life and Non-life Insurance Industry Revenue Million Forecast, by Distribution Channel 2020 & 2033
- Table 4: Global US Life and Non-life Insurance Industry Volume Trillion Forecast, by Distribution Channel 2020 & 2033
- Table 5: Global US Life and Non-life Insurance Industry Revenue Million Forecast, by Region 2020 & 2033
- Table 6: Global US Life and Non-life Insurance Industry Volume Trillion Forecast, by Region 2020 & 2033
- Table 7: Global US Life and Non-life Insurance Industry Revenue Million Forecast, by Insurance type 2020 & 2033
- Table 8: Global US Life and Non-life Insurance Industry Volume Trillion Forecast, by Insurance type 2020 & 2033
- Table 9: Global US Life and Non-life Insurance Industry Revenue Million Forecast, by Distribution Channel 2020 & 2033
- Table 10: Global US Life and Non-life Insurance Industry Volume Trillion Forecast, by Distribution Channel 2020 & 2033
- Table 11: Global US Life and Non-life Insurance Industry Revenue Million Forecast, by Country 2020 & 2033
- Table 12: Global US Life and Non-life Insurance Industry Volume Trillion Forecast, by Country 2020 & 2033
- Table 13: United States US Life and Non-life Insurance Industry Revenue (Million) Forecast, by Application 2020 & 2033
- Table 14: United States US Life and Non-life Insurance Industry Volume (Trillion) Forecast, by Application 2020 & 2033
- Table 15: Canada US Life and Non-life Insurance Industry Revenue (Million) Forecast, by Application 2020 & 2033
- Table 16: Canada US Life and Non-life Insurance Industry Volume (Trillion) Forecast, by Application 2020 & 2033
- Table 17: Mexico US Life and Non-life Insurance Industry Revenue (Million) Forecast, by Application 2020 & 2033
- Table 18: Mexico US Life and Non-life Insurance Industry Volume (Trillion) Forecast, by Application 2020 & 2033
- Table 19: Global US Life and Non-life Insurance Industry Revenue Million Forecast, by Insurance type 2020 & 2033
- Table 20: Global US Life and Non-life Insurance Industry Volume Trillion Forecast, by Insurance type 2020 & 2033
- Table 21: Global US Life and Non-life Insurance Industry Revenue Million Forecast, by Distribution Channel 2020 & 2033
- Table 22: Global US Life and Non-life Insurance Industry Volume Trillion Forecast, by Distribution Channel 2020 & 2033
- Table 23: Global US Life and Non-life Insurance Industry Revenue Million Forecast, by Country 2020 & 2033
- Table 24: Global US Life and Non-life Insurance Industry Volume Trillion Forecast, by Country 2020 & 2033
- Table 25: Brazil US Life and Non-life Insurance Industry Revenue (Million) Forecast, by Application 2020 & 2033
- Table 26: Brazil US Life and Non-life Insurance Industry Volume (Trillion) Forecast, by Application 2020 & 2033
- Table 27: Argentina US Life and Non-life Insurance Industry Revenue (Million) Forecast, by Application 2020 & 2033
- Table 28: Argentina US Life and Non-life Insurance Industry Volume (Trillion) Forecast, by Application 2020 & 2033
- Table 29: Rest of South America US Life and Non-life Insurance Industry Revenue (Million) Forecast, by Application 2020 & 2033
- Table 30: Rest of South America US Life and Non-life Insurance Industry Volume (Trillion) Forecast, by Application 2020 & 2033
- Table 31: Global US Life and Non-life Insurance Industry Revenue Million Forecast, by Insurance type 2020 & 2033
- Table 32: Global US Life and Non-life Insurance Industry Volume Trillion Forecast, by Insurance type 2020 & 2033
- Table 33: Global US Life and Non-life Insurance Industry Revenue Million Forecast, by Distribution Channel 2020 & 2033
- Table 34: Global US Life and Non-life Insurance Industry Volume Trillion Forecast, by Distribution Channel 2020 & 2033
- Table 35: Global US Life and Non-life Insurance Industry Revenue Million Forecast, by Country 2020 & 2033
- Table 36: Global US Life and Non-life Insurance Industry Volume Trillion Forecast, by Country 2020 & 2033
- Table 37: United Kingdom US Life and Non-life Insurance Industry Revenue (Million) Forecast, by Application 2020 & 2033
- Table 38: United Kingdom US Life and Non-life Insurance Industry Volume (Trillion) Forecast, by Application 2020 & 2033
- Table 39: Germany US Life and Non-life Insurance Industry Revenue (Million) Forecast, by Application 2020 & 2033
- Table 40: Germany US Life and Non-life Insurance Industry Volume (Trillion) Forecast, by Application 2020 & 2033
- Table 41: France US Life and Non-life Insurance Industry Revenue (Million) Forecast, by Application 2020 & 2033
- Table 42: France US Life and Non-life Insurance Industry Volume (Trillion) Forecast, by Application 2020 & 2033
- Table 43: Italy US Life and Non-life Insurance Industry Revenue (Million) Forecast, by Application 2020 & 2033
- Table 44: Italy US Life and Non-life Insurance Industry Volume (Trillion) Forecast, by Application 2020 & 2033
- Table 45: Spain US Life and Non-life Insurance Industry Revenue (Million) Forecast, by Application 2020 & 2033
- Table 46: Spain US Life and Non-life Insurance Industry Volume (Trillion) Forecast, by Application 2020 & 2033
- Table 47: Russia US Life and Non-life Insurance Industry Revenue (Million) Forecast, by Application 2020 & 2033
- Table 48: Russia US Life and Non-life Insurance Industry Volume (Trillion) Forecast, by Application 2020 & 2033
- Table 49: Benelux US Life and Non-life Insurance Industry Revenue (Million) Forecast, by Application 2020 & 2033
- Table 50: Benelux US Life and Non-life Insurance Industry Volume (Trillion) Forecast, by Application 2020 & 2033
- Table 51: Nordics US Life and Non-life Insurance Industry Revenue (Million) Forecast, by Application 2020 & 2033
- Table 52: Nordics US Life and Non-life Insurance Industry Volume (Trillion) Forecast, by Application 2020 & 2033
- Table 53: Rest of Europe US Life and Non-life Insurance Industry Revenue (Million) Forecast, by Application 2020 & 2033
- Table 54: Rest of Europe US Life and Non-life Insurance Industry Volume (Trillion) Forecast, by Application 2020 & 2033
- Table 55: Global US Life and Non-life Insurance Industry Revenue Million Forecast, by Insurance type 2020 & 2033
- Table 56: Global US Life and Non-life Insurance Industry Volume Trillion Forecast, by Insurance type 2020 & 2033
- Table 57: Global US Life and Non-life Insurance Industry Revenue Million Forecast, by Distribution Channel 2020 & 2033
- Table 58: Global US Life and Non-life Insurance Industry Volume Trillion Forecast, by Distribution Channel 2020 & 2033
- Table 59: Global US Life and Non-life Insurance Industry Revenue Million Forecast, by Country 2020 & 2033
- Table 60: Global US Life and Non-life Insurance Industry Volume Trillion Forecast, by Country 2020 & 2033
- Table 61: Turkey US Life and Non-life Insurance Industry Revenue (Million) Forecast, by Application 2020 & 2033
- Table 62: Turkey US Life and Non-life Insurance Industry Volume (Trillion) Forecast, by Application 2020 & 2033
- Table 63: Israel US Life and Non-life Insurance Industry Revenue (Million) Forecast, by Application 2020 & 2033
- Table 64: Israel US Life and Non-life Insurance Industry Volume (Trillion) Forecast, by Application 2020 & 2033
- Table 65: GCC US Life and Non-life Insurance Industry Revenue (Million) Forecast, by Application 2020 & 2033
- Table 66: GCC US Life and Non-life Insurance Industry Volume (Trillion) Forecast, by Application 2020 & 2033
- Table 67: North Africa US Life and Non-life Insurance Industry Revenue (Million) Forecast, by Application 2020 & 2033
- Table 68: North Africa US Life and Non-life Insurance Industry Volume (Trillion) Forecast, by Application 2020 & 2033
- Table 69: South Africa US Life and Non-life Insurance Industry Revenue (Million) Forecast, by Application 2020 & 2033
- Table 70: South Africa US Life and Non-life Insurance Industry Volume (Trillion) Forecast, by Application 2020 & 2033
- Table 71: Rest of Middle East & Africa US Life and Non-life Insurance Industry Revenue (Million) Forecast, by Application 2020 & 2033
- Table 72: Rest of Middle East & Africa US Life and Non-life Insurance Industry Volume (Trillion) Forecast, by Application 2020 & 2033
- Table 73: Global US Life and Non-life Insurance Industry Revenue Million Forecast, by Insurance type 2020 & 2033
- Table 74: Global US Life and Non-life Insurance Industry Volume Trillion Forecast, by Insurance type 2020 & 2033
- Table 75: Global US Life and Non-life Insurance Industry Revenue Million Forecast, by Distribution Channel 2020 & 2033
- Table 76: Global US Life and Non-life Insurance Industry Volume Trillion Forecast, by Distribution Channel 2020 & 2033
- Table 77: Global US Life and Non-life Insurance Industry Revenue Million Forecast, by Country 2020 & 2033
- Table 78: Global US Life and Non-life Insurance Industry Volume Trillion Forecast, by Country 2020 & 2033
- Table 79: China US Life and Non-life Insurance Industry Revenue (Million) Forecast, by Application 2020 & 2033
- Table 80: China US Life and Non-life Insurance Industry Volume (Trillion) Forecast, by Application 2020 & 2033
- Table 81: India US Life and Non-life Insurance Industry Revenue (Million) Forecast, by Application 2020 & 2033
- Table 82: India US Life and Non-life Insurance Industry Volume (Trillion) Forecast, by Application 2020 & 2033
- Table 83: Japan US Life and Non-life Insurance Industry Revenue (Million) Forecast, by Application 2020 & 2033
- Table 84: Japan US Life and Non-life Insurance Industry Volume (Trillion) Forecast, by Application 2020 & 2033
- Table 85: South Korea US Life and Non-life Insurance Industry Revenue (Million) Forecast, by Application 2020 & 2033
- Table 86: South Korea US Life and Non-life Insurance Industry Volume (Trillion) Forecast, by Application 2020 & 2033
- Table 87: ASEAN US Life and Non-life Insurance Industry Revenue (Million) Forecast, by Application 2020 & 2033
- Table 88: ASEAN US Life and Non-life Insurance Industry Volume (Trillion) Forecast, by Application 2020 & 2033
- Table 89: Oceania US Life and Non-life Insurance Industry Revenue (Million) Forecast, by Application 2020 & 2033
- Table 90: Oceania US Life and Non-life Insurance Industry Volume (Trillion) Forecast, by Application 2020 & 2033
- Table 91: Rest of Asia Pacific US Life and Non-life Insurance Industry Revenue (Million) Forecast, by Application 2020 & 2033
- Table 92: Rest of Asia Pacific US Life and Non-life Insurance Industry Volume (Trillion) Forecast, by Application 2020 & 2033
Frequently Asked Questions
1. What is the projected Compound Annual Growth Rate (CAGR) of the US Life and Non-life Insurance Industry?
The projected CAGR is approximately 6.95%.
2. Which companies are prominent players in the US Life and Non-life Insurance Industry?
Key companies in the market include Massachusetts Mutual Life Insurance Company, UnitedHealth Group Incorporated, Berkshire Hathaway Inc, Cigna Corporation, Metlife Inc, Prudential Financial Inc, Aetna Inc, Centene Corporation, American International Group Inc, State Farm**List Not Exhaustive.
3. What are the main segments of the US Life and Non-life Insurance Industry?
The market segments include Insurance type, Distribution Channel.
4. Can you provide details about the market size?
The market size is estimated to be USD 2.02 Million as of 2022.
5. What are some drivers contributing to market growth?
N/A
6. What are the notable trends driving market growth?
Growing Insurtech in the United States is Driving the Market.
7. Are there any restraints impacting market growth?
N/A
8. Can you provide examples of recent developments in the market?
In 2022, With a USD100 million investment in health worker diversity, United Health Group advanced health equity and fulfilling its objectives to increase access to care, make it more affordable, and produce better health outcomes.
9. What pricing options are available for accessing the report?
Pricing options include single-user, multi-user, and enterprise licenses priced at USD 3800, USD 4500, and USD 5800 respectively.
10. Is the market size provided in terms of value or volume?
The market size is provided in terms of value, measured in Million and volume, measured in Trillion.
11. Are there any specific market keywords associated with the report?
Yes, the market keyword associated with the report is "US Life and Non-life Insurance Industry," which aids in identifying and referencing the specific market segment covered.
12. How do I determine which pricing option suits my needs best?
The pricing options vary based on user requirements and access needs. Individual users may opt for single-user licenses, while businesses requiring broader access may choose multi-user or enterprise licenses for cost-effective access to the report.
13. Are there any additional resources or data provided in the US Life and Non-life Insurance Industry report?
While the report offers comprehensive insights, it's advisable to review the specific contents or supplementary materials provided to ascertain if additional resources or data are available.
14. How can I stay updated on further developments or reports in the US Life and Non-life Insurance Industry?
To stay informed about further developments, trends, and reports in the US Life and Non-life Insurance Industry, consider subscribing to industry newsletters, following relevant companies and organizations, or regularly checking reputable industry news sources and publications.
Methodology
Step 1 - Identification of Relevant Samples Size from Population Database


Step 2 - Approaches for Defining Global Market Size (Value, Volume* & Price*)

Note*: In applicable scenarios
Step 3 - Data Sources
Primary Research
- Web Analytics
- Survey Reports
- Research Institute
- Latest Research Reports
- Opinion Leaders
Secondary Research
- Annual Reports
- White Paper
- Latest Press Release
- Industry Association
- Paid Database
- Investor Presentations

Step 4 - Data Triangulation
Involves using different sources of information in order to increase the validity of a study
These sources are likely to be stakeholders in a program - participants, other researchers, program staff, other community members, and so on.
Then we put all data in single framework & apply various statistical tools to find out the dynamic on the market.
During the analysis stage, feedback from the stakeholder groups would be compared to determine areas of agreement as well as areas of divergence