

Key Insights
The U.S. luxury market, projected at $274.8 billion in the 2025 base year, is poised for substantial expansion. This growth is attributed to an expanding affluent demographic, with millennials and Gen Z increasingly favoring luxury brands. The proliferation of e-commerce offers unparalleled access to luxury goods, accelerating market development. Key sectors such as apparel, jewelry, and watches exhibit consistent strength. The online channel is rapidly gaining momentum, surpassing traditional retail formats like single-brand and multi-brand stores, indicating a consumer preference for convenience and curated digital experiences. Nevertheless, economic volatility and potential shifts in consumer spending present ongoing challenges. Preserving brand exclusivity and combating counterfeiting remain paramount concerns for luxury brands. Increased competition from established players and new entrants further complicates market dynamics.
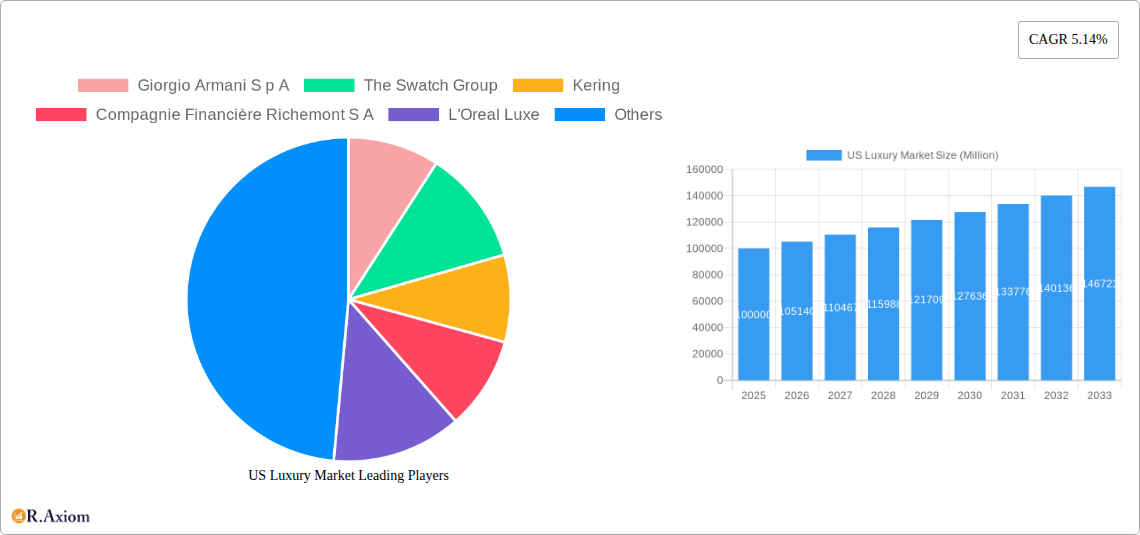
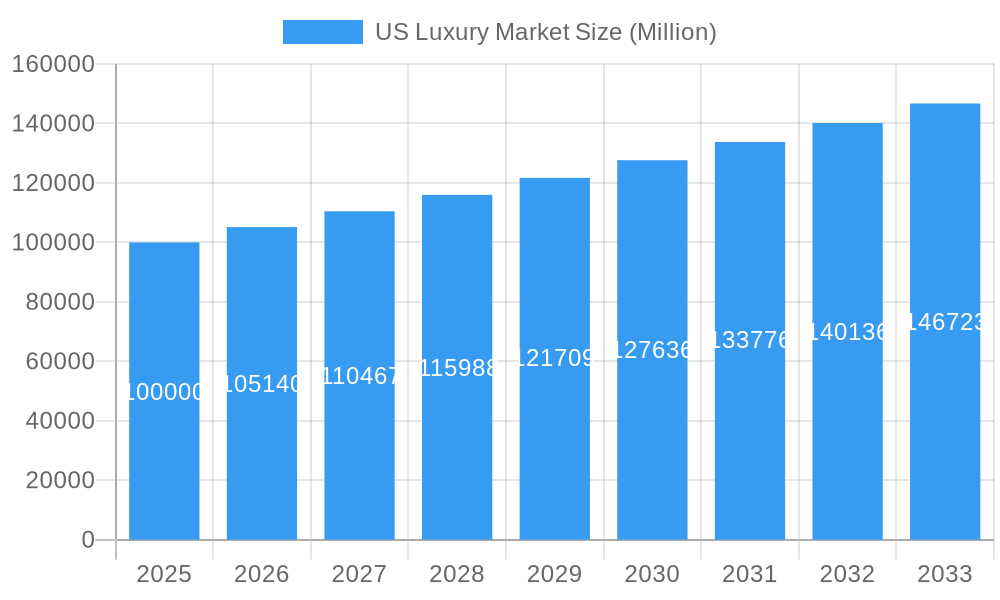
US Luxury Market Market Size (In Billion)
The forecast period (2025-2033) anticipates sustained growth at a CAGR of 5.8%. This steady expansion is primarily driven by the ongoing development of the online luxury sector and the persistent purchasing power of high-net-worth individuals. Regional disparities will likely continue, with established luxury markets in the Northeast and West Coast retaining dominance, although other regions are expected to see increased luxury market penetration. Strategic initiatives in omnichannel engagement, personalized customer journeys, and sustainable practices are vital for brands to succeed in this evolving environment. The success of individual brands will hinge on their capacity to adapt to evolving consumer demands and technological innovations.
US Luxury Market Company Market Share
US Luxury Market: A Comprehensive Report (2019-2033)
This comprehensive report provides an in-depth analysis of the US luxury market, encompassing market size, segmentation, key players, industry trends, and future growth prospects. The study period covers 2019-2033, with 2025 as the base and estimated year. The forecast period spans 2025-2033, and the historical period includes 2019-2024. This report is essential for industry stakeholders, investors, and businesses seeking to understand and navigate this dynamic market.
US Luxury Market Market Concentration & Innovation
The US luxury market exhibits high concentration, with a few dominant players commanding significant market share. LVMH Moët Hennessy Louis Vuitton, Kering, and Compagnie Financière Richemont S A consistently rank among the top players, controlling a combined xx% of the market in 2024. Market share analysis reveals a trend toward consolidation through mergers and acquisitions (M&A). The total value of M&A deals in the US luxury market reached approximately $xx Million in 2024, driven by strategic expansion and brand portfolio diversification.
- Innovation Drivers: Technological advancements in materials, manufacturing, and personalization drive innovation. Sustainable and ethical sourcing are gaining traction, influencing consumer choices and shaping product development strategies.
- Regulatory Framework: The US regulatory environment plays a crucial role, particularly concerning labeling, advertising, and intellectual property protection. Compliance necessitates careful consideration of relevant legislation.
- Product Substitutes: The luxury market faces competition from premium and high-street brands offering similar aesthetics at lower price points. This competitive pressure forces luxury brands to maintain innovation and exclusivity.
- End-User Trends: Millennial and Gen Z consumers are increasingly influential, prioritizing experiences, personalization, and brand authenticity over traditional luxury cues. Their preferences are reshaping product offerings and marketing approaches.
- M&A Activities: Strategic acquisitions continue, with larger players seeking to enhance brand portfolios and expand into new segments. Key drivers for M&A include market expansion, technological integration, and strengthening distribution channels.
US Luxury Market Industry Trends & Insights
The US luxury market demonstrates robust growth, projected to reach $xx Million by 2033, exhibiting a Compound Annual Growth Rate (CAGR) of xx% during the forecast period. Several factors contribute to this expansion:
- Rising Disposable Incomes: A growing affluent population with increasing disposable income fuels demand for luxury goods.
- Evolving Consumer Preferences: Shifting preferences toward experiences, personalization, and sustainable luxury drive innovative product development.
- Technological Disruptions: E-commerce, personalized marketing, and augmented reality (AR) experiences revolutionize the customer journey. Online luxury sales penetration is projected to reach xx% by 2033.
- Competitive Dynamics: Intense competition among established luxury houses and emerging brands creates a dynamic market landscape, demanding continuous innovation and adaptation.
- Globalization and Cross-Border Sales: Increased international tourism and cross-border e-commerce contribute significantly to the market growth.
Dominant Markets & Segments in US Luxury Market
The US luxury market is geographically diverse, with key segments exhibiting varying levels of dominance.
- By Type: Clothing and apparel maintain the largest market share, followed by bags and jewelry. Watches and footwear also represent significant market segments, with each category demonstrating unique growth trajectories.
- By Distribution Channel: Single-brand stores remain the primary distribution channel, representing xx% of total sales in 2024. However, online stores show substantial growth, driven by increased digital adoption. Multi-brand stores and other channels also play significant roles.
Key Drivers:
- Strong Economic Conditions: Favorable economic indicators, including low unemployment and rising disposable income, positively impact luxury goods consumption.
- Robust Tourism: A steady influx of international tourists boosts sales, particularly in major metropolitan areas.
- Advanced Retail Infrastructure: Well-developed retail infrastructure and logistics support efficient distribution and sales.
Detailed dominance analysis reveals the highest spending on luxury goods occurs in major metropolitan areas, driven by higher disposable incomes and a concentration of high-net-worth individuals.
US Luxury Market Product Developments
Luxury brands are actively innovating, incorporating sustainable materials, advanced technologies, and personalized customization options. Technological advancements such as AR/VR are used for immersive shopping experiences and personalized product visualization. This focus on sustainability, technological integration, and elevated customer experiences ensures market fit and maintains the competitive edge.
Report Scope & Segmentation Analysis
This report analyzes the US luxury market across various segments:
- By Type: Clothing and Apparel (xx Million), Footwear (xx Million), Bags (xx Million), Jewelry (xx Million), Watches (xx Million), Other Accessories (xx Million). Growth projections vary across segments, reflecting changing consumer preferences and market trends.
- By Distribution Channel: Single-brand Stores (xx Million), Multi-brand Stores (xx Million), Online Stores (xx Million), Other Distribution Channels (xx Million). Online channels are experiencing the fastest growth rate.
Competitive dynamics within each segment are shaped by factors such as brand positioning, product differentiation, and distribution strategies.
Key Drivers of US Luxury Market Growth
The US luxury market's growth is fueled by a confluence of factors: a rising affluent population with increasing disposable incomes; the strong US dollar; evolving consumer preferences favoring experiences and personalization; and technological advancements enabling seamless online and offline shopping experiences. Government policies supporting tourism and international trade contribute to market expansion.
Challenges in the US Luxury Market Sector
Challenges include supply chain disruptions impacting production and delivery times; increasing competition from both established and emerging brands; economic uncertainty and its impact on consumer spending; and the need to balance luxury pricing with consumer expectations. These factors necessitate agile business strategies and continuous adaptation.
Emerging Opportunities in US Luxury Market
Opportunities lie in tapping into the growing Millennial and Gen Z consumer segments; leveraging digital technologies for personalized marketing and customer engagement; incorporating sustainable practices and ethical sourcing; and expanding into new market segments, such as experiential luxury and bespoke services.
Leading Players in the US Luxury Market Market
Key Developments in US Luxury Market Industry
- May 2022: Gucci (Kering) collaborates with Adidas, launching hybrid luxury goods online and in select stores. This collaboration expanded Gucci's reach into a new demographic.
- March 2022: De Beers launches "The Alchemist of Light," a new haute couture jewelry collection, targeting high-end consumers. This showcases the ongoing innovation in the jewelry segment.
- March 2021: Swatch releases limited-edition MoMA designs, expanding brand collaborations and distribution channels. This highlights the power of strategic partnerships in boosting brand visibility.
Strategic Outlook for US Luxury Market Market
The US luxury market is poised for continued growth, driven by increasing affluence, evolving consumer preferences, and technological advancements. Strategic investments in digital infrastructure, sustainable practices, and personalized experiences will be crucial for maintaining a competitive edge. The market's evolution requires agility, innovation, and a deep understanding of the changing landscape to capture growth opportunities.
US Luxury Market Segmentation
-
1. Type
- 1.1. Clothing and Apparel
- 1.2. Footwear
- 1.3. Bags
- 1.4. Jewelry
- 1.5. Watches
- 1.6. Other Accessories
-
2. Distribution Channel
- 2.1. Single-brand Stores
- 2.2. Multi-brand Stores
- 2.3. Online Stores
- 2.4. Other Distribution Channels
US Luxury Market Segmentation By Geography
-
1. North America
- 1.1. United States
- 1.2. Canada
- 1.3. Mexico
-
2. South America
- 2.1. Brazil
- 2.2. Argentina
- 2.3. Rest of South America
-
3. Europe
- 3.1. United Kingdom
- 3.2. Germany
- 3.3. France
- 3.4. Italy
- 3.5. Spain
- 3.6. Russia
- 3.7. Benelux
- 3.8. Nordics
- 3.9. Rest of Europe
-
4. Middle East & Africa
- 4.1. Turkey
- 4.2. Israel
- 4.3. GCC
- 4.4. North Africa
- 4.5. South Africa
- 4.6. Rest of Middle East & Africa
-
5. Asia Pacific
- 5.1. China
- 5.2. India
- 5.3. Japan
- 5.4. South Korea
- 5.5. ASEAN
- 5.6. Oceania
- 5.7. Rest of Asia Pacific
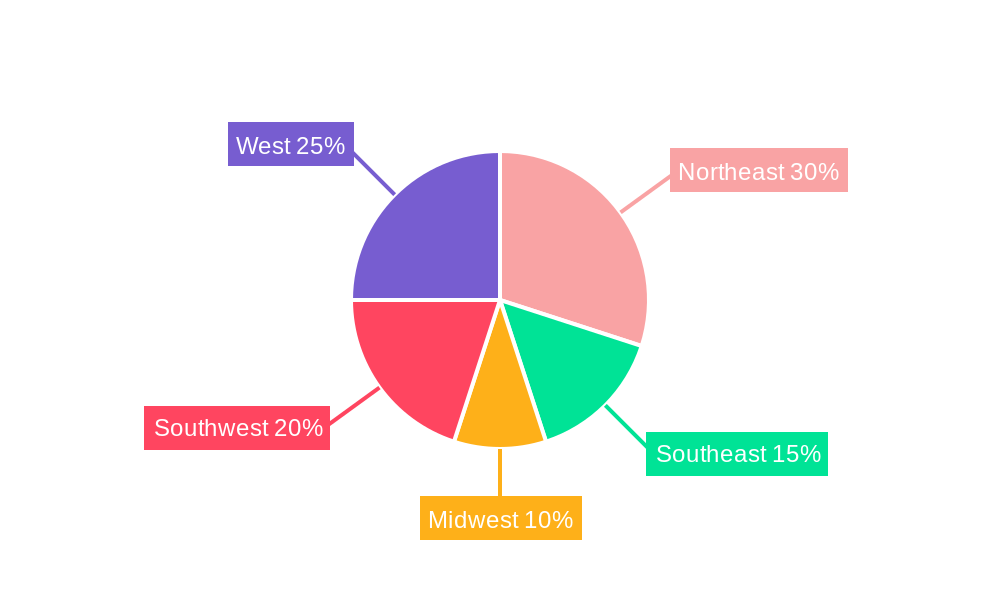
US Luxury Market Regional Market Share
Geographic Coverage of US Luxury Market
US Luxury Market REPORT HIGHLIGHTS
| Aspects | Details |
|---|---|
| Study Period | 2020-2034 |
| Base Year | 2025 |
| Estimated Year | 2026 |
| Forecast Period | 2026-2034 |
| Historical Period | 2020-2025 |
| Growth Rate | CAGR of 5.8% from 2020-2034 |
| Segmentation |
|
Table of Contents
- 1. Introduction
- 1.1. Research Scope
- 1.2. Market Segmentation
- 1.3. Research Objective
- 1.4. Definitions and Assumptions
- 2. Executive Summary
- 2.1. Market Snapshot
- 3. Market Dynamics
- 3.1. Market Drivers
- 3.2. Market Restrains
- 3.3. Market Trends
- 3.4. Market Opportunities
- 4. Market Factor Analysis
- 4.1. Porters Five Forces
- 4.1.1. Bargaining Power of Suppliers
- 4.1.2. Bargaining Power of Buyers
- 4.1.3. Threat of New Entrants
- 4.1.4. Threat of Substitutes
- 4.1.5. Competitive Rivalry
- 4.2. PESTEL analysis
- 4.3. BCG Analysis
- 4.3.1. Stars (High Growth, High Market Share)
- 4.3.2. Cash Cows (Low Growth, High Market Share)
- 4.3.3. Question Mark (High Growth, Low Market Share)
- 4.3.4. Dogs (Low Growth, Low Market Share)
- 4.4. Ansoff Matrix Analysis
- 4.5. Supply Chain Analysis
- 4.6. Regulatory Landscape
- 4.7. Current Market Potential and Opportunity Assessment (TAM–SAM–SOM Framework)
- 4.8. RAX Analyst Note
- 4.1. Porters Five Forces
- 5. Market Analysis, Insights and Forecast 2021-2033
- 5.1. Market Analysis, Insights and Forecast - by Type
- 5.1.1. Clothing and Apparel
- 5.1.2. Footwear
- 5.1.3. Bags
- 5.1.4. Jewelry
- 5.1.5. Watches
- 5.1.6. Other Accessories
- 5.2. Market Analysis, Insights and Forecast - by Distribution Channel
- 5.2.1. Single-brand Stores
- 5.2.2. Multi-brand Stores
- 5.2.3. Online Stores
- 5.2.4. Other Distribution Channels
- 5.3. Market Analysis, Insights and Forecast - by Region
- 5.3.1. North America
- 5.3.2. South America
- 5.3.3. Europe
- 5.3.4. Middle East & Africa
- 5.3.5. Asia Pacific
- 5.1. Market Analysis, Insights and Forecast - by Type
- 6. Global US Luxury Market Analysis, Insights and Forecast, 2021-2033
- 6.1. Market Analysis, Insights and Forecast - by Type
- 6.1.1. Clothing and Apparel
- 6.1.2. Footwear
- 6.1.3. Bags
- 6.1.4. Jewelry
- 6.1.5. Watches
- 6.1.6. Other Accessories
- 6.2. Market Analysis, Insights and Forecast - by Distribution Channel
- 6.2.1. Single-brand Stores
- 6.2.2. Multi-brand Stores
- 6.2.3. Online Stores
- 6.2.4. Other Distribution Channels
- 6.1. Market Analysis, Insights and Forecast - by Type
- 7. North America US Luxury Market Analysis, Insights and Forecast, 2020-2032
- 7.1. Market Analysis, Insights and Forecast - by Type
- 7.1.1. Clothing and Apparel
- 7.1.2. Footwear
- 7.1.3. Bags
- 7.1.4. Jewelry
- 7.1.5. Watches
- 7.1.6. Other Accessories
- 7.2. Market Analysis, Insights and Forecast - by Distribution Channel
- 7.2.1. Single-brand Stores
- 7.2.2. Multi-brand Stores
- 7.2.3. Online Stores
- 7.2.4. Other Distribution Channels
- 7.1. Market Analysis, Insights and Forecast - by Type
- 8. South America US Luxury Market Analysis, Insights and Forecast, 2020-2032
- 8.1. Market Analysis, Insights and Forecast - by Type
- 8.1.1. Clothing and Apparel
- 8.1.2. Footwear
- 8.1.3. Bags
- 8.1.4. Jewelry
- 8.1.5. Watches
- 8.1.6. Other Accessories
- 8.2. Market Analysis, Insights and Forecast - by Distribution Channel
- 8.2.1. Single-brand Stores
- 8.2.2. Multi-brand Stores
- 8.2.3. Online Stores
- 8.2.4. Other Distribution Channels
- 8.1. Market Analysis, Insights and Forecast - by Type
- 9. Europe US Luxury Market Analysis, Insights and Forecast, 2020-2032
- 9.1. Market Analysis, Insights and Forecast - by Type
- 9.1.1. Clothing and Apparel
- 9.1.2. Footwear
- 9.1.3. Bags
- 9.1.4. Jewelry
- 9.1.5. Watches
- 9.1.6. Other Accessories
- 9.2. Market Analysis, Insights and Forecast - by Distribution Channel
- 9.2.1. Single-brand Stores
- 9.2.2. Multi-brand Stores
- 9.2.3. Online Stores
- 9.2.4. Other Distribution Channels
- 9.1. Market Analysis, Insights and Forecast - by Type
- 10. Middle East & Africa US Luxury Market Analysis, Insights and Forecast, 2020-2032
- 10.1. Market Analysis, Insights and Forecast - by Type
- 10.1.1. Clothing and Apparel
- 10.1.2. Footwear
- 10.1.3. Bags
- 10.1.4. Jewelry
- 10.1.5. Watches
- 10.1.6. Other Accessories
- 10.2. Market Analysis, Insights and Forecast - by Distribution Channel
- 10.2.1. Single-brand Stores
- 10.2.2. Multi-brand Stores
- 10.2.3. Online Stores
- 10.2.4. Other Distribution Channels
- 10.1. Market Analysis, Insights and Forecast - by Type
- 11. Asia Pacific US Luxury Market Analysis, Insights and Forecast, 2020-2032
- 11.1. Market Analysis, Insights and Forecast - by Type
- 11.1.1. Clothing and Apparel
- 11.1.2. Footwear
- 11.1.3. Bags
- 11.1.4. Jewelry
- 11.1.5. Watches
- 11.1.6. Other Accessories
- 11.2. Market Analysis, Insights and Forecast - by Distribution Channel
- 11.2.1. Single-brand Stores
- 11.2.2. Multi-brand Stores
- 11.2.3. Online Stores
- 11.2.4. Other Distribution Channels
- 11.1. Market Analysis, Insights and Forecast - by Type
- 12. Competitive Analysis
- 12.1. Company Profiles
- 12.1.1 Giorgio Armani S p A
- 12.1.1.1. Company Overview
- 12.1.1.2. Products
- 12.1.1.3. Company Financials
- 12.1.1.4. SWOT Analysis
- 12.1.2 The Swatch Group
- 12.1.2.1. Company Overview
- 12.1.2.2. Products
- 12.1.2.3. Company Financials
- 12.1.2.4. SWOT Analysis
- 12.1.3 Kering
- 12.1.3.1. Company Overview
- 12.1.3.2. Products
- 12.1.3.3. Company Financials
- 12.1.3.4. SWOT Analysis
- 12.1.4 Compagnie Financière Richemont S A
- 12.1.4.1. Company Overview
- 12.1.4.2. Products
- 12.1.4.3. Company Financials
- 12.1.4.4. SWOT Analysis
- 12.1.5 L'Oreal Luxe
- 12.1.5.1. Company Overview
- 12.1.5.2. Products
- 12.1.5.3. Company Financials
- 12.1.5.4. SWOT Analysis
- 12.1.6 Rolex SA
- 12.1.6.1. Company Overview
- 12.1.6.2. Products
- 12.1.6.3. Company Financials
- 12.1.6.4. SWOT Analysis
- 12.1.7 PVH Corp
- 12.1.7.1. Company Overview
- 12.1.7.2. Products
- 12.1.7.3. Company Financials
- 12.1.7.4. SWOT Analysis
- 12.1.8 The Estee Lauder Companies
- 12.1.8.1. Company Overview
- 12.1.8.2. Products
- 12.1.8.3. Company Financials
- 12.1.8.4. SWOT Analysis
- 12.1.9 LVMH Moët Hennessy Louis Vuitton
- 12.1.9.1. Company Overview
- 12.1.9.2. Products
- 12.1.9.3. Company Financials
- 12.1.9.4. SWOT Analysis
- 12.1.10 Burberry*List Not Exhaustive
- 12.1.10.1. Company Overview
- 12.1.10.2. Products
- 12.1.10.3. Company Financials
- 12.1.10.4. SWOT Analysis
- 12.1.1 Giorgio Armani S p A
- 12.2. Market Entropy
- 12.2.1 Company's Key Areas Served
- 12.2.2 Recent Developments
- 12.3. Company Market Share Analysis 2025
- 12.3.1 Top 5 Companies Market Share Analysis
- 12.3.2 Top 3 Companies Market Share Analysis
- 12.4. List of Potential Customers
- 13. Research Methodology
List of Figures
- Figure 1: Global US Luxury Market Revenue Breakdown (billion, %) by Region 2025 & 2033
- Figure 2: North America US Luxury Market Revenue (billion), by Type 2025 & 2033
- Figure 3: North America US Luxury Market Revenue Share (%), by Type 2025 & 2033
- Figure 4: North America US Luxury Market Revenue (billion), by Distribution Channel 2025 & 2033
- Figure 5: North America US Luxury Market Revenue Share (%), by Distribution Channel 2025 & 2033
- Figure 6: North America US Luxury Market Revenue (billion), by Country 2025 & 2033
- Figure 7: North America US Luxury Market Revenue Share (%), by Country 2025 & 2033
- Figure 8: South America US Luxury Market Revenue (billion), by Type 2025 & 2033
- Figure 9: South America US Luxury Market Revenue Share (%), by Type 2025 & 2033
- Figure 10: South America US Luxury Market Revenue (billion), by Distribution Channel 2025 & 2033
- Figure 11: South America US Luxury Market Revenue Share (%), by Distribution Channel 2025 & 2033
- Figure 12: South America US Luxury Market Revenue (billion), by Country 2025 & 2033
- Figure 13: South America US Luxury Market Revenue Share (%), by Country 2025 & 2033
- Figure 14: Europe US Luxury Market Revenue (billion), by Type 2025 & 2033
- Figure 15: Europe US Luxury Market Revenue Share (%), by Type 2025 & 2033
- Figure 16: Europe US Luxury Market Revenue (billion), by Distribution Channel 2025 & 2033
- Figure 17: Europe US Luxury Market Revenue Share (%), by Distribution Channel 2025 & 2033
- Figure 18: Europe US Luxury Market Revenue (billion), by Country 2025 & 2033
- Figure 19: Europe US Luxury Market Revenue Share (%), by Country 2025 & 2033
- Figure 20: Middle East & Africa US Luxury Market Revenue (billion), by Type 2025 & 2033
- Figure 21: Middle East & Africa US Luxury Market Revenue Share (%), by Type 2025 & 2033
- Figure 22: Middle East & Africa US Luxury Market Revenue (billion), by Distribution Channel 2025 & 2033
- Figure 23: Middle East & Africa US Luxury Market Revenue Share (%), by Distribution Channel 2025 & 2033
- Figure 24: Middle East & Africa US Luxury Market Revenue (billion), by Country 2025 & 2033
- Figure 25: Middle East & Africa US Luxury Market Revenue Share (%), by Country 2025 & 2033
- Figure 26: Asia Pacific US Luxury Market Revenue (billion), by Type 2025 & 2033
- Figure 27: Asia Pacific US Luxury Market Revenue Share (%), by Type 2025 & 2033
- Figure 28: Asia Pacific US Luxury Market Revenue (billion), by Distribution Channel 2025 & 2033
- Figure 29: Asia Pacific US Luxury Market Revenue Share (%), by Distribution Channel 2025 & 2033
- Figure 30: Asia Pacific US Luxury Market Revenue (billion), by Country 2025 & 2033
- Figure 31: Asia Pacific US Luxury Market Revenue Share (%), by Country 2025 & 2033
List of Tables
- Table 1: Global US Luxury Market Revenue billion Forecast, by Type 2020 & 2033
- Table 2: Global US Luxury Market Revenue billion Forecast, by Distribution Channel 2020 & 2033
- Table 3: Global US Luxury Market Revenue billion Forecast, by Region 2020 & 2033
- Table 4: Global US Luxury Market Revenue billion Forecast, by Type 2020 & 2033
- Table 5: Global US Luxury Market Revenue billion Forecast, by Distribution Channel 2020 & 2033
- Table 6: Global US Luxury Market Revenue billion Forecast, by Country 2020 & 2033
- Table 7: United States US Luxury Market Revenue (billion) Forecast, by Application 2020 & 2033
- Table 8: Canada US Luxury Market Revenue (billion) Forecast, by Application 2020 & 2033
- Table 9: Mexico US Luxury Market Revenue (billion) Forecast, by Application 2020 & 2033
- Table 10: Global US Luxury Market Revenue billion Forecast, by Type 2020 & 2033
- Table 11: Global US Luxury Market Revenue billion Forecast, by Distribution Channel 2020 & 2033
- Table 12: Global US Luxury Market Revenue billion Forecast, by Country 2020 & 2033
- Table 13: Brazil US Luxury Market Revenue (billion) Forecast, by Application 2020 & 2033
- Table 14: Argentina US Luxury Market Revenue (billion) Forecast, by Application 2020 & 2033
- Table 15: Rest of South America US Luxury Market Revenue (billion) Forecast, by Application 2020 & 2033
- Table 16: Global US Luxury Market Revenue billion Forecast, by Type 2020 & 2033
- Table 17: Global US Luxury Market Revenue billion Forecast, by Distribution Channel 2020 & 2033
- Table 18: Global US Luxury Market Revenue billion Forecast, by Country 2020 & 2033
- Table 19: United Kingdom US Luxury Market Revenue (billion) Forecast, by Application 2020 & 2033
- Table 20: Germany US Luxury Market Revenue (billion) Forecast, by Application 2020 & 2033
- Table 21: France US Luxury Market Revenue (billion) Forecast, by Application 2020 & 2033
- Table 22: Italy US Luxury Market Revenue (billion) Forecast, by Application 2020 & 2033
- Table 23: Spain US Luxury Market Revenue (billion) Forecast, by Application 2020 & 2033
- Table 24: Russia US Luxury Market Revenue (billion) Forecast, by Application 2020 & 2033
- Table 25: Benelux US Luxury Market Revenue (billion) Forecast, by Application 2020 & 2033
- Table 26: Nordics US Luxury Market Revenue (billion) Forecast, by Application 2020 & 2033
- Table 27: Rest of Europe US Luxury Market Revenue (billion) Forecast, by Application 2020 & 2033
- Table 28: Global US Luxury Market Revenue billion Forecast, by Type 2020 & 2033
- Table 29: Global US Luxury Market Revenue billion Forecast, by Distribution Channel 2020 & 2033
- Table 30: Global US Luxury Market Revenue billion Forecast, by Country 2020 & 2033
- Table 31: Turkey US Luxury Market Revenue (billion) Forecast, by Application 2020 & 2033
- Table 32: Israel US Luxury Market Revenue (billion) Forecast, by Application 2020 & 2033
- Table 33: GCC US Luxury Market Revenue (billion) Forecast, by Application 2020 & 2033
- Table 34: North Africa US Luxury Market Revenue (billion) Forecast, by Application 2020 & 2033
- Table 35: South Africa US Luxury Market Revenue (billion) Forecast, by Application 2020 & 2033
- Table 36: Rest of Middle East & Africa US Luxury Market Revenue (billion) Forecast, by Application 2020 & 2033
- Table 37: Global US Luxury Market Revenue billion Forecast, by Type 2020 & 2033
- Table 38: Global US Luxury Market Revenue billion Forecast, by Distribution Channel 2020 & 2033
- Table 39: Global US Luxury Market Revenue billion Forecast, by Country 2020 & 2033
- Table 40: China US Luxury Market Revenue (billion) Forecast, by Application 2020 & 2033
- Table 41: India US Luxury Market Revenue (billion) Forecast, by Application 2020 & 2033
- Table 42: Japan US Luxury Market Revenue (billion) Forecast, by Application 2020 & 2033
- Table 43: South Korea US Luxury Market Revenue (billion) Forecast, by Application 2020 & 2033
- Table 44: ASEAN US Luxury Market Revenue (billion) Forecast, by Application 2020 & 2033
- Table 45: Oceania US Luxury Market Revenue (billion) Forecast, by Application 2020 & 2033
- Table 46: Rest of Asia Pacific US Luxury Market Revenue (billion) Forecast, by Application 2020 & 2033
Frequently Asked Questions
1. What is the projected Compound Annual Growth Rate (CAGR) of the US Luxury Market?
The projected CAGR is approximately 5.8%.
2. Which companies are prominent players in the US Luxury Market?
Key companies in the market include Giorgio Armani S p A, The Swatch Group, Kering, Compagnie Financière Richemont S A, L'Oreal Luxe, Rolex SA, PVH Corp, The Estee Lauder Companies, LVMH Moët Hennessy Louis Vuitton, Burberry*List Not Exhaustive.
3. What are the main segments of the US Luxury Market?
The market segments include Type, Distribution Channel.
4. Can you provide details about the market size?
The market size is estimated to be USD 274.8 billion as of 2022.
5. What are some drivers contributing to market growth?
Demand for Smartwatches; Popularity of Luxury Watches.
6. What are the notable trends driving market growth?
High Prevalence of Fashion-Conscious Consumers.
7. Are there any restraints impacting market growth?
Presence of Fake Brands in the Market.
8. Can you provide examples of recent developments in the market?
In May 2022, Kering group's brand Gucci collaborated with Adidas in launching their new luxury goods through an online platform along with a few selected stores. With this launch, the brands focused on launching hybrid pattern ready-to-wear clothes and accessories in the region.
9. What pricing options are available for accessing the report?
Pricing options include single-user, multi-user, and enterprise licenses priced at USD 3800, USD 4500, and USD 5800 respectively.
10. Is the market size provided in terms of value or volume?
The market size is provided in terms of value, measured in billion.
11. Are there any specific market keywords associated with the report?
Yes, the market keyword associated with the report is "US Luxury Market," which aids in identifying and referencing the specific market segment covered.
12. How do I determine which pricing option suits my needs best?
The pricing options vary based on user requirements and access needs. Individual users may opt for single-user licenses, while businesses requiring broader access may choose multi-user or enterprise licenses for cost-effective access to the report.
13. Are there any additional resources or data provided in the US Luxury Market report?
While the report offers comprehensive insights, it's advisable to review the specific contents or supplementary materials provided to ascertain if additional resources or data are available.
14. How can I stay updated on further developments or reports in the US Luxury Market?
To stay informed about further developments, trends, and reports in the US Luxury Market, consider subscribing to industry newsletters, following relevant companies and organizations, or regularly checking reputable industry news sources and publications.
Methodology
Step 1 - Identification of Relevant Samples Size from Population Database


Step 2 - Approaches for Defining Global Market Size (Value, Volume* & Price*)

Note*: In applicable scenarios
Step 3 - Data Sources
Primary Research
- Web Analytics
- Survey Reports
- Research Institute
- Latest Research Reports
- Opinion Leaders
Secondary Research
- Annual Reports
- White Paper
- Latest Press Release
- Industry Association
- Paid Database
- Investor Presentations

Step 4 - Data Triangulation
Involves using different sources of information in order to increase the validity of a study
These sources are likely to be stakeholders in a program - participants, other researchers, program staff, other community members, and so on.
Then we put all data in single framework & apply various statistical tools to find out the dynamic on the market.
During the analysis stage, feedback from the stakeholder groups would be compared to determine areas of agreement as well as areas of divergence