
Key Insights
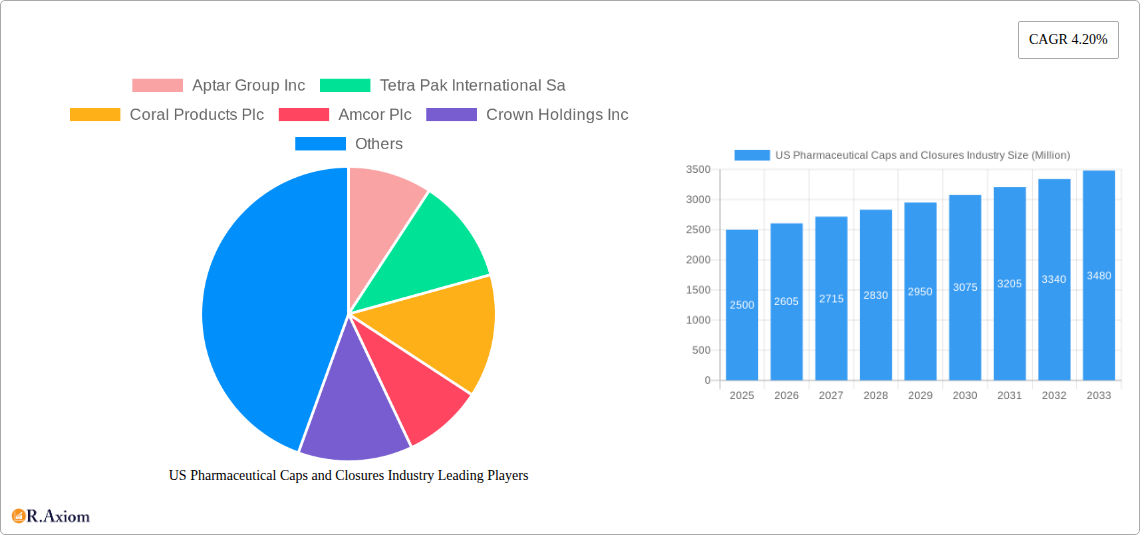
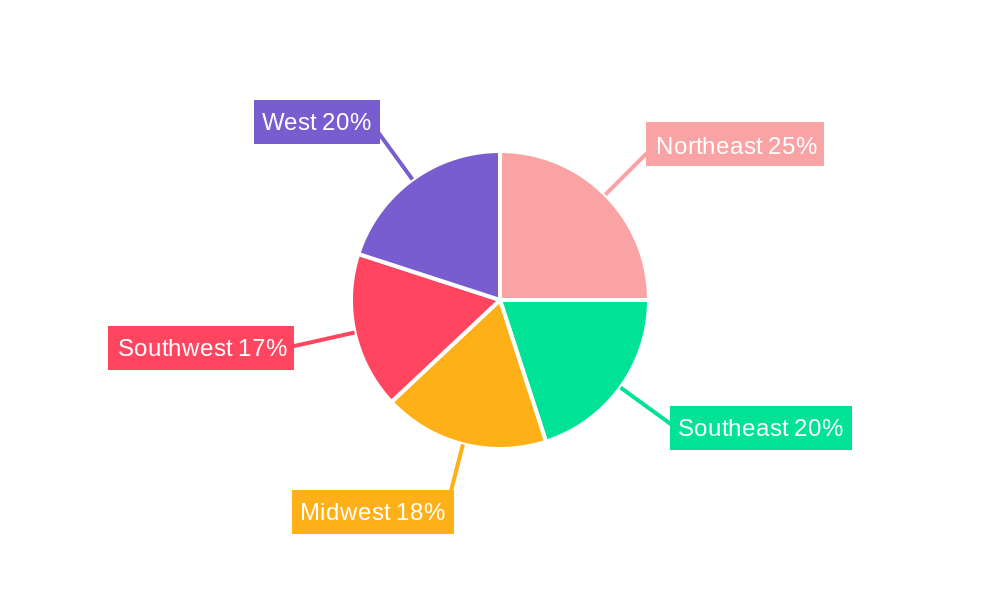
The US pharmaceutical caps and closures market, valued at approximately $2.5 billion in 2025, is projected to experience robust growth, driven by several key factors. The increasing demand for pharmaceutical products, coupled with stringent regulatory requirements emphasizing product safety and tamper-evidence, fuels the need for high-quality, reliable caps and closures. Advancements in packaging technology, such as the development of child-resistant closures and tamper-evident seals, are further contributing to market expansion. The growing prevalence of chronic diseases and the consequent rise in prescription drug consumption are significant drivers. Segmentation reveals that plastic remains the dominant material type due to its cost-effectiveness and versatility, although a gradual shift towards sustainable and eco-friendly alternatives is expected. Within end-user industries, the pharmaceutical and healthcare segment holds a substantial share, followed by the food and beverage sectors. Major players like Aptar Group, Amcor, and Berry Global are actively engaged in innovation and expansion, further shaping market dynamics. Competitive pressures are forcing continuous improvements in product design, material sourcing, and manufacturing processes. Regional variations exist, with the Northeast and West potentially experiencing higher growth rates due to concentrated pharmaceutical manufacturing and distribution hubs.
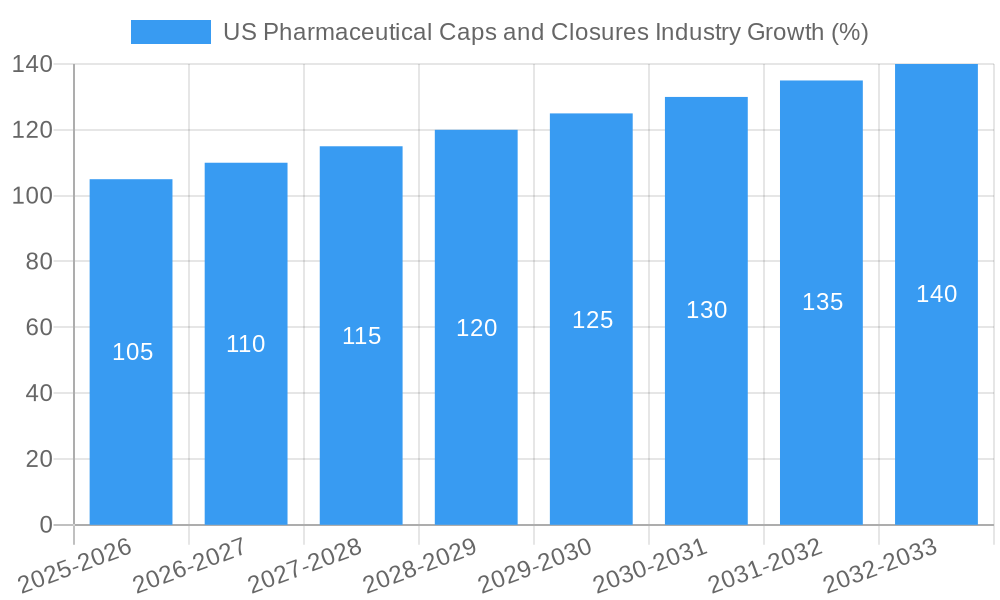
Looking ahead to 2033, the market is poised for substantial growth, projected at a Compound Annual Growth Rate (CAGR) of 4.2%. This growth trajectory will be influenced by factors including the ongoing development of new drug formulations, the increasing adoption of advanced packaging solutions designed to enhance drug stability and patient convenience, and a greater emphasis on supply chain security and traceability. However, potential restraints include fluctuations in raw material prices, economic downturns impacting healthcare spending, and increasing regulatory scrutiny, all of which could moderate growth to some extent. Continued innovation in material science, particularly the exploration of biodegradable and recyclable alternatives to conventional plastics, will be crucial for sustained market growth in the long term. The market's future hinges on successfully navigating these opportunities and challenges.
US Pharmaceutical Caps and Closures Industry Market Report: 2019-2033
This comprehensive report provides a detailed analysis of the US pharmaceutical caps and closures industry, offering actionable insights for stakeholders across the value chain. Covering the period from 2019 to 2033, with a base year of 2025, this report examines market dynamics, growth drivers, challenges, and opportunities. The study includes detailed segmentation by material type and end-user industry, offering a granular understanding of market size, growth projections, and competitive landscapes.
US Pharmaceutical Caps and Closures Industry Market Concentration & Innovation
The US pharmaceutical caps and closures market exhibits a moderately concentrated structure, with several large multinational players holding significant market share. Aptar Group Inc, Amcor Plc, Berry Global Inc, and Silgan Closures are among the leading players, collectively accounting for an estimated xx% of the market in 2025. However, the presence of numerous smaller, specialized companies contributes to competitive intensity. Market share dynamics are influenced by factors such as M&A activity, technological innovation, and regulatory compliance. Recent M&A deals in the sector have involved significant investments, with the largest transaction valued at approximately xx Million in 2024.
Innovation is a key driver, focusing on improved tamper-evidence, child-resistance, and enhanced barrier properties. Strict regulatory frameworks, including those enforced by the FDA, significantly impact product development and market entry. The industry constantly faces pressure from substitute materials and designs seeking cost efficiencies or improved functionality. End-user trends, such as increased demand for sustainable packaging solutions and personalized medicine, are shaping product development strategies.
- Key Metrics:
- Market concentration ratio (CR4): xx% (2025)
- Average M&A deal value (2020-2024): xx Million
- Number of significant M&A transactions (2020-2024): xx
US Pharmaceutical Caps and Closures Industry Industry Trends & Insights
The US pharmaceutical caps and closures market is projected to experience robust growth during the forecast period (2025-2033), driven primarily by the expansion of the pharmaceutical industry and increasing demand for drug delivery systems. The CAGR is estimated at xx% from 2025 to 2033, reflecting a market size of approximately xx Million by 2033. Technological disruptions, such as the rise of smart packaging and advanced materials, are reshaping the industry. Consumer preferences for convenience, safety, and sustainability are influencing product design and material selection. Competitive dynamics are characterized by intense rivalry among established players and emerging entrants, leading to continuous innovation and price competition. Market penetration of sustainable and tamper-evident closures is steadily increasing, reflecting a growing emphasis on product security and environmental responsibility.
Dominant Markets & Segments in US Pharmaceutical Caps and Closures Industry
The pharmaceutical and healthcare segment dominates the US caps and closures market, driven by stringent regulations and increasing demand for secure and tamper-evident packaging. Within material types, plastic remains the dominant material due to its cost-effectiveness, versatility, and ease of processing.
Dominant Segment (By End-User Industry): Pharmaceutical and Healthcare
- Key Drivers: Stringent regulatory requirements for drug safety, increasing prescription drug usage, growth of the generic drug market.
Dominant Segment (By Material Type): Plastic
- Key Drivers: Cost-effectiveness, versatility in design and functionality, ease of manufacturing and processing.
Geographic Dominance: The Northeast and West Coast regions of the US demonstrate higher market concentration owing to a dense network of pharmaceutical manufacturing facilities and robust healthcare infrastructure.
US Pharmaceutical Caps and Closures Industry Product Developments
Recent innovations focus on incorporating advanced materials with improved barrier properties to enhance drug stability and shelf life. The development of smart closures with integrated sensors for tamper detection and track-and-trace capabilities is gaining traction. Child-resistant closures that are also senior-friendly represent another significant area of focus. These developments improve product security and patient compliance. The market is also seeing increased adoption of sustainable materials, reducing environmental impact and aligning with industry sustainability goals.
Report Scope & Segmentation Analysis
This report segments the US pharmaceutical caps and closures market by material type (plastic, metal, other) and end-user industry (pharmaceutical and healthcare, food, beverage, cosmetics, and others). Each segment's growth projections, market size, and competitive landscape are analyzed in detail. For instance, the plastic segment demonstrates significant growth, driven by its versatility and cost-effectiveness. The pharmaceutical and healthcare segment shows the highest market value and growth rate due to robust regulatory requirements and increasing pharmaceutical consumption.
Key Drivers of US Pharmaceutical Caps and Closures Industry Growth
The growth of the US pharmaceutical caps and closures market is propelled by several factors. The expanding pharmaceutical industry, increasing demand for secure and tamper-evident packaging, and rising healthcare expenditure are key drivers. Technological advancements leading to innovative closure designs and materials further fuel market growth. Government regulations emphasizing patient safety also stimulate demand for advanced closure solutions.
Challenges in the US Pharmaceutical Caps and Closures Industry Sector
The industry faces challenges including stringent regulatory compliance requirements, increasing raw material costs, and intense competition. Supply chain disruptions and fluctuations in the prices of raw materials, like polymers and metals, pose significant challenges. Maintaining sustainable practices and reducing the environmental impact of packaging is another key industry challenge.
Emerging Opportunities in US Pharmaceutical Caps and Closures Industry
Emerging opportunities include the growing demand for sustainable and eco-friendly packaging solutions, increasing adoption of smart closures with integrated sensors, and the expansion of the personalized medicine market. The development of closures for novel drug delivery systems, such as inhalers and injectables, also presents significant growth potential.
Leading Players in the US Pharmaceutical Caps and Closures Industry Market
- Aptar Group Inc
- Tetra Pak International SA
- Coral Products Plc
- Amcor Plc
- Crown Holdings Inc
- O Berk Company Llc
- Bericap Holdings
- Silgan Closures
- MJS Packaging
- Albéa S.A
- Berry Global Inc
- Closure Systems International
Key Developments in US Pharmaceutical Caps and Closures Industry Industry
- 2023 Q3: Berry Global Inc. launched a new line of sustainable closures made from recycled materials.
- 2022 Q4: Amcor Plc acquired a smaller competitor, expanding its market share.
- 2021 Q2: New FDA regulations regarding child-resistant closures came into effect.
Strategic Outlook for US Pharmaceutical Caps and Closures Industry Market
The future of the US pharmaceutical caps and closures market looks promising, driven by continuous innovation, increasing demand for advanced packaging solutions, and the growth of the pharmaceutical industry. Opportunities lie in developing sustainable, smart, and secure closures that meet evolving regulatory requirements and consumer preferences. Companies focusing on innovation, sustainability, and strategic partnerships are expected to thrive in this dynamic market.
US Pharmaceutical Caps and Closures Industry Segmentation
-
1. Material Type
-
1.1. Plastic
- 1.1.1. PET
- 1.1.2. PP
- 1.1.3. HDPE and LDPE
- 1.1.4. Other Plastics
- 1.2. Metal
- 1.3. Other Material Types
-
1.1. Plastic
-
2. End-User Industry
- 2.1. Beverage
- 2.2. Food
- 2.3. Pharmaceutical and Healthcare
- 2.4. Cosmetics and Toiletries
- 2.5. Other En
US Pharmaceutical Caps and Closures Industry Segmentation By Geography
-
1. North America
- 1.1. United States
- 1.2. Canada
- 1.3. Mexico
-
2. South America
- 2.1. Brazil
- 2.2. Argentina
- 2.3. Rest of South America
-
3. Europe
- 3.1. United Kingdom
- 3.2. Germany
- 3.3. France
- 3.4. Italy
- 3.5. Spain
- 3.6. Russia
- 3.7. Benelux
- 3.8. Nordics
- 3.9. Rest of Europe
-
4. Middle East & Africa
- 4.1. Turkey
- 4.2. Israel
- 4.3. GCC
- 4.4. North Africa
- 4.5. South Africa
- 4.6. Rest of Middle East & Africa
-
5. Asia Pacific
- 5.1. China
- 5.2. India
- 5.3. Japan
- 5.4. South Korea
- 5.5. ASEAN
- 5.6. Oceania
- 5.7. Rest of Asia Pacific
US Pharmaceutical Caps and Closures Industry REPORT HIGHLIGHTS
| Aspects | Details |
|---|---|
| Study Period | 2019-2033 |
| Base Year | 2024 |
| Estimated Year | 2025 |
| Forecast Period | 2025-2033 |
| Historical Period | 2019-2024 |
| Growth Rate | CAGR of 4.20% from 2019-2033 |
| Segmentation |
|
Table of Contents
- 1. Introduction
- 1.1. Research Scope
- 1.2. Market Segmentation
- 1.3. Research Methodology
- 1.4. Definitions and Assumptions
- 2. Executive Summary
- 2.1. Introduction
- 3. Market Dynamics
- 3.1. Introduction
- 3.2. Market Drivers
- 3.2.1. ; The Increased Demand for Innovative Solutions from Different End Users.
- 3.3. Market Restrains
- 3.3.1. ; Stringent Regulation on Manufacturers Pertaining to Environmental Degradation
- 3.4. Market Trends
- 3.4.1. Plastic to Witness a Highest Growth
- 4. Market Factor Analysis
- 4.1. Porters Five Forces
- 4.2. Supply/Value Chain
- 4.3. PESTEL analysis
- 4.4. Market Entropy
- 4.5. Patent/Trademark Analysis
- 5. Global US Pharmaceutical Caps and Closures Industry Analysis, Insights and Forecast, 2019-2031
- 5.1. Market Analysis, Insights and Forecast - by Material Type
- 5.1.1. Plastic
- 5.1.1.1. PET
- 5.1.1.2. PP
- 5.1.1.3. HDPE and LDPE
- 5.1.1.4. Other Plastics
- 5.1.2. Metal
- 5.1.3. Other Material Types
- 5.1.1. Plastic
- 5.2. Market Analysis, Insights and Forecast - by End-User Industry
- 5.2.1. Beverage
- 5.2.2. Food
- 5.2.3. Pharmaceutical and Healthcare
- 5.2.4. Cosmetics and Toiletries
- 5.2.5. Other En
- 5.3. Market Analysis, Insights and Forecast - by Region
- 5.3.1. North America
- 5.3.2. South America
- 5.3.3. Europe
- 5.3.4. Middle East & Africa
- 5.3.5. Asia Pacific
- 5.1. Market Analysis, Insights and Forecast - by Material Type
- 6. North America US Pharmaceutical Caps and Closures Industry Analysis, Insights and Forecast, 2019-2031
- 6.1. Market Analysis, Insights and Forecast - by Material Type
- 6.1.1. Plastic
- 6.1.1.1. PET
- 6.1.1.2. PP
- 6.1.1.3. HDPE and LDPE
- 6.1.1.4. Other Plastics
- 6.1.2. Metal
- 6.1.3. Other Material Types
- 6.1.1. Plastic
- 6.2. Market Analysis, Insights and Forecast - by End-User Industry
- 6.2.1. Beverage
- 6.2.2. Food
- 6.2.3. Pharmaceutical and Healthcare
- 6.2.4. Cosmetics and Toiletries
- 6.2.5. Other En
- 6.1. Market Analysis, Insights and Forecast - by Material Type
- 7. South America US Pharmaceutical Caps and Closures Industry Analysis, Insights and Forecast, 2019-2031
- 7.1. Market Analysis, Insights and Forecast - by Material Type
- 7.1.1. Plastic
- 7.1.1.1. PET
- 7.1.1.2. PP
- 7.1.1.3. HDPE and LDPE
- 7.1.1.4. Other Plastics
- 7.1.2. Metal
- 7.1.3. Other Material Types
- 7.1.1. Plastic
- 7.2. Market Analysis, Insights and Forecast - by End-User Industry
- 7.2.1. Beverage
- 7.2.2. Food
- 7.2.3. Pharmaceutical and Healthcare
- 7.2.4. Cosmetics and Toiletries
- 7.2.5. Other En
- 7.1. Market Analysis, Insights and Forecast - by Material Type
- 8. Europe US Pharmaceutical Caps and Closures Industry Analysis, Insights and Forecast, 2019-2031
- 8.1. Market Analysis, Insights and Forecast - by Material Type
- 8.1.1. Plastic
- 8.1.1.1. PET
- 8.1.1.2. PP
- 8.1.1.3. HDPE and LDPE
- 8.1.1.4. Other Plastics
- 8.1.2. Metal
- 8.1.3. Other Material Types
- 8.1.1. Plastic
- 8.2. Market Analysis, Insights and Forecast - by End-User Industry
- 8.2.1. Beverage
- 8.2.2. Food
- 8.2.3. Pharmaceutical and Healthcare
- 8.2.4. Cosmetics and Toiletries
- 8.2.5. Other En
- 8.1. Market Analysis, Insights and Forecast - by Material Type
- 9. Middle East & Africa US Pharmaceutical Caps and Closures Industry Analysis, Insights and Forecast, 2019-2031
- 9.1. Market Analysis, Insights and Forecast - by Material Type
- 9.1.1. Plastic
- 9.1.1.1. PET
- 9.1.1.2. PP
- 9.1.1.3. HDPE and LDPE
- 9.1.1.4. Other Plastics
- 9.1.2. Metal
- 9.1.3. Other Material Types
- 9.1.1. Plastic
- 9.2. Market Analysis, Insights and Forecast - by End-User Industry
- 9.2.1. Beverage
- 9.2.2. Food
- 9.2.3. Pharmaceutical and Healthcare
- 9.2.4. Cosmetics and Toiletries
- 9.2.5. Other En
- 9.1. Market Analysis, Insights and Forecast - by Material Type
- 10. Asia Pacific US Pharmaceutical Caps and Closures Industry Analysis, Insights and Forecast, 2019-2031
- 10.1. Market Analysis, Insights and Forecast - by Material Type
- 10.1.1. Plastic
- 10.1.1.1. PET
- 10.1.1.2. PP
- 10.1.1.3. HDPE and LDPE
- 10.1.1.4. Other Plastics
- 10.1.2. Metal
- 10.1.3. Other Material Types
- 10.1.1. Plastic
- 10.2. Market Analysis, Insights and Forecast - by End-User Industry
- 10.2.1. Beverage
- 10.2.2. Food
- 10.2.3. Pharmaceutical and Healthcare
- 10.2.4. Cosmetics and Toiletries
- 10.2.5. Other En
- 10.1. Market Analysis, Insights and Forecast - by Material Type
- 11. Northeast US Pharmaceutical Caps and Closures Industry Analysis, Insights and Forecast, 2019-2031
- 12. Southeast US Pharmaceutical Caps and Closures Industry Analysis, Insights and Forecast, 2019-2031
- 13. Midwest US Pharmaceutical Caps and Closures Industry Analysis, Insights and Forecast, 2019-2031
- 14. Southwest US Pharmaceutical Caps and Closures Industry Analysis, Insights and Forecast, 2019-2031
- 15. West US Pharmaceutical Caps and Closures Industry Analysis, Insights and Forecast, 2019-2031
- 16. Competitive Analysis
- 16.1. Global Market Share Analysis 2024
- 16.2. Company Profiles
- 16.2.1 Aptar Group Inc
- 16.2.1.1. Overview
- 16.2.1.2. Products
- 16.2.1.3. SWOT Analysis
- 16.2.1.4. Recent Developments
- 16.2.1.5. Financials (Based on Availability)
- 16.2.2 Tetra Pak International Sa
- 16.2.2.1. Overview
- 16.2.2.2. Products
- 16.2.2.3. SWOT Analysis
- 16.2.2.4. Recent Developments
- 16.2.2.5. Financials (Based on Availability)
- 16.2.3 Coral Products Plc
- 16.2.3.1. Overview
- 16.2.3.2. Products
- 16.2.3.3. SWOT Analysis
- 16.2.3.4. Recent Developments
- 16.2.3.5. Financials (Based on Availability)
- 16.2.4 Amcor Plc
- 16.2.4.1. Overview
- 16.2.4.2. Products
- 16.2.4.3. SWOT Analysis
- 16.2.4.4. Recent Developments
- 16.2.4.5. Financials (Based on Availability)
- 16.2.5 Crown Holdings Inc
- 16.2.5.1. Overview
- 16.2.5.2. Products
- 16.2.5.3. SWOT Analysis
- 16.2.5.4. Recent Developments
- 16.2.5.5. Financials (Based on Availability)
- 16.2.6 O Berk Company Llc*List Not Exhaustive
- 16.2.6.1. Overview
- 16.2.6.2. Products
- 16.2.6.3. SWOT Analysis
- 16.2.6.4. Recent Developments
- 16.2.6.5. Financials (Based on Availability)
- 16.2.7 Bericap Holdings
- 16.2.7.1. Overview
- 16.2.7.2. Products
- 16.2.7.3. SWOT Analysis
- 16.2.7.4. Recent Developments
- 16.2.7.5. Financials (Based on Availability)
- 16.2.8 Silgan Closures
- 16.2.8.1. Overview
- 16.2.8.2. Products
- 16.2.8.3. SWOT Analysis
- 16.2.8.4. Recent Developments
- 16.2.8.5. Financials (Based on Availability)
- 16.2.9 Mjs Packaging
- 16.2.9.1. Overview
- 16.2.9.2. Products
- 16.2.9.3. SWOT Analysis
- 16.2.9.4. Recent Developments
- 16.2.9.5. Financials (Based on Availability)
- 16.2.10 Albéa S A
- 16.2.10.1. Overview
- 16.2.10.2. Products
- 16.2.10.3. SWOT Analysis
- 16.2.10.4. Recent Developments
- 16.2.10.5. Financials (Based on Availability)
- 16.2.11 Berry Global Inc
- 16.2.11.1. Overview
- 16.2.11.2. Products
- 16.2.11.3. SWOT Analysis
- 16.2.11.4. Recent Developments
- 16.2.11.5. Financials (Based on Availability)
- 16.2.12 Closure Systems International
- 16.2.12.1. Overview
- 16.2.12.2. Products
- 16.2.12.3. SWOT Analysis
- 16.2.12.4. Recent Developments
- 16.2.12.5. Financials (Based on Availability)
- 16.2.1 Aptar Group Inc
List of Figures
- Figure 1: Global US Pharmaceutical Caps and Closures Industry Revenue Breakdown (Million, %) by Region 2024 & 2032
- Figure 2: United states US Pharmaceutical Caps and Closures Industry Revenue (Million), by Country 2024 & 2032
- Figure 3: United states US Pharmaceutical Caps and Closures Industry Revenue Share (%), by Country 2024 & 2032
- Figure 4: North America US Pharmaceutical Caps and Closures Industry Revenue (Million), by Material Type 2024 & 2032
- Figure 5: North America US Pharmaceutical Caps and Closures Industry Revenue Share (%), by Material Type 2024 & 2032
- Figure 6: North America US Pharmaceutical Caps and Closures Industry Revenue (Million), by End-User Industry 2024 & 2032
- Figure 7: North America US Pharmaceutical Caps and Closures Industry Revenue Share (%), by End-User Industry 2024 & 2032
- Figure 8: North America US Pharmaceutical Caps and Closures Industry Revenue (Million), by Country 2024 & 2032
- Figure 9: North America US Pharmaceutical Caps and Closures Industry Revenue Share (%), by Country 2024 & 2032
- Figure 10: South America US Pharmaceutical Caps and Closures Industry Revenue (Million), by Material Type 2024 & 2032
- Figure 11: South America US Pharmaceutical Caps and Closures Industry Revenue Share (%), by Material Type 2024 & 2032
- Figure 12: South America US Pharmaceutical Caps and Closures Industry Revenue (Million), by End-User Industry 2024 & 2032
- Figure 13: South America US Pharmaceutical Caps and Closures Industry Revenue Share (%), by End-User Industry 2024 & 2032
- Figure 14: South America US Pharmaceutical Caps and Closures Industry Revenue (Million), by Country 2024 & 2032
- Figure 15: South America US Pharmaceutical Caps and Closures Industry Revenue Share (%), by Country 2024 & 2032
- Figure 16: Europe US Pharmaceutical Caps and Closures Industry Revenue (Million), by Material Type 2024 & 2032
- Figure 17: Europe US Pharmaceutical Caps and Closures Industry Revenue Share (%), by Material Type 2024 & 2032
- Figure 18: Europe US Pharmaceutical Caps and Closures Industry Revenue (Million), by End-User Industry 2024 & 2032
- Figure 19: Europe US Pharmaceutical Caps and Closures Industry Revenue Share (%), by End-User Industry 2024 & 2032
- Figure 20: Europe US Pharmaceutical Caps and Closures Industry Revenue (Million), by Country 2024 & 2032
- Figure 21: Europe US Pharmaceutical Caps and Closures Industry Revenue Share (%), by Country 2024 & 2032
- Figure 22: Middle East & Africa US Pharmaceutical Caps and Closures Industry Revenue (Million), by Material Type 2024 & 2032
- Figure 23: Middle East & Africa US Pharmaceutical Caps and Closures Industry Revenue Share (%), by Material Type 2024 & 2032
- Figure 24: Middle East & Africa US Pharmaceutical Caps and Closures Industry Revenue (Million), by End-User Industry 2024 & 2032
- Figure 25: Middle East & Africa US Pharmaceutical Caps and Closures Industry Revenue Share (%), by End-User Industry 2024 & 2032
- Figure 26: Middle East & Africa US Pharmaceutical Caps and Closures Industry Revenue (Million), by Country 2024 & 2032
- Figure 27: Middle East & Africa US Pharmaceutical Caps and Closures Industry Revenue Share (%), by Country 2024 & 2032
- Figure 28: Asia Pacific US Pharmaceutical Caps and Closures Industry Revenue (Million), by Material Type 2024 & 2032
- Figure 29: Asia Pacific US Pharmaceutical Caps and Closures Industry Revenue Share (%), by Material Type 2024 & 2032
- Figure 30: Asia Pacific US Pharmaceutical Caps and Closures Industry Revenue (Million), by End-User Industry 2024 & 2032
- Figure 31: Asia Pacific US Pharmaceutical Caps and Closures Industry Revenue Share (%), by End-User Industry 2024 & 2032
- Figure 32: Asia Pacific US Pharmaceutical Caps and Closures Industry Revenue (Million), by Country 2024 & 2032
- Figure 33: Asia Pacific US Pharmaceutical Caps and Closures Industry Revenue Share (%), by Country 2024 & 2032
List of Tables
- Table 1: Global US Pharmaceutical Caps and Closures Industry Revenue Million Forecast, by Region 2019 & 2032
- Table 2: Global US Pharmaceutical Caps and Closures Industry Revenue Million Forecast, by Material Type 2019 & 2032
- Table 3: Global US Pharmaceutical Caps and Closures Industry Revenue Million Forecast, by End-User Industry 2019 & 2032
- Table 4: Global US Pharmaceutical Caps and Closures Industry Revenue Million Forecast, by Region 2019 & 2032
- Table 5: Global US Pharmaceutical Caps and Closures Industry Revenue Million Forecast, by Country 2019 & 2032
- Table 6: Northeast US Pharmaceutical Caps and Closures Industry Revenue (Million) Forecast, by Application 2019 & 2032
- Table 7: Southeast US Pharmaceutical Caps and Closures Industry Revenue (Million) Forecast, by Application 2019 & 2032
- Table 8: Midwest US Pharmaceutical Caps and Closures Industry Revenue (Million) Forecast, by Application 2019 & 2032
- Table 9: Southwest US Pharmaceutical Caps and Closures Industry Revenue (Million) Forecast, by Application 2019 & 2032
- Table 10: West US Pharmaceutical Caps and Closures Industry Revenue (Million) Forecast, by Application 2019 & 2032
- Table 11: Global US Pharmaceutical Caps and Closures Industry Revenue Million Forecast, by Material Type 2019 & 2032
- Table 12: Global US Pharmaceutical Caps and Closures Industry Revenue Million Forecast, by End-User Industry 2019 & 2032
- Table 13: Global US Pharmaceutical Caps and Closures Industry Revenue Million Forecast, by Country 2019 & 2032
- Table 14: United States US Pharmaceutical Caps and Closures Industry Revenue (Million) Forecast, by Application 2019 & 2032
- Table 15: Canada US Pharmaceutical Caps and Closures Industry Revenue (Million) Forecast, by Application 2019 & 2032
- Table 16: Mexico US Pharmaceutical Caps and Closures Industry Revenue (Million) Forecast, by Application 2019 & 2032
- Table 17: Global US Pharmaceutical Caps and Closures Industry Revenue Million Forecast, by Material Type 2019 & 2032
- Table 18: Global US Pharmaceutical Caps and Closures Industry Revenue Million Forecast, by End-User Industry 2019 & 2032
- Table 19: Global US Pharmaceutical Caps and Closures Industry Revenue Million Forecast, by Country 2019 & 2032
- Table 20: Brazil US Pharmaceutical Caps and Closures Industry Revenue (Million) Forecast, by Application 2019 & 2032
- Table 21: Argentina US Pharmaceutical Caps and Closures Industry Revenue (Million) Forecast, by Application 2019 & 2032
- Table 22: Rest of South America US Pharmaceutical Caps and Closures Industry Revenue (Million) Forecast, by Application 2019 & 2032
- Table 23: Global US Pharmaceutical Caps and Closures Industry Revenue Million Forecast, by Material Type 2019 & 2032
- Table 24: Global US Pharmaceutical Caps and Closures Industry Revenue Million Forecast, by End-User Industry 2019 & 2032
- Table 25: Global US Pharmaceutical Caps and Closures Industry Revenue Million Forecast, by Country 2019 & 2032
- Table 26: United Kingdom US Pharmaceutical Caps and Closures Industry Revenue (Million) Forecast, by Application 2019 & 2032
- Table 27: Germany US Pharmaceutical Caps and Closures Industry Revenue (Million) Forecast, by Application 2019 & 2032
- Table 28: France US Pharmaceutical Caps and Closures Industry Revenue (Million) Forecast, by Application 2019 & 2032
- Table 29: Italy US Pharmaceutical Caps and Closures Industry Revenue (Million) Forecast, by Application 2019 & 2032
- Table 30: Spain US Pharmaceutical Caps and Closures Industry Revenue (Million) Forecast, by Application 2019 & 2032
- Table 31: Russia US Pharmaceutical Caps and Closures Industry Revenue (Million) Forecast, by Application 2019 & 2032
- Table 32: Benelux US Pharmaceutical Caps and Closures Industry Revenue (Million) Forecast, by Application 2019 & 2032
- Table 33: Nordics US Pharmaceutical Caps and Closures Industry Revenue (Million) Forecast, by Application 2019 & 2032
- Table 34: Rest of Europe US Pharmaceutical Caps and Closures Industry Revenue (Million) Forecast, by Application 2019 & 2032
- Table 35: Global US Pharmaceutical Caps and Closures Industry Revenue Million Forecast, by Material Type 2019 & 2032
- Table 36: Global US Pharmaceutical Caps and Closures Industry Revenue Million Forecast, by End-User Industry 2019 & 2032
- Table 37: Global US Pharmaceutical Caps and Closures Industry Revenue Million Forecast, by Country 2019 & 2032
- Table 38: Turkey US Pharmaceutical Caps and Closures Industry Revenue (Million) Forecast, by Application 2019 & 2032
- Table 39: Israel US Pharmaceutical Caps and Closures Industry Revenue (Million) Forecast, by Application 2019 & 2032
- Table 40: GCC US Pharmaceutical Caps and Closures Industry Revenue (Million) Forecast, by Application 2019 & 2032
- Table 41: North Africa US Pharmaceutical Caps and Closures Industry Revenue (Million) Forecast, by Application 2019 & 2032
- Table 42: South Africa US Pharmaceutical Caps and Closures Industry Revenue (Million) Forecast, by Application 2019 & 2032
- Table 43: Rest of Middle East & Africa US Pharmaceutical Caps and Closures Industry Revenue (Million) Forecast, by Application 2019 & 2032
- Table 44: Global US Pharmaceutical Caps and Closures Industry Revenue Million Forecast, by Material Type 2019 & 2032
- Table 45: Global US Pharmaceutical Caps and Closures Industry Revenue Million Forecast, by End-User Industry 2019 & 2032
- Table 46: Global US Pharmaceutical Caps and Closures Industry Revenue Million Forecast, by Country 2019 & 2032
- Table 47: China US Pharmaceutical Caps and Closures Industry Revenue (Million) Forecast, by Application 2019 & 2032
- Table 48: India US Pharmaceutical Caps and Closures Industry Revenue (Million) Forecast, by Application 2019 & 2032
- Table 49: Japan US Pharmaceutical Caps and Closures Industry Revenue (Million) Forecast, by Application 2019 & 2032
- Table 50: South Korea US Pharmaceutical Caps and Closures Industry Revenue (Million) Forecast, by Application 2019 & 2032
- Table 51: ASEAN US Pharmaceutical Caps and Closures Industry Revenue (Million) Forecast, by Application 2019 & 2032
- Table 52: Oceania US Pharmaceutical Caps and Closures Industry Revenue (Million) Forecast, by Application 2019 & 2032
- Table 53: Rest of Asia Pacific US Pharmaceutical Caps and Closures Industry Revenue (Million) Forecast, by Application 2019 & 2032
Frequently Asked Questions
1. What is the projected Compound Annual Growth Rate (CAGR) of the US Pharmaceutical Caps and Closures Industry?
The projected CAGR is approximately 4.20%.
2. Which companies are prominent players in the US Pharmaceutical Caps and Closures Industry?
Key companies in the market include Aptar Group Inc, Tetra Pak International Sa, Coral Products Plc, Amcor Plc, Crown Holdings Inc, O Berk Company Llc*List Not Exhaustive, Bericap Holdings, Silgan Closures, Mjs Packaging, Albéa S A, Berry Global Inc, Closure Systems International.
3. What are the main segments of the US Pharmaceutical Caps and Closures Industry?
The market segments include Material Type, End-User Industry.
4. Can you provide details about the market size?
The market size is estimated to be USD XX Million as of 2022.
5. What are some drivers contributing to market growth?
; The Increased Demand for Innovative Solutions from Different End Users..
6. What are the notable trends driving market growth?
Plastic to Witness a Highest Growth.
7. Are there any restraints impacting market growth?
; Stringent Regulation on Manufacturers Pertaining to Environmental Degradation.
8. Can you provide examples of recent developments in the market?
N/A
9. What pricing options are available for accessing the report?
Pricing options include single-user, multi-user, and enterprise licenses priced at USD 3800, USD 4500, and USD 5800 respectively.
10. Is the market size provided in terms of value or volume?
The market size is provided in terms of value, measured in Million.
11. Are there any specific market keywords associated with the report?
Yes, the market keyword associated with the report is "US Pharmaceutical Caps and Closures Industry," which aids in identifying and referencing the specific market segment covered.
12. How do I determine which pricing option suits my needs best?
The pricing options vary based on user requirements and access needs. Individual users may opt for single-user licenses, while businesses requiring broader access may choose multi-user or enterprise licenses for cost-effective access to the report.
13. Are there any additional resources or data provided in the US Pharmaceutical Caps and Closures Industry report?
While the report offers comprehensive insights, it's advisable to review the specific contents or supplementary materials provided to ascertain if additional resources or data are available.
14. How can I stay updated on further developments or reports in the US Pharmaceutical Caps and Closures Industry?
To stay informed about further developments, trends, and reports in the US Pharmaceutical Caps and Closures Industry, consider subscribing to industry newsletters, following relevant companies and organizations, or regularly checking reputable industry news sources and publications.
Methodology
Step 1 - Identification of Relevant Samples Size from Population Database


Step 2 - Approaches for Defining Global Market Size (Value, Volume* & Price*)

Note*: In applicable scenarios
Step 3 - Data Sources
Primary Research
- Web Analytics
- Survey Reports
- Research Institute
- Latest Research Reports
- Opinion Leaders
Secondary Research
- Annual Reports
- White Paper
- Latest Press Release
- Industry Association
- Paid Database
- Investor Presentations

Step 4 - Data Triangulation
Involves using different sources of information in order to increase the validity of a study
These sources are likely to be stakeholders in a program - participants, other researchers, program staff, other community members, and so on.
Then we put all data in single framework & apply various statistical tools to find out the dynamic on the market.
During the analysis stage, feedback from the stakeholder groups would be compared to determine areas of agreement as well as areas of divergence


