
Key Insights
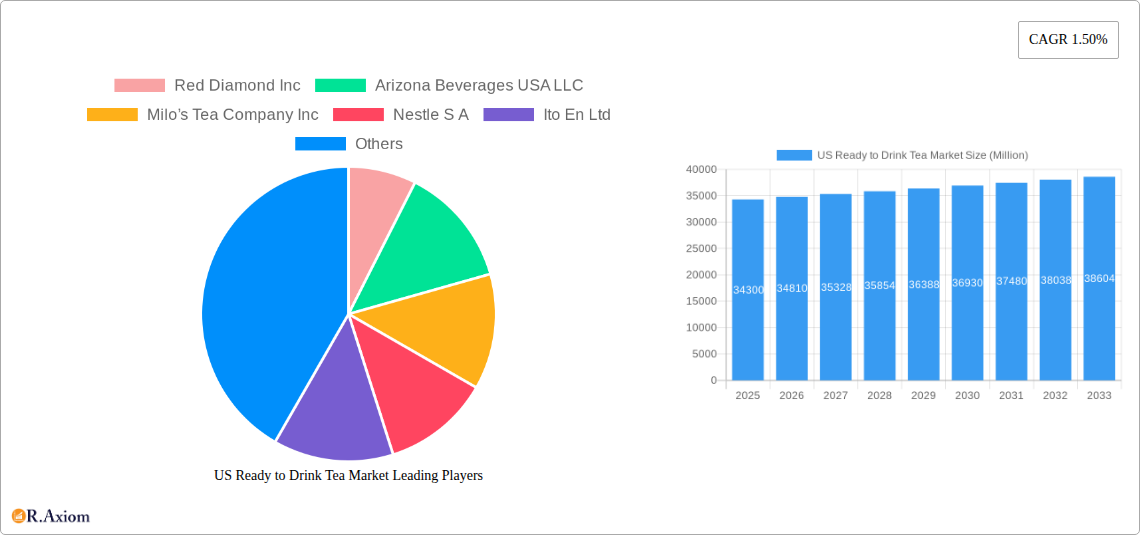
The US Ready-to-Drink (RTD) tea market, valued at $34.3 billion in 2025, exhibits a steady growth trajectory with a Compound Annual Growth Rate (CAGR) of 1.50% projected from 2025 to 2033. This growth is fueled by several key drivers. The increasing consumer preference for healthier beverage options, particularly those with perceived functional benefits like antioxidants and natural ingredients, is a significant factor. Growing awareness of the health benefits associated with tea consumption, including improved hydration and potential immune system support, further contributes to market expansion. Convenience is another crucial driver; RTD tea offers a quick and easy alternative to brewing tea at home, appealing to busy consumers. Furthermore, the diversification of RTD tea offerings, encompassing a wide range of flavors (green tea, herbal tea, iced tea, etc.), packaging options (aseptic packages, glass bottles, cans, PET bottles), and distribution channels (off-trade retailers and on-trade establishments), caters to diverse consumer preferences and expands market reach. While specific restraints are not detailed, potential challenges could include fluctuations in raw material prices, intense competition within the beverage industry, and evolving consumer tastes.
Market segmentation reveals significant opportunities. The "Other RTD Tea" segment, potentially encompassing innovative flavor combinations and functional beverages, could experience above-average growth. Similarly, PET bottles, due to their cost-effectiveness and recyclability, likely hold a larger market share in packaging. Regional variations exist, with areas like the Northeast and West Coast potentially exhibiting higher per capita consumption due to demographics and lifestyle factors. Major players, including Red Diamond, Arizona Beverages, Nestle, PepsiCo, and Coca-Cola, are actively shaping the market through product innovation, brand building, and strategic distribution partnerships. The forecast period (2025-2033) suggests continued, albeit moderate, expansion, driven by sustained consumer demand for convenient and healthy beverage options.
US Ready to Drink Tea Market: A Comprehensive Report (2019-2033)
This in-depth report provides a comprehensive analysis of the US Ready to Drink (RTD) Tea market, covering the period from 2019 to 2033. It delves into market dynamics, competitive landscapes, and future growth prospects, offering actionable insights for industry stakeholders. The report leverages robust data analysis and market intelligence to provide a clear picture of this dynamic sector. With a focus on key segments, leading players, and emerging trends, this report is an essential resource for businesses seeking to navigate and capitalize on the opportunities within the US RTD tea market. The base year for this report is 2025, with estimations for 2025 and a forecast period spanning 2025-2033.
US Ready to Drink Tea Market Market Concentration & Innovation
The US RTD tea market exhibits a moderately concentrated structure, with key players holding significant market share. The top five companies—PepsiCo Inc, The Coca-Cola Company, Nestle S A, Keurig Dr Pepper Inc, and Arizona Beverages USA LLC—account for approximately xx% of the total market share in 2025. However, smaller players and regional brands continue to carve out niches, driven by innovation and targeted marketing strategies.
Innovation in the RTD tea market is primarily focused on product diversification, functional beverages (e.g., enhanced with vitamins or antioxidants), and sustainable packaging. The regulatory framework surrounding food and beverage products influences ingredient choices and labeling, impacting both innovation and market competition. Consumer trends, including increasing health consciousness and demand for natural and organic options, are major drivers of innovation. Mergers and acquisitions (M&A) activity has been relatively moderate in recent years, with deal values averaging xx Million USD per transaction, primarily focused on expanding product portfolios and market reach.
- Market Concentration: Top 5 players hold xx% market share (2025).
- Innovation Drivers: Health consciousness, sustainability, functional beverages.
- Regulatory Framework: Influences ingredient choices and labeling.
- M&A Activity: Average deal value: xx Million USD (Historical Period).
US Ready to Drink Tea Market Industry Trends & Insights
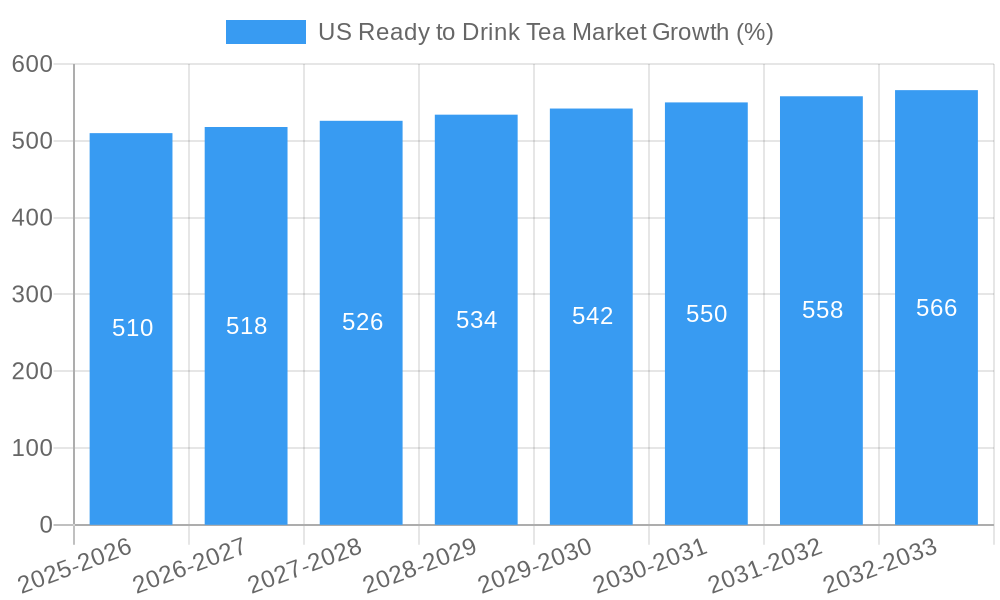
The US RTD tea market is projected to experience a CAGR of xx% during the forecast period (2025-2033). Several factors contribute to this growth, including rising consumer preference for convenient and refreshing beverages, increased disposable incomes, and the growing popularity of tea as a healthy alternative to sugary drinks. Technological advancements in packaging and production processes enhance efficiency and shelf life, further driving market expansion.
Consumer preferences are shifting toward healthier options, fueling demand for organic, low-sugar, and functional teas. Competitive dynamics are intense, with major players engaging in aggressive marketing campaigns, product diversification, and strategic partnerships to maintain and expand their market share. Market penetration of RTD tea is high in urban areas but shows significant growth potential in rural and suburban regions.
Dominant Markets & Segments in US Ready to Drink Tea Market
The iced tea segment dominates the US RTD tea market, accounting for approximately xx% of the total market value in 2025. This segment's dominance stems from its widespread appeal, diverse flavor profiles, and affordability.
- Leading Segment: Iced Tea (xx% market share, 2025).
- Key Drivers: Widespread consumer appeal, affordability, diverse flavor profiles.
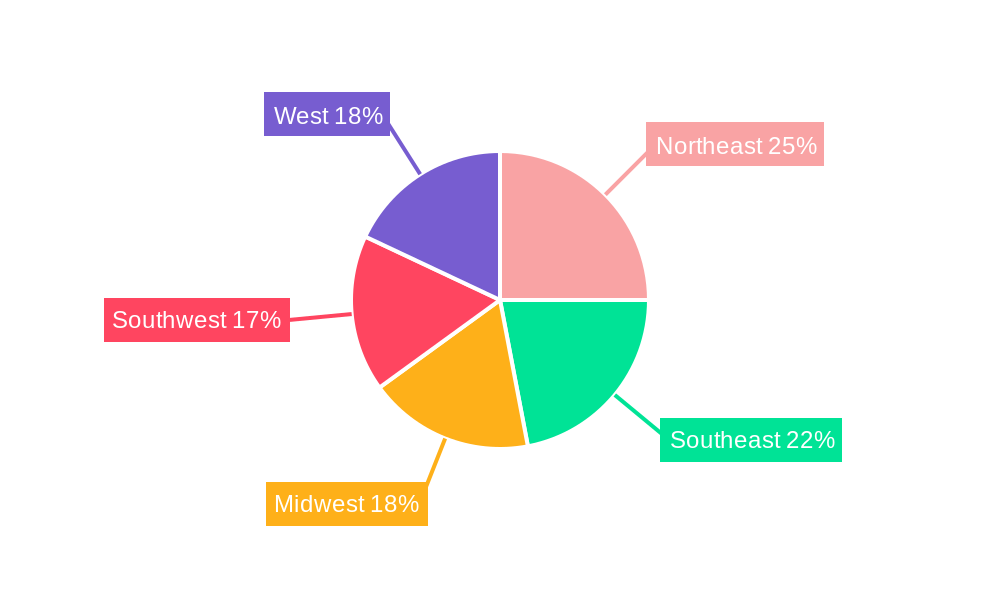
- Regional Dominance: The South and West regions exhibit higher per capita consumption than other regions.
- Distribution Channel: Off-trade channels (grocery stores, supermarkets) dominate, while the on-trade segment (restaurants, cafes) shows steady growth.
- Packaging: PET bottles hold the largest market share due to their cost-effectiveness and ease of use.
US Ready to Drink Tea Market Product Developments
Recent product innovations focus on enhanced flavors, functional ingredients (e.g., probiotics, antioxidants), and sustainable packaging options. Companies are leveraging technological advancements to develop unique tea blends, incorporating innovative brewing techniques, and offering convenient packaging formats like single-serve cans and pouches. These developments cater to evolving consumer preferences and enhance the competitive advantages of individual brands.
Report Scope & Segmentation Analysis
This report segments the US RTD tea market based on soft drink type (Green Tea, Herbal Tea, Iced Tea, Other RTD Tea), packaging type (Aseptic packages, Glass Bottles, Metal Can, PET Bottles), and distribution channel (Off-trade, On-trade). Each segment's growth projections, market size, and competitive dynamics are analyzed in detail, providing a granular understanding of the market structure. The report also includes an analysis of the "Others" segment, which captures niche variations within the market. Detailed growth projections for each segment from 2025-2033 are provided in the full report.
Key Drivers of US Ready to Drink Tea Market Growth
The US RTD tea market's growth is fueled by several key factors. The rising popularity of healthy and convenient beverages, increasing disposable incomes, and the growing awareness of tea's health benefits are driving significant market expansion. Technological advancements in packaging and production processes contribute to efficiency and shelf life improvements. Favorable government regulations support industry growth and consumer confidence.
Challenges in the US Ready to Drink Tea Market Sector
The US RTD tea market faces challenges such as intense competition from other beverage categories, fluctuations in raw material prices, and stringent regulatory requirements related to food safety and labeling. Supply chain disruptions can also impact production and distribution, leading to price increases and decreased availability.
Emerging Opportunities in US Ready to Drink Tea Market
Emerging opportunities include expanding into niche segments like organic and functional teas, exploring innovative packaging solutions, and tapping into new distribution channels like online retailers and subscription services. There's also potential for growth in regional markets and underserved demographics.
Leading Players in the US Ready to Drink Tea Market Market
- Red Diamond Inc
- Arizona Beverages USA LLC
- Milo’s Tea Company Inc
- Nestle S A
- Ito En Ltd
- PepsiCo Inc
- Hawaiian Sun Products Inc
- Keurig Dr Pepper Inc
- The Coca-Cola Company
- Del Monte Foods Inc
- Reily Foods Company
- Walmart Inc
Key Developments in US Ready to Drink Tea Market Industry
- January 2023: Milo's Tea Company announced a USD 130 Million investment in a new plant and distribution center, reflecting brand growth.
- January 2023: Lipton Tea partnered with Full Cart to enhance access to nutritious food options.
- December 2022: Pure Leaf launched a limited-edition Merry Mint Iced Tea, leveraging a movie tie-in and social media campaign.
Strategic Outlook for US Ready to Drink Tea Market Market
The US RTD tea market holds significant future potential, driven by consistent consumer demand for healthy and convenient beverages. Strategic partnerships, product diversification, and targeted marketing campaigns will be key for companies seeking to capitalize on this growth. Innovation in flavor profiles, functional ingredients, and sustainable packaging will remain critical to securing market share and catering to evolving consumer preferences.
US Ready to Drink Tea Market Segmentation
-
1. Soft Drink Type
- 1.1. Green Tea
- 1.2. Herbal Tea
- 1.3. Iced Tea
- 1.4. Other RTD Tea
-
2. Packaging Type
- 2.1. Aseptic packages
- 2.2. Glass Bottles
- 2.3. Metal Can
- 2.4. PET Bottles
-
3. Distribution Channel
-
3.1. Off-trade
- 3.1.1. Convenience Stores
- 3.1.2. Online Retail
- 3.1.3. Supermarket/Hypermarket
- 3.1.4. Others
- 3.2. On-trade
-
3.1. Off-trade
US Ready to Drink Tea Market Segmentation By Geography
-
1. North America
- 1.1. United States
- 1.2. Canada
- 1.3. Mexico
-
2. South America
- 2.1. Brazil
- 2.2. Argentina
- 2.3. Rest of South America
-
3. Europe
- 3.1. United Kingdom
- 3.2. Germany
- 3.3. France
- 3.4. Italy
- 3.5. Spain
- 3.6. Russia
- 3.7. Benelux
- 3.8. Nordics
- 3.9. Rest of Europe
-
4. Middle East & Africa
- 4.1. Turkey
- 4.2. Israel
- 4.3. GCC
- 4.4. North Africa
- 4.5. South Africa
- 4.6. Rest of Middle East & Africa
-
5. Asia Pacific
- 5.1. China
- 5.2. India
- 5.3. Japan
- 5.4. South Korea
- 5.5. ASEAN
- 5.6. Oceania
- 5.7. Rest of Asia Pacific
US Ready to Drink Tea Market REPORT HIGHLIGHTS
| Aspects | Details |
|---|---|
| Study Period | 2019-2033 |
| Base Year | 2024 |
| Estimated Year | 2025 |
| Forecast Period | 2025-2033 |
| Historical Period | 2019-2024 |
| Growth Rate | CAGR of 1.50% from 2019-2033 |
| Segmentation |
|
Table of Contents
- 1. Introduction
- 1.1. Research Scope
- 1.2. Market Segmentation
- 1.3. Research Methodology
- 1.4. Definitions and Assumptions
- 2. Executive Summary
- 2.1. Introduction
- 3. Market Dynamics
- 3.1. Introduction
- 3.2. Market Drivers
- 3.2.1. Increasing demand for meat alternatives
- 3.3. Market Restrains
- 3.3.1. Presence of numerous alternatives in the plant proteins
- 3.4. Market Trends
- 3.4.1. OTHER KEY INDUSTRY TRENDS COVERED IN THE REPORT
- 4. Market Factor Analysis
- 4.1. Porters Five Forces
- 4.2. Supply/Value Chain
- 4.3. PESTEL analysis
- 4.4. Market Entropy
- 4.5. Patent/Trademark Analysis
- 5. Global US Ready to Drink Tea Market Analysis, Insights and Forecast, 2019-2031
- 5.1. Market Analysis, Insights and Forecast - by Soft Drink Type
- 5.1.1. Green Tea
- 5.1.2. Herbal Tea
- 5.1.3. Iced Tea
- 5.1.4. Other RTD Tea
- 5.2. Market Analysis, Insights and Forecast - by Packaging Type
- 5.2.1. Aseptic packages
- 5.2.2. Glass Bottles
- 5.2.3. Metal Can
- 5.2.4. PET Bottles
- 5.3. Market Analysis, Insights and Forecast - by Distribution Channel
- 5.3.1. Off-trade
- 5.3.1.1. Convenience Stores
- 5.3.1.2. Online Retail
- 5.3.1.3. Supermarket/Hypermarket
- 5.3.1.4. Others
- 5.3.2. On-trade
- 5.3.1. Off-trade
- 5.4. Market Analysis, Insights and Forecast - by Region
- 5.4.1. North America
- 5.4.2. South America
- 5.4.3. Europe
- 5.4.4. Middle East & Africa
- 5.4.5. Asia Pacific
- 5.1. Market Analysis, Insights and Forecast - by Soft Drink Type
- 6. North America US Ready to Drink Tea Market Analysis, Insights and Forecast, 2019-2031
- 6.1. Market Analysis, Insights and Forecast - by Soft Drink Type
- 6.1.1. Green Tea
- 6.1.2. Herbal Tea
- 6.1.3. Iced Tea
- 6.1.4. Other RTD Tea
- 6.2. Market Analysis, Insights and Forecast - by Packaging Type
- 6.2.1. Aseptic packages
- 6.2.2. Glass Bottles
- 6.2.3. Metal Can
- 6.2.4. PET Bottles
- 6.3. Market Analysis, Insights and Forecast - by Distribution Channel
- 6.3.1. Off-trade
- 6.3.1.1. Convenience Stores
- 6.3.1.2. Online Retail
- 6.3.1.3. Supermarket/Hypermarket
- 6.3.1.4. Others
- 6.3.2. On-trade
- 6.3.1. Off-trade
- 6.1. Market Analysis, Insights and Forecast - by Soft Drink Type
- 7. South America US Ready to Drink Tea Market Analysis, Insights and Forecast, 2019-2031
- 7.1. Market Analysis, Insights and Forecast - by Soft Drink Type
- 7.1.1. Green Tea
- 7.1.2. Herbal Tea
- 7.1.3. Iced Tea
- 7.1.4. Other RTD Tea
- 7.2. Market Analysis, Insights and Forecast - by Packaging Type
- 7.2.1. Aseptic packages
- 7.2.2. Glass Bottles
- 7.2.3. Metal Can
- 7.2.4. PET Bottles
- 7.3. Market Analysis, Insights and Forecast - by Distribution Channel
- 7.3.1. Off-trade
- 7.3.1.1. Convenience Stores
- 7.3.1.2. Online Retail
- 7.3.1.3. Supermarket/Hypermarket
- 7.3.1.4. Others
- 7.3.2. On-trade
- 7.3.1. Off-trade
- 7.1. Market Analysis, Insights and Forecast - by Soft Drink Type
- 8. Europe US Ready to Drink Tea Market Analysis, Insights and Forecast, 2019-2031
- 8.1. Market Analysis, Insights and Forecast - by Soft Drink Type
- 8.1.1. Green Tea
- 8.1.2. Herbal Tea
- 8.1.3. Iced Tea
- 8.1.4. Other RTD Tea
- 8.2. Market Analysis, Insights and Forecast - by Packaging Type
- 8.2.1. Aseptic packages
- 8.2.2. Glass Bottles
- 8.2.3. Metal Can
- 8.2.4. PET Bottles
- 8.3. Market Analysis, Insights and Forecast - by Distribution Channel
- 8.3.1. Off-trade
- 8.3.1.1. Convenience Stores
- 8.3.1.2. Online Retail
- 8.3.1.3. Supermarket/Hypermarket
- 8.3.1.4. Others
- 8.3.2. On-trade
- 8.3.1. Off-trade
- 8.1. Market Analysis, Insights and Forecast - by Soft Drink Type
- 9. Middle East & Africa US Ready to Drink Tea Market Analysis, Insights and Forecast, 2019-2031
- 9.1. Market Analysis, Insights and Forecast - by Soft Drink Type
- 9.1.1. Green Tea
- 9.1.2. Herbal Tea
- 9.1.3. Iced Tea
- 9.1.4. Other RTD Tea
- 9.2. Market Analysis, Insights and Forecast - by Packaging Type
- 9.2.1. Aseptic packages
- 9.2.2. Glass Bottles
- 9.2.3. Metal Can
- 9.2.4. PET Bottles
- 9.3. Market Analysis, Insights and Forecast - by Distribution Channel
- 9.3.1. Off-trade
- 9.3.1.1. Convenience Stores
- 9.3.1.2. Online Retail
- 9.3.1.3. Supermarket/Hypermarket
- 9.3.1.4. Others
- 9.3.2. On-trade
- 9.3.1. Off-trade
- 9.1. Market Analysis, Insights and Forecast - by Soft Drink Type
- 10. Asia Pacific US Ready to Drink Tea Market Analysis, Insights and Forecast, 2019-2031
- 10.1. Market Analysis, Insights and Forecast - by Soft Drink Type
- 10.1.1. Green Tea
- 10.1.2. Herbal Tea
- 10.1.3. Iced Tea
- 10.1.4. Other RTD Tea
- 10.2. Market Analysis, Insights and Forecast - by Packaging Type
- 10.2.1. Aseptic packages
- 10.2.2. Glass Bottles
- 10.2.3. Metal Can
- 10.2.4. PET Bottles
- 10.3. Market Analysis, Insights and Forecast - by Distribution Channel
- 10.3.1. Off-trade
- 10.3.1.1. Convenience Stores
- 10.3.1.2. Online Retail
- 10.3.1.3. Supermarket/Hypermarket
- 10.3.1.4. Others
- 10.3.2. On-trade
- 10.3.1. Off-trade
- 10.1. Market Analysis, Insights and Forecast - by Soft Drink Type
- 11. Northeast US Ready to Drink Tea Market Analysis, Insights and Forecast, 2019-2031
- 12. Southeast US Ready to Drink Tea Market Analysis, Insights and Forecast, 2019-2031
- 13. Midwest US Ready to Drink Tea Market Analysis, Insights and Forecast, 2019-2031
- 14. Southwest US Ready to Drink Tea Market Analysis, Insights and Forecast, 2019-2031
- 15. West US Ready to Drink Tea Market Analysis, Insights and Forecast, 2019-2031
- 16. Competitive Analysis
- 16.1. Global Market Share Analysis 2024
- 16.2. Company Profiles
- 16.2.1 Red Diamond Inc
- 16.2.1.1. Overview
- 16.2.1.2. Products
- 16.2.1.3. SWOT Analysis
- 16.2.1.4. Recent Developments
- 16.2.1.5. Financials (Based on Availability)
- 16.2.2 Arizona Beverages USA LLC
- 16.2.2.1. Overview
- 16.2.2.2. Products
- 16.2.2.3. SWOT Analysis
- 16.2.2.4. Recent Developments
- 16.2.2.5. Financials (Based on Availability)
- 16.2.3 Milo’s Tea Company Inc
- 16.2.3.1. Overview
- 16.2.3.2. Products
- 16.2.3.3. SWOT Analysis
- 16.2.3.4. Recent Developments
- 16.2.3.5. Financials (Based on Availability)
- 16.2.4 Nestle S A
- 16.2.4.1. Overview
- 16.2.4.2. Products
- 16.2.4.3. SWOT Analysis
- 16.2.4.4. Recent Developments
- 16.2.4.5. Financials (Based on Availability)
- 16.2.5 Ito En Ltd
- 16.2.5.1. Overview
- 16.2.5.2. Products
- 16.2.5.3. SWOT Analysis
- 16.2.5.4. Recent Developments
- 16.2.5.5. Financials (Based on Availability)
- 16.2.6 PepsiCo Inc
- 16.2.6.1. Overview
- 16.2.6.2. Products
- 16.2.6.3. SWOT Analysis
- 16.2.6.4. Recent Developments
- 16.2.6.5. Financials (Based on Availability)
- 16.2.7 Hawaiian Sun Products Inc
- 16.2.7.1. Overview
- 16.2.7.2. Products
- 16.2.7.3. SWOT Analysis
- 16.2.7.4. Recent Developments
- 16.2.7.5. Financials (Based on Availability)
- 16.2.8 Keurig Dr Pepper Inc
- 16.2.8.1. Overview
- 16.2.8.2. Products
- 16.2.8.3. SWOT Analysis
- 16.2.8.4. Recent Developments
- 16.2.8.5. Financials (Based on Availability)
- 16.2.9 The Coca-Cola Company
- 16.2.9.1. Overview
- 16.2.9.2. Products
- 16.2.9.3. SWOT Analysis
- 16.2.9.4. Recent Developments
- 16.2.9.5. Financials (Based on Availability)
- 16.2.10 Del Monte Foods Inc
- 16.2.10.1. Overview
- 16.2.10.2. Products
- 16.2.10.3. SWOT Analysis
- 16.2.10.4. Recent Developments
- 16.2.10.5. Financials (Based on Availability)
- 16.2.11 Reily Foods Company
- 16.2.11.1. Overview
- 16.2.11.2. Products
- 16.2.11.3. SWOT Analysis
- 16.2.11.4. Recent Developments
- 16.2.11.5. Financials (Based on Availability)
- 16.2.12 Walmart Inc
- 16.2.12.1. Overview
- 16.2.12.2. Products
- 16.2.12.3. SWOT Analysis
- 16.2.12.4. Recent Developments
- 16.2.12.5. Financials (Based on Availability)
- 16.2.1 Red Diamond Inc
List of Figures
- Figure 1: Global US Ready to Drink Tea Market Revenue Breakdown (Million, %) by Region 2024 & 2032
- Figure 2: Global US Ready to Drink Tea Market Volume Breakdown (K Tons, %) by Region 2024 & 2032
- Figure 3: United states US Ready to Drink Tea Market Revenue (Million), by Country 2024 & 2032
- Figure 4: United states US Ready to Drink Tea Market Volume (K Tons), by Country 2024 & 2032
- Figure 5: United states US Ready to Drink Tea Market Revenue Share (%), by Country 2024 & 2032
- Figure 6: United states US Ready to Drink Tea Market Volume Share (%), by Country 2024 & 2032
- Figure 7: North America US Ready to Drink Tea Market Revenue (Million), by Soft Drink Type 2024 & 2032
- Figure 8: North America US Ready to Drink Tea Market Volume (K Tons), by Soft Drink Type 2024 & 2032
- Figure 9: North America US Ready to Drink Tea Market Revenue Share (%), by Soft Drink Type 2024 & 2032
- Figure 10: North America US Ready to Drink Tea Market Volume Share (%), by Soft Drink Type 2024 & 2032
- Figure 11: North America US Ready to Drink Tea Market Revenue (Million), by Packaging Type 2024 & 2032
- Figure 12: North America US Ready to Drink Tea Market Volume (K Tons), by Packaging Type 2024 & 2032
- Figure 13: North America US Ready to Drink Tea Market Revenue Share (%), by Packaging Type 2024 & 2032
- Figure 14: North America US Ready to Drink Tea Market Volume Share (%), by Packaging Type 2024 & 2032
- Figure 15: North America US Ready to Drink Tea Market Revenue (Million), by Distribution Channel 2024 & 2032
- Figure 16: North America US Ready to Drink Tea Market Volume (K Tons), by Distribution Channel 2024 & 2032
- Figure 17: North America US Ready to Drink Tea Market Revenue Share (%), by Distribution Channel 2024 & 2032
- Figure 18: North America US Ready to Drink Tea Market Volume Share (%), by Distribution Channel 2024 & 2032
- Figure 19: North America US Ready to Drink Tea Market Revenue (Million), by Country 2024 & 2032
- Figure 20: North America US Ready to Drink Tea Market Volume (K Tons), by Country 2024 & 2032
- Figure 21: North America US Ready to Drink Tea Market Revenue Share (%), by Country 2024 & 2032
- Figure 22: North America US Ready to Drink Tea Market Volume Share (%), by Country 2024 & 2032
- Figure 23: South America US Ready to Drink Tea Market Revenue (Million), by Soft Drink Type 2024 & 2032
- Figure 24: South America US Ready to Drink Tea Market Volume (K Tons), by Soft Drink Type 2024 & 2032
- Figure 25: South America US Ready to Drink Tea Market Revenue Share (%), by Soft Drink Type 2024 & 2032
- Figure 26: South America US Ready to Drink Tea Market Volume Share (%), by Soft Drink Type 2024 & 2032
- Figure 27: South America US Ready to Drink Tea Market Revenue (Million), by Packaging Type 2024 & 2032
- Figure 28: South America US Ready to Drink Tea Market Volume (K Tons), by Packaging Type 2024 & 2032
- Figure 29: South America US Ready to Drink Tea Market Revenue Share (%), by Packaging Type 2024 & 2032
- Figure 30: South America US Ready to Drink Tea Market Volume Share (%), by Packaging Type 2024 & 2032
- Figure 31: South America US Ready to Drink Tea Market Revenue (Million), by Distribution Channel 2024 & 2032
- Figure 32: South America US Ready to Drink Tea Market Volume (K Tons), by Distribution Channel 2024 & 2032
- Figure 33: South America US Ready to Drink Tea Market Revenue Share (%), by Distribution Channel 2024 & 2032
- Figure 34: South America US Ready to Drink Tea Market Volume Share (%), by Distribution Channel 2024 & 2032
- Figure 35: South America US Ready to Drink Tea Market Revenue (Million), by Country 2024 & 2032
- Figure 36: South America US Ready to Drink Tea Market Volume (K Tons), by Country 2024 & 2032
- Figure 37: South America US Ready to Drink Tea Market Revenue Share (%), by Country 2024 & 2032
- Figure 38: South America US Ready to Drink Tea Market Volume Share (%), by Country 2024 & 2032
- Figure 39: Europe US Ready to Drink Tea Market Revenue (Million), by Soft Drink Type 2024 & 2032
- Figure 40: Europe US Ready to Drink Tea Market Volume (K Tons), by Soft Drink Type 2024 & 2032
- Figure 41: Europe US Ready to Drink Tea Market Revenue Share (%), by Soft Drink Type 2024 & 2032
- Figure 42: Europe US Ready to Drink Tea Market Volume Share (%), by Soft Drink Type 2024 & 2032
- Figure 43: Europe US Ready to Drink Tea Market Revenue (Million), by Packaging Type 2024 & 2032
- Figure 44: Europe US Ready to Drink Tea Market Volume (K Tons), by Packaging Type 2024 & 2032
- Figure 45: Europe US Ready to Drink Tea Market Revenue Share (%), by Packaging Type 2024 & 2032
- Figure 46: Europe US Ready to Drink Tea Market Volume Share (%), by Packaging Type 2024 & 2032
- Figure 47: Europe US Ready to Drink Tea Market Revenue (Million), by Distribution Channel 2024 & 2032
- Figure 48: Europe US Ready to Drink Tea Market Volume (K Tons), by Distribution Channel 2024 & 2032
- Figure 49: Europe US Ready to Drink Tea Market Revenue Share (%), by Distribution Channel 2024 & 2032
- Figure 50: Europe US Ready to Drink Tea Market Volume Share (%), by Distribution Channel 2024 & 2032
- Figure 51: Europe US Ready to Drink Tea Market Revenue (Million), by Country 2024 & 2032
- Figure 52: Europe US Ready to Drink Tea Market Volume (K Tons), by Country 2024 & 2032
- Figure 53: Europe US Ready to Drink Tea Market Revenue Share (%), by Country 2024 & 2032
- Figure 54: Europe US Ready to Drink Tea Market Volume Share (%), by Country 2024 & 2032
- Figure 55: Middle East & Africa US Ready to Drink Tea Market Revenue (Million), by Soft Drink Type 2024 & 2032
- Figure 56: Middle East & Africa US Ready to Drink Tea Market Volume (K Tons), by Soft Drink Type 2024 & 2032
- Figure 57: Middle East & Africa US Ready to Drink Tea Market Revenue Share (%), by Soft Drink Type 2024 & 2032
- Figure 58: Middle East & Africa US Ready to Drink Tea Market Volume Share (%), by Soft Drink Type 2024 & 2032
- Figure 59: Middle East & Africa US Ready to Drink Tea Market Revenue (Million), by Packaging Type 2024 & 2032
- Figure 60: Middle East & Africa US Ready to Drink Tea Market Volume (K Tons), by Packaging Type 2024 & 2032
- Figure 61: Middle East & Africa US Ready to Drink Tea Market Revenue Share (%), by Packaging Type 2024 & 2032
- Figure 62: Middle East & Africa US Ready to Drink Tea Market Volume Share (%), by Packaging Type 2024 & 2032
- Figure 63: Middle East & Africa US Ready to Drink Tea Market Revenue (Million), by Distribution Channel 2024 & 2032
- Figure 64: Middle East & Africa US Ready to Drink Tea Market Volume (K Tons), by Distribution Channel 2024 & 2032
- Figure 65: Middle East & Africa US Ready to Drink Tea Market Revenue Share (%), by Distribution Channel 2024 & 2032
- Figure 66: Middle East & Africa US Ready to Drink Tea Market Volume Share (%), by Distribution Channel 2024 & 2032
- Figure 67: Middle East & Africa US Ready to Drink Tea Market Revenue (Million), by Country 2024 & 2032
- Figure 68: Middle East & Africa US Ready to Drink Tea Market Volume (K Tons), by Country 2024 & 2032
- Figure 69: Middle East & Africa US Ready to Drink Tea Market Revenue Share (%), by Country 2024 & 2032
- Figure 70: Middle East & Africa US Ready to Drink Tea Market Volume Share (%), by Country 2024 & 2032
- Figure 71: Asia Pacific US Ready to Drink Tea Market Revenue (Million), by Soft Drink Type 2024 & 2032
- Figure 72: Asia Pacific US Ready to Drink Tea Market Volume (K Tons), by Soft Drink Type 2024 & 2032
- Figure 73: Asia Pacific US Ready to Drink Tea Market Revenue Share (%), by Soft Drink Type 2024 & 2032
- Figure 74: Asia Pacific US Ready to Drink Tea Market Volume Share (%), by Soft Drink Type 2024 & 2032
- Figure 75: Asia Pacific US Ready to Drink Tea Market Revenue (Million), by Packaging Type 2024 & 2032
- Figure 76: Asia Pacific US Ready to Drink Tea Market Volume (K Tons), by Packaging Type 2024 & 2032
- Figure 77: Asia Pacific US Ready to Drink Tea Market Revenue Share (%), by Packaging Type 2024 & 2032
- Figure 78: Asia Pacific US Ready to Drink Tea Market Volume Share (%), by Packaging Type 2024 & 2032
- Figure 79: Asia Pacific US Ready to Drink Tea Market Revenue (Million), by Distribution Channel 2024 & 2032
- Figure 80: Asia Pacific US Ready to Drink Tea Market Volume (K Tons), by Distribution Channel 2024 & 2032
- Figure 81: Asia Pacific US Ready to Drink Tea Market Revenue Share (%), by Distribution Channel 2024 & 2032
- Figure 82: Asia Pacific US Ready to Drink Tea Market Volume Share (%), by Distribution Channel 2024 & 2032
- Figure 83: Asia Pacific US Ready to Drink Tea Market Revenue (Million), by Country 2024 & 2032
- Figure 84: Asia Pacific US Ready to Drink Tea Market Volume (K Tons), by Country 2024 & 2032
- Figure 85: Asia Pacific US Ready to Drink Tea Market Revenue Share (%), by Country 2024 & 2032
- Figure 86: Asia Pacific US Ready to Drink Tea Market Volume Share (%), by Country 2024 & 2032
List of Tables
- Table 1: Global US Ready to Drink Tea Market Revenue Million Forecast, by Region 2019 & 2032
- Table 2: Global US Ready to Drink Tea Market Volume K Tons Forecast, by Region 2019 & 2032
- Table 3: Global US Ready to Drink Tea Market Revenue Million Forecast, by Soft Drink Type 2019 & 2032
- Table 4: Global US Ready to Drink Tea Market Volume K Tons Forecast, by Soft Drink Type 2019 & 2032
- Table 5: Global US Ready to Drink Tea Market Revenue Million Forecast, by Packaging Type 2019 & 2032
- Table 6: Global US Ready to Drink Tea Market Volume K Tons Forecast, by Packaging Type 2019 & 2032
- Table 7: Global US Ready to Drink Tea Market Revenue Million Forecast, by Distribution Channel 2019 & 2032
- Table 8: Global US Ready to Drink Tea Market Volume K Tons Forecast, by Distribution Channel 2019 & 2032
- Table 9: Global US Ready to Drink Tea Market Revenue Million Forecast, by Region 2019 & 2032
- Table 10: Global US Ready to Drink Tea Market Volume K Tons Forecast, by Region 2019 & 2032
- Table 11: Global US Ready to Drink Tea Market Revenue Million Forecast, by Country 2019 & 2032
- Table 12: Global US Ready to Drink Tea Market Volume K Tons Forecast, by Country 2019 & 2032
- Table 13: Northeast US Ready to Drink Tea Market Revenue (Million) Forecast, by Application 2019 & 2032
- Table 14: Northeast US Ready to Drink Tea Market Volume (K Tons) Forecast, by Application 2019 & 2032
- Table 15: Southeast US Ready to Drink Tea Market Revenue (Million) Forecast, by Application 2019 & 2032
- Table 16: Southeast US Ready to Drink Tea Market Volume (K Tons) Forecast, by Application 2019 & 2032
- Table 17: Midwest US Ready to Drink Tea Market Revenue (Million) Forecast, by Application 2019 & 2032
- Table 18: Midwest US Ready to Drink Tea Market Volume (K Tons) Forecast, by Application 2019 & 2032
- Table 19: Southwest US Ready to Drink Tea Market Revenue (Million) Forecast, by Application 2019 & 2032
- Table 20: Southwest US Ready to Drink Tea Market Volume (K Tons) Forecast, by Application 2019 & 2032
- Table 21: West US Ready to Drink Tea Market Revenue (Million) Forecast, by Application 2019 & 2032
- Table 22: West US Ready to Drink Tea Market Volume (K Tons) Forecast, by Application 2019 & 2032
- Table 23: Global US Ready to Drink Tea Market Revenue Million Forecast, by Soft Drink Type 2019 & 2032
- Table 24: Global US Ready to Drink Tea Market Volume K Tons Forecast, by Soft Drink Type 2019 & 2032
- Table 25: Global US Ready to Drink Tea Market Revenue Million Forecast, by Packaging Type 2019 & 2032
- Table 26: Global US Ready to Drink Tea Market Volume K Tons Forecast, by Packaging Type 2019 & 2032
- Table 27: Global US Ready to Drink Tea Market Revenue Million Forecast, by Distribution Channel 2019 & 2032
- Table 28: Global US Ready to Drink Tea Market Volume K Tons Forecast, by Distribution Channel 2019 & 2032
- Table 29: Global US Ready to Drink Tea Market Revenue Million Forecast, by Country 2019 & 2032
- Table 30: Global US Ready to Drink Tea Market Volume K Tons Forecast, by Country 2019 & 2032
- Table 31: United States US Ready to Drink Tea Market Revenue (Million) Forecast, by Application 2019 & 2032
- Table 32: United States US Ready to Drink Tea Market Volume (K Tons) Forecast, by Application 2019 & 2032
- Table 33: Canada US Ready to Drink Tea Market Revenue (Million) Forecast, by Application 2019 & 2032
- Table 34: Canada US Ready to Drink Tea Market Volume (K Tons) Forecast, by Application 2019 & 2032
- Table 35: Mexico US Ready to Drink Tea Market Revenue (Million) Forecast, by Application 2019 & 2032
- Table 36: Mexico US Ready to Drink Tea Market Volume (K Tons) Forecast, by Application 2019 & 2032
- Table 37: Global US Ready to Drink Tea Market Revenue Million Forecast, by Soft Drink Type 2019 & 2032
- Table 38: Global US Ready to Drink Tea Market Volume K Tons Forecast, by Soft Drink Type 2019 & 2032
- Table 39: Global US Ready to Drink Tea Market Revenue Million Forecast, by Packaging Type 2019 & 2032
- Table 40: Global US Ready to Drink Tea Market Volume K Tons Forecast, by Packaging Type 2019 & 2032
- Table 41: Global US Ready to Drink Tea Market Revenue Million Forecast, by Distribution Channel 2019 & 2032
- Table 42: Global US Ready to Drink Tea Market Volume K Tons Forecast, by Distribution Channel 2019 & 2032
- Table 43: Global US Ready to Drink Tea Market Revenue Million Forecast, by Country 2019 & 2032
- Table 44: Global US Ready to Drink Tea Market Volume K Tons Forecast, by Country 2019 & 2032
- Table 45: Brazil US Ready to Drink Tea Market Revenue (Million) Forecast, by Application 2019 & 2032
- Table 46: Brazil US Ready to Drink Tea Market Volume (K Tons) Forecast, by Application 2019 & 2032
- Table 47: Argentina US Ready to Drink Tea Market Revenue (Million) Forecast, by Application 2019 & 2032
- Table 48: Argentina US Ready to Drink Tea Market Volume (K Tons) Forecast, by Application 2019 & 2032
- Table 49: Rest of South America US Ready to Drink Tea Market Revenue (Million) Forecast, by Application 2019 & 2032
- Table 50: Rest of South America US Ready to Drink Tea Market Volume (K Tons) Forecast, by Application 2019 & 2032
- Table 51: Global US Ready to Drink Tea Market Revenue Million Forecast, by Soft Drink Type 2019 & 2032
- Table 52: Global US Ready to Drink Tea Market Volume K Tons Forecast, by Soft Drink Type 2019 & 2032
- Table 53: Global US Ready to Drink Tea Market Revenue Million Forecast, by Packaging Type 2019 & 2032
- Table 54: Global US Ready to Drink Tea Market Volume K Tons Forecast, by Packaging Type 2019 & 2032
- Table 55: Global US Ready to Drink Tea Market Revenue Million Forecast, by Distribution Channel 2019 & 2032
- Table 56: Global US Ready to Drink Tea Market Volume K Tons Forecast, by Distribution Channel 2019 & 2032
- Table 57: Global US Ready to Drink Tea Market Revenue Million Forecast, by Country 2019 & 2032
- Table 58: Global US Ready to Drink Tea Market Volume K Tons Forecast, by Country 2019 & 2032
- Table 59: United Kingdom US Ready to Drink Tea Market Revenue (Million) Forecast, by Application 2019 & 2032
- Table 60: United Kingdom US Ready to Drink Tea Market Volume (K Tons) Forecast, by Application 2019 & 2032
- Table 61: Germany US Ready to Drink Tea Market Revenue (Million) Forecast, by Application 2019 & 2032
- Table 62: Germany US Ready to Drink Tea Market Volume (K Tons) Forecast, by Application 2019 & 2032
- Table 63: France US Ready to Drink Tea Market Revenue (Million) Forecast, by Application 2019 & 2032
- Table 64: France US Ready to Drink Tea Market Volume (K Tons) Forecast, by Application 2019 & 2032
- Table 65: Italy US Ready to Drink Tea Market Revenue (Million) Forecast, by Application 2019 & 2032
- Table 66: Italy US Ready to Drink Tea Market Volume (K Tons) Forecast, by Application 2019 & 2032
- Table 67: Spain US Ready to Drink Tea Market Revenue (Million) Forecast, by Application 2019 & 2032
- Table 68: Spain US Ready to Drink Tea Market Volume (K Tons) Forecast, by Application 2019 & 2032
- Table 69: Russia US Ready to Drink Tea Market Revenue (Million) Forecast, by Application 2019 & 2032
- Table 70: Russia US Ready to Drink Tea Market Volume (K Tons) Forecast, by Application 2019 & 2032
- Table 71: Benelux US Ready to Drink Tea Market Revenue (Million) Forecast, by Application 2019 & 2032
- Table 72: Benelux US Ready to Drink Tea Market Volume (K Tons) Forecast, by Application 2019 & 2032
- Table 73: Nordics US Ready to Drink Tea Market Revenue (Million) Forecast, by Application 2019 & 2032
- Table 74: Nordics US Ready to Drink Tea Market Volume (K Tons) Forecast, by Application 2019 & 2032
- Table 75: Rest of Europe US Ready to Drink Tea Market Revenue (Million) Forecast, by Application 2019 & 2032
- Table 76: Rest of Europe US Ready to Drink Tea Market Volume (K Tons) Forecast, by Application 2019 & 2032
- Table 77: Global US Ready to Drink Tea Market Revenue Million Forecast, by Soft Drink Type 2019 & 2032
- Table 78: Global US Ready to Drink Tea Market Volume K Tons Forecast, by Soft Drink Type 2019 & 2032
- Table 79: Global US Ready to Drink Tea Market Revenue Million Forecast, by Packaging Type 2019 & 2032
- Table 80: Global US Ready to Drink Tea Market Volume K Tons Forecast, by Packaging Type 2019 & 2032
- Table 81: Global US Ready to Drink Tea Market Revenue Million Forecast, by Distribution Channel 2019 & 2032
- Table 82: Global US Ready to Drink Tea Market Volume K Tons Forecast, by Distribution Channel 2019 & 2032
- Table 83: Global US Ready to Drink Tea Market Revenue Million Forecast, by Country 2019 & 2032
- Table 84: Global US Ready to Drink Tea Market Volume K Tons Forecast, by Country 2019 & 2032
- Table 85: Turkey US Ready to Drink Tea Market Revenue (Million) Forecast, by Application 2019 & 2032
- Table 86: Turkey US Ready to Drink Tea Market Volume (K Tons) Forecast, by Application 2019 & 2032
- Table 87: Israel US Ready to Drink Tea Market Revenue (Million) Forecast, by Application 2019 & 2032
- Table 88: Israel US Ready to Drink Tea Market Volume (K Tons) Forecast, by Application 2019 & 2032
- Table 89: GCC US Ready to Drink Tea Market Revenue (Million) Forecast, by Application 2019 & 2032
- Table 90: GCC US Ready to Drink Tea Market Volume (K Tons) Forecast, by Application 2019 & 2032
- Table 91: North Africa US Ready to Drink Tea Market Revenue (Million) Forecast, by Application 2019 & 2032
- Table 92: North Africa US Ready to Drink Tea Market Volume (K Tons) Forecast, by Application 2019 & 2032
- Table 93: South Africa US Ready to Drink Tea Market Revenue (Million) Forecast, by Application 2019 & 2032
- Table 94: South Africa US Ready to Drink Tea Market Volume (K Tons) Forecast, by Application 2019 & 2032
- Table 95: Rest of Middle East & Africa US Ready to Drink Tea Market Revenue (Million) Forecast, by Application 2019 & 2032
- Table 96: Rest of Middle East & Africa US Ready to Drink Tea Market Volume (K Tons) Forecast, by Application 2019 & 2032
- Table 97: Global US Ready to Drink Tea Market Revenue Million Forecast, by Soft Drink Type 2019 & 2032
- Table 98: Global US Ready to Drink Tea Market Volume K Tons Forecast, by Soft Drink Type 2019 & 2032
- Table 99: Global US Ready to Drink Tea Market Revenue Million Forecast, by Packaging Type 2019 & 2032
- Table 100: Global US Ready to Drink Tea Market Volume K Tons Forecast, by Packaging Type 2019 & 2032
- Table 101: Global US Ready to Drink Tea Market Revenue Million Forecast, by Distribution Channel 2019 & 2032
- Table 102: Global US Ready to Drink Tea Market Volume K Tons Forecast, by Distribution Channel 2019 & 2032
- Table 103: Global US Ready to Drink Tea Market Revenue Million Forecast, by Country 2019 & 2032
- Table 104: Global US Ready to Drink Tea Market Volume K Tons Forecast, by Country 2019 & 2032
- Table 105: China US Ready to Drink Tea Market Revenue (Million) Forecast, by Application 2019 & 2032
- Table 106: China US Ready to Drink Tea Market Volume (K Tons) Forecast, by Application 2019 & 2032
- Table 107: India US Ready to Drink Tea Market Revenue (Million) Forecast, by Application 2019 & 2032
- Table 108: India US Ready to Drink Tea Market Volume (K Tons) Forecast, by Application 2019 & 2032
- Table 109: Japan US Ready to Drink Tea Market Revenue (Million) Forecast, by Application 2019 & 2032
- Table 110: Japan US Ready to Drink Tea Market Volume (K Tons) Forecast, by Application 2019 & 2032
- Table 111: South Korea US Ready to Drink Tea Market Revenue (Million) Forecast, by Application 2019 & 2032
- Table 112: South Korea US Ready to Drink Tea Market Volume (K Tons) Forecast, by Application 2019 & 2032
- Table 113: ASEAN US Ready to Drink Tea Market Revenue (Million) Forecast, by Application 2019 & 2032
- Table 114: ASEAN US Ready to Drink Tea Market Volume (K Tons) Forecast, by Application 2019 & 2032
- Table 115: Oceania US Ready to Drink Tea Market Revenue (Million) Forecast, by Application 2019 & 2032
- Table 116: Oceania US Ready to Drink Tea Market Volume (K Tons) Forecast, by Application 2019 & 2032
- Table 117: Rest of Asia Pacific US Ready to Drink Tea Market Revenue (Million) Forecast, by Application 2019 & 2032
- Table 118: Rest of Asia Pacific US Ready to Drink Tea Market Volume (K Tons) Forecast, by Application 2019 & 2032
Frequently Asked Questions
1. What is the projected Compound Annual Growth Rate (CAGR) of the US Ready to Drink Tea Market?
The projected CAGR is approximately 1.50%.
2. Which companies are prominent players in the US Ready to Drink Tea Market?
Key companies in the market include Red Diamond Inc, Arizona Beverages USA LLC, Milo’s Tea Company Inc, Nestle S A, Ito En Ltd, PepsiCo Inc, Hawaiian Sun Products Inc, Keurig Dr Pepper Inc, The Coca-Cola Company, Del Monte Foods Inc, Reily Foods Company, Walmart Inc.
3. What are the main segments of the US Ready to Drink Tea Market?
The market segments include Soft Drink Type, Packaging Type, Distribution Channel.
4. Can you provide details about the market size?
The market size is estimated to be USD 34300 Million as of 2022.
5. What are some drivers contributing to market growth?
Increasing demand for meat alternatives.
6. What are the notable trends driving market growth?
OTHER KEY INDUSTRY TRENDS COVERED IN THE REPORT.
7. Are there any restraints impacting market growth?
Presence of numerous alternatives in the plant proteins.
8. Can you provide examples of recent developments in the market?
January 2023: Milo's Tea Company has announced an initial investment of over USD 130 million to construct a new plant and distribution centre in Spartanburg County, South Carolina. This new investment is a direct response to the growth of Milo's brand. Milo expects to start producing its famous tea and lemonade in the fall of 2024.January 2023: Lipton Tea partnered with Full Cart, a program within the nonprofit U.S. Hunger, and a virtual food pantry, to enhance access to heart-friendly nutrition and grocery assistance.December 2022: Pure Leaf rolled out a limited-edition Merry Mint Iced Tea, coinciding with the release of the Christmas movie 'Christmas Class Reunion'. This mint-flavored iced tea was simultaneously launched through a social media giveaway, enhancing the movie-watching experience for consumers.
9. What pricing options are available for accessing the report?
Pricing options include single-user, multi-user, and enterprise licenses priced at USD 3800, USD 4500, and USD 5800 respectively.
10. Is the market size provided in terms of value or volume?
The market size is provided in terms of value, measured in Million and volume, measured in K Tons.
11. Are there any specific market keywords associated with the report?
Yes, the market keyword associated with the report is "US Ready to Drink Tea Market," which aids in identifying and referencing the specific market segment covered.
12. How do I determine which pricing option suits my needs best?
The pricing options vary based on user requirements and access needs. Individual users may opt for single-user licenses, while businesses requiring broader access may choose multi-user or enterprise licenses for cost-effective access to the report.
13. Are there any additional resources or data provided in the US Ready to Drink Tea Market report?
While the report offers comprehensive insights, it's advisable to review the specific contents or supplementary materials provided to ascertain if additional resources or data are available.
14. How can I stay updated on further developments or reports in the US Ready to Drink Tea Market?
To stay informed about further developments, trends, and reports in the US Ready to Drink Tea Market, consider subscribing to industry newsletters, following relevant companies and organizations, or regularly checking reputable industry news sources and publications.
Methodology
Step 1 - Identification of Relevant Samples Size from Population Database


Step 2 - Approaches for Defining Global Market Size (Value, Volume* & Price*)

Note*: In applicable scenarios
Step 3 - Data Sources
Primary Research
- Web Analytics
- Survey Reports
- Research Institute
- Latest Research Reports
- Opinion Leaders
Secondary Research
- Annual Reports
- White Paper
- Latest Press Release
- Industry Association
- Paid Database
- Investor Presentations

Step 4 - Data Triangulation
Involves using different sources of information in order to increase the validity of a study
These sources are likely to be stakeholders in a program - participants, other researchers, program staff, other community members, and so on.
Then we put all data in single framework & apply various statistical tools to find out the dynamic on the market.
During the analysis stage, feedback from the stakeholder groups would be compared to determine areas of agreement as well as areas of divergence


