
Key Insights
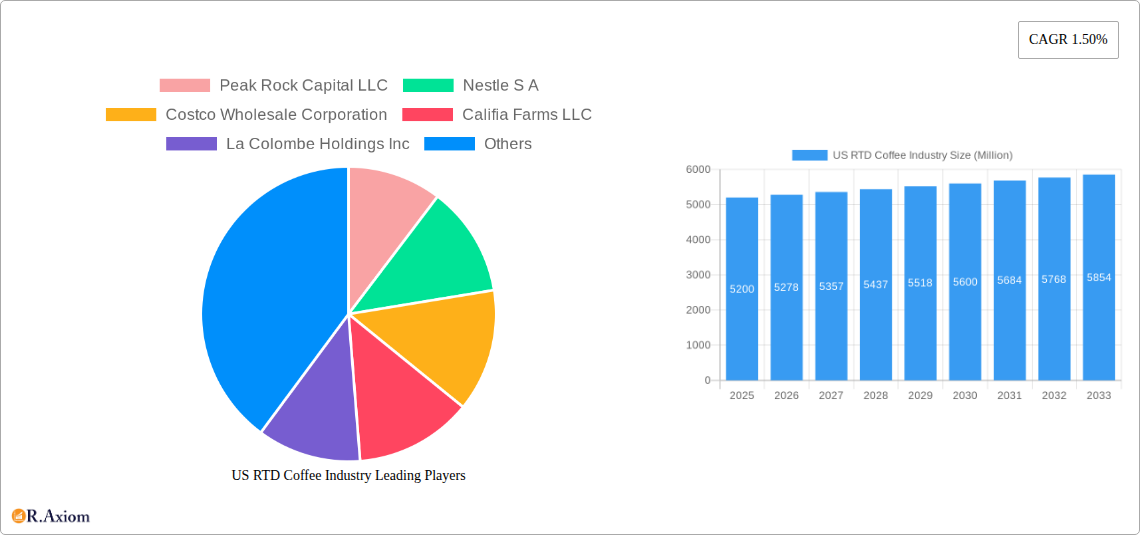
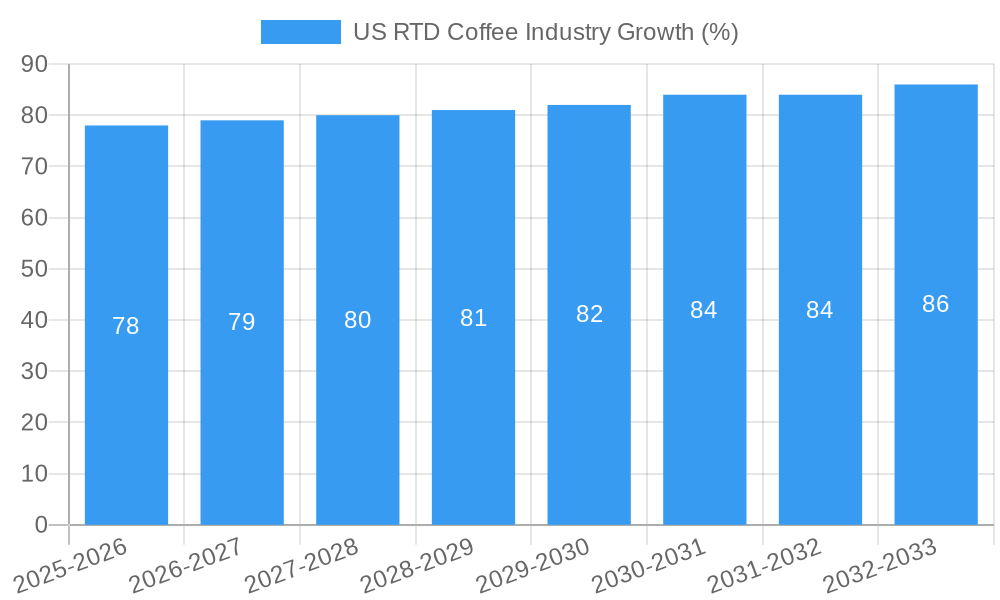
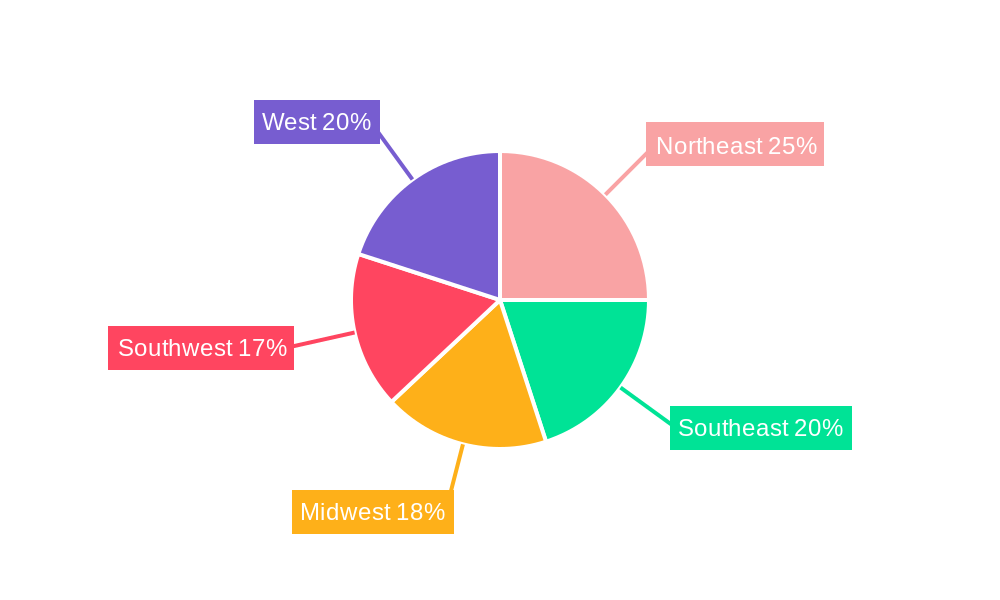
The US ready-to-drink (RTD) coffee market, valued at $5.2 billion in 2025, is projected to experience steady growth, driven by several key factors. The increasing preference for convenient and on-the-go beverage options fuels demand, particularly among younger demographics. The rise of innovative flavors, such as cold brew and unique iced coffee blends, coupled with the expansion of premium offerings, caters to evolving consumer tastes and boosts sales. Furthermore, the strategic partnerships between established beverage giants and emerging specialty coffee brands contribute to market expansion through enhanced distribution networks and brand awareness. While aseptic packaging maintains its dominance, the growing popularity of sustainable and eco-friendly packaging options, like aluminum cans, is influencing packaging type selection. The market is segmented by distribution channels (off-trade dominating), soft drink type (cold brew and iced coffee leading), and packaging type, all showing significant growth opportunities. Competition among major players like Nestle, PepsiCo, and Coca-Cola, along with smaller, innovative brands, fosters continuous innovation and product diversification. The market's regional spread reflects the overall US beverage consumption patterns, with higher concentration in urban areas and regions with a strong café culture. The consistent 1.5% CAGR suggests a stable and predictable growth trajectory, though specific regional variations may exist.
Despite the positive growth outlook, the RTD coffee market faces some challenges. Fluctuations in coffee bean prices and potential supply chain disruptions can impact profitability. Maintaining consistent quality and freshness across various distribution channels and maintaining brand loyalty in a highly competitive landscape require ongoing investment and effective marketing strategies. The increasing health consciousness among consumers might necessitate the development of healthier, lower-sugar options to sustain market growth. The effectiveness of marketing and distribution efforts will be crucial in capturing market share within specific segments. Continued investment in research and development to introduce new and exciting product lines will help RTD coffee brands to successfully adapt to shifting consumer preferences. Successful brands will likely focus on sustainable packaging options and environmentally conscious practices to appeal to a growing segment of ethically-conscious consumers.
US RTD Coffee Industry: A Comprehensive Market Report (2019-2033)
This detailed report provides a comprehensive analysis of the US Ready-to-Drink (RTD) coffee industry, covering market size, segmentation, key players, competitive landscape, and future growth prospects. The study period spans from 2019 to 2033, with 2025 serving as the base and estimated year. The report offers actionable insights for industry stakeholders, including manufacturers, distributors, investors, and market entrants. Expected market values are in Millions USD.
US RTD Coffee Industry Market Concentration & Innovation
The US RTD coffee market exhibits a moderately concentrated structure, with a few major players holding significant market share. While precise market share figures for each company are proprietary data and unavailable for this public report, industry giants like Nestle S.A., PepsiCo Inc., and The Coca-Cola Company command substantial portions. Smaller, niche players like Califia Farms and La Colombe contribute significantly to market innovation and cater to specific consumer preferences.
Market Concentration: The Herfindahl-Hirschman Index (HHI) for the US RTD coffee market is estimated to be around xx, indicating a moderately concentrated market.
Innovation Drivers: The RTD coffee sector is driven by product innovation, focusing on new flavors (e.g., cold brew, nitro-infused), functional additions (e.g., added protein, adaptogens), and sustainable packaging solutions.
Regulatory Framework: The FDA’s regulations on food and beverage labeling and safety influence production and marketing.
Product Substitutes: Other caffeinated beverages (e.g., energy drinks, tea) and home-brewed coffee pose competitive challenges.
End-User Trends: Growing consumer demand for convenience, health-conscious options, and premium coffee experiences fuels market growth.
M&A Activities: The industry has seen strategic mergers and acquisitions (M&A). For example, Keurig Dr Pepper's investment in La Colombe signifies industry consolidation and expansion strategies. While exact M&A deal values are confidential and unavailable for this report, it's predicted these transactions are valued in the range of hundreds of millions.
US RTD Coffee Industry Industry Trends & Insights
The US RTD coffee market exhibits robust growth, driven by several factors. The Compound Annual Growth Rate (CAGR) from 2019 to 2024 is estimated at xx%, with projections for a xx% CAGR from 2025 to 2033. This growth reflects the increasing preference for convenient and ready-to-consume beverages, coupled with the rising demand for premium coffee offerings. Market penetration is currently estimated at xx% of the overall coffee market, projected to reach xx% by 2033.
Technological disruptions, such as improved cold brew extraction techniques and innovative packaging solutions, enhance product quality, shelf life, and consumer experience. Consumer preferences are shifting towards healthier options, driving demand for organic, low-sugar, and plant-based varieties. The competitive landscape is dynamic, with established players facing competition from emerging brands focusing on niche segments.
Dominant Markets & Segments in US RTD Coffee Industry
Distribution Channel: The off-trade channel (grocery stores, convenience stores, etc.) dominates the RTD coffee market, accounting for xx% of total sales in 2025, mainly due to greater accessibility and wider consumer reach. The on-trade (restaurants, cafes) segment contributes a smaller, though growing, percentage.
Soft Drink Type: Iced coffee remains the largest segment, though the cold brew coffee category is experiencing rapid growth, driven by its smooth, less bitter profile. Other RTD coffee encompasses various specialty coffee drinks.
Packaging Type: PET bottles hold the largest market share in terms of packaging, due to affordability and convenience. However, the demand for sustainable packaging options such as aseptic packages and metal cans is steadily increasing, especially among environmentally conscious consumers.
Key Drivers: The growth of each segment is influenced by several factors, including price points, consumer preferences for specific beverages, and the availability of packaging options. The off-trade channel's dominance is partly attributed to better distribution networks.
US RTD Coffee Industry Product Developments
Product innovation plays a crucial role in driving the growth of the US RTD coffee market. New products regularly launch, incorporating features like unique flavor combinations, functional ingredients (e.g., protein, vitamins), and various brewing methods (e.g., cold brew, nitro-infused). The emphasis is on enhancing flavor profiles, extending shelf life, and focusing on premiumization and convenience to capture broader consumer segments. Sustainability is also a key driver, with manufacturers focusing on eco-friendly packaging and sourcing practices.
Report Scope & Segmentation Analysis
This report segments the US RTD coffee market across various parameters:
Distribution Channel: Off-trade (supermarkets, convenience stores) and On-trade (cafes, restaurants). Off-trade is expected to grow at xx% CAGR from 2025-2033.
Soft Drink Type: Cold Brew Coffee, Iced Coffee, and Other RTD Coffee. Cold brew is experiencing faster growth due to the trendy nature of this coffee style.
Packaging Type: Aseptic packages, Glass Bottles, Metal Cans, and PET Bottles. PET bottles will maintain their dominance despite rising popularity of eco-friendly alternatives.
Each segment's growth is assessed based on its individual market dynamics and competitive intensity.
Key Drivers of US RTD Coffee Industry Growth
Several factors fuel the US RTD coffee market's growth: Firstly, the increasing demand for convenient and ready-to-consume beverages is a primary driver. Secondly, the changing consumer preferences towards premium coffee, enhanced with unique flavors and functionalities, also contribute to the expansion. Furthermore, technological advancements in packaging and brewing enhance product quality and shelf life.
Challenges in the US RTD Coffee Industry Sector
The RTD coffee market faces challenges, including intense competition from established players and emerging brands. Fluctuations in raw material prices (coffee beans, milk, sugar) impact production costs. Regulatory changes concerning labeling, health claims, and sustainability could lead to increased compliance expenses.
Emerging Opportunities in US RTD Coffee Industry
Growing demand for functional beverages, organic coffee, and plant-based options creates significant opportunities. Expanding into new distribution channels, such as online platforms, and leveraging innovative packaging solutions opens up further possibilities. Targeting health-conscious consumers with added-value products also holds great potential.
Leading Players in the US RTD Coffee Industry Market
- Peak Rock Capital LLC
- Nestle S.A.
- Costco Wholesale Corporation
- Califia Farms LLC
- La Colombe Holdings Inc
- BRC Inc
- PepsiCo Inc.
- The Coca-Cola Company
- The Central America Bottling Corporation
- Luigi Lavazza S.p.A
- Keurig Dr Pepper Inc.
- Danone S.A.
- Chamberlain Coffee Inc
Key Developments in US RTD Coffee Industry Industry
July 2023: Keurig Dr Pepper Inc.’s strategic partnership with La Colombe strengthens KDP's presence in the premium RTD coffee segment.
April 2023: Chamberlain Coffee’s Walmart launch expands its market reach.
February 2023: Danone's planned investment boosts its RTD coffee production capacity.
Strategic Outlook for US RTD Coffee Industry Market
The US RTD coffee market demonstrates considerable growth potential, driven by continuing innovation, increased consumer demand for premium and convenient coffee, and the entry of new players. The market is poised for expansion, with opportunities in new product categories, sustainable packaging, and expanding distribution networks. Further M&A activity is anticipated as established players look to bolster their market positions.
US RTD Coffee Industry Segmentation
-
1. Soft Drink Type
- 1.1. Cold Brew Coffee
- 1.2. Iced coffee
- 1.3. Other RTD Coffee
-
2. Packaging Type
- 2.1. Aseptic packages
- 2.2. Glass Bottles
- 2.3. Metal Can
- 2.4. PET Bottles
-
3. Distribution Channel
-
3.1. Off-trade
- 3.1.1. Convenience Stores
- 3.1.2. Online Retail
- 3.1.3. Specialty Stores
- 3.1.4. Supermarket/Hypermarket
- 3.1.5. Others
- 3.2. On-trade
-
3.1. Off-trade
US RTD Coffee Industry Segmentation By Geography
-
1. North America
- 1.1. United States
- 1.2. Canada
- 1.3. Mexico
-
2. South America
- 2.1. Brazil
- 2.2. Argentina
- 2.3. Rest of South America
-
3. Europe
- 3.1. United Kingdom
- 3.2. Germany
- 3.3. France
- 3.4. Italy
- 3.5. Spain
- 3.6. Russia
- 3.7. Benelux
- 3.8. Nordics
- 3.9. Rest of Europe
-
4. Middle East & Africa
- 4.1. Turkey
- 4.2. Israel
- 4.3. GCC
- 4.4. North Africa
- 4.5. South Africa
- 4.6. Rest of Middle East & Africa
-
5. Asia Pacific
- 5.1. China
- 5.2. India
- 5.3. Japan
- 5.4. South Korea
- 5.5. ASEAN
- 5.6. Oceania
- 5.7. Rest of Asia Pacific
US RTD Coffee Industry REPORT HIGHLIGHTS
| Aspects | Details |
|---|---|
| Study Period | 2019-2033 |
| Base Year | 2024 |
| Estimated Year | 2025 |
| Forecast Period | 2025-2033 |
| Historical Period | 2019-2024 |
| Growth Rate | CAGR of 1.50% from 2019-2033 |
| Segmentation |
|
Table of Contents
- 1. Introduction
- 1.1. Research Scope
- 1.2. Market Segmentation
- 1.3. Research Methodology
- 1.4. Definitions and Assumptions
- 2. Executive Summary
- 2.1. Introduction
- 3. Market Dynamics
- 3.1. Introduction
- 3.2. Market Drivers
- 3.2.1. Increasing demand for meat alternatives
- 3.3. Market Restrains
- 3.3.1. Presence of numerous alternatives in the plant proteins
- 3.4. Market Trends
- 3.4.1. OTHER KEY INDUSTRY TRENDS COVERED IN THE REPORT
- 4. Market Factor Analysis
- 4.1. Porters Five Forces
- 4.2. Supply/Value Chain
- 4.3. PESTEL analysis
- 4.4. Market Entropy
- 4.5. Patent/Trademark Analysis
- 5. Global US RTD Coffee Industry Analysis, Insights and Forecast, 2019-2031
- 5.1. Market Analysis, Insights and Forecast - by Soft Drink Type
- 5.1.1. Cold Brew Coffee
- 5.1.2. Iced coffee
- 5.1.3. Other RTD Coffee
- 5.2. Market Analysis, Insights and Forecast - by Packaging Type
- 5.2.1. Aseptic packages
- 5.2.2. Glass Bottles
- 5.2.3. Metal Can
- 5.2.4. PET Bottles
- 5.3. Market Analysis, Insights and Forecast - by Distribution Channel
- 5.3.1. Off-trade
- 5.3.1.1. Convenience Stores
- 5.3.1.2. Online Retail
- 5.3.1.3. Specialty Stores
- 5.3.1.4. Supermarket/Hypermarket
- 5.3.1.5. Others
- 5.3.2. On-trade
- 5.3.1. Off-trade
- 5.4. Market Analysis, Insights and Forecast - by Region
- 5.4.1. North America
- 5.4.2. South America
- 5.4.3. Europe
- 5.4.4. Middle East & Africa
- 5.4.5. Asia Pacific
- 5.1. Market Analysis, Insights and Forecast - by Soft Drink Type
- 6. North America US RTD Coffee Industry Analysis, Insights and Forecast, 2019-2031
- 6.1. Market Analysis, Insights and Forecast - by Soft Drink Type
- 6.1.1. Cold Brew Coffee
- 6.1.2. Iced coffee
- 6.1.3. Other RTD Coffee
- 6.2. Market Analysis, Insights and Forecast - by Packaging Type
- 6.2.1. Aseptic packages
- 6.2.2. Glass Bottles
- 6.2.3. Metal Can
- 6.2.4. PET Bottles
- 6.3. Market Analysis, Insights and Forecast - by Distribution Channel
- 6.3.1. Off-trade
- 6.3.1.1. Convenience Stores
- 6.3.1.2. Online Retail
- 6.3.1.3. Specialty Stores
- 6.3.1.4. Supermarket/Hypermarket
- 6.3.1.5. Others
- 6.3.2. On-trade
- 6.3.1. Off-trade
- 6.1. Market Analysis, Insights and Forecast - by Soft Drink Type
- 7. South America US RTD Coffee Industry Analysis, Insights and Forecast, 2019-2031
- 7.1. Market Analysis, Insights and Forecast - by Soft Drink Type
- 7.1.1. Cold Brew Coffee
- 7.1.2. Iced coffee
- 7.1.3. Other RTD Coffee
- 7.2. Market Analysis, Insights and Forecast - by Packaging Type
- 7.2.1. Aseptic packages
- 7.2.2. Glass Bottles
- 7.2.3. Metal Can
- 7.2.4. PET Bottles
- 7.3. Market Analysis, Insights and Forecast - by Distribution Channel
- 7.3.1. Off-trade
- 7.3.1.1. Convenience Stores
- 7.3.1.2. Online Retail
- 7.3.1.3. Specialty Stores
- 7.3.1.4. Supermarket/Hypermarket
- 7.3.1.5. Others
- 7.3.2. On-trade
- 7.3.1. Off-trade
- 7.1. Market Analysis, Insights and Forecast - by Soft Drink Type
- 8. Europe US RTD Coffee Industry Analysis, Insights and Forecast, 2019-2031
- 8.1. Market Analysis, Insights and Forecast - by Soft Drink Type
- 8.1.1. Cold Brew Coffee
- 8.1.2. Iced coffee
- 8.1.3. Other RTD Coffee
- 8.2. Market Analysis, Insights and Forecast - by Packaging Type
- 8.2.1. Aseptic packages
- 8.2.2. Glass Bottles
- 8.2.3. Metal Can
- 8.2.4. PET Bottles
- 8.3. Market Analysis, Insights and Forecast - by Distribution Channel
- 8.3.1. Off-trade
- 8.3.1.1. Convenience Stores
- 8.3.1.2. Online Retail
- 8.3.1.3. Specialty Stores
- 8.3.1.4. Supermarket/Hypermarket
- 8.3.1.5. Others
- 8.3.2. On-trade
- 8.3.1. Off-trade
- 8.1. Market Analysis, Insights and Forecast - by Soft Drink Type
- 9. Middle East & Africa US RTD Coffee Industry Analysis, Insights and Forecast, 2019-2031
- 9.1. Market Analysis, Insights and Forecast - by Soft Drink Type
- 9.1.1. Cold Brew Coffee
- 9.1.2. Iced coffee
- 9.1.3. Other RTD Coffee
- 9.2. Market Analysis, Insights and Forecast - by Packaging Type
- 9.2.1. Aseptic packages
- 9.2.2. Glass Bottles
- 9.2.3. Metal Can
- 9.2.4. PET Bottles
- 9.3. Market Analysis, Insights and Forecast - by Distribution Channel
- 9.3.1. Off-trade
- 9.3.1.1. Convenience Stores
- 9.3.1.2. Online Retail
- 9.3.1.3. Specialty Stores
- 9.3.1.4. Supermarket/Hypermarket
- 9.3.1.5. Others
- 9.3.2. On-trade
- 9.3.1. Off-trade
- 9.1. Market Analysis, Insights and Forecast - by Soft Drink Type
- 10. Asia Pacific US RTD Coffee Industry Analysis, Insights and Forecast, 2019-2031
- 10.1. Market Analysis, Insights and Forecast - by Soft Drink Type
- 10.1.1. Cold Brew Coffee
- 10.1.2. Iced coffee
- 10.1.3. Other RTD Coffee
- 10.2. Market Analysis, Insights and Forecast - by Packaging Type
- 10.2.1. Aseptic packages
- 10.2.2. Glass Bottles
- 10.2.3. Metal Can
- 10.2.4. PET Bottles
- 10.3. Market Analysis, Insights and Forecast - by Distribution Channel
- 10.3.1. Off-trade
- 10.3.1.1. Convenience Stores
- 10.3.1.2. Online Retail
- 10.3.1.3. Specialty Stores
- 10.3.1.4. Supermarket/Hypermarket
- 10.3.1.5. Others
- 10.3.2. On-trade
- 10.3.1. Off-trade
- 10.1. Market Analysis, Insights and Forecast - by Soft Drink Type
- 11. Northeast US RTD Coffee Industry Analysis, Insights and Forecast, 2019-2031
- 12. Southeast US RTD Coffee Industry Analysis, Insights and Forecast, 2019-2031
- 13. Midwest US RTD Coffee Industry Analysis, Insights and Forecast, 2019-2031
- 14. Southwest US RTD Coffee Industry Analysis, Insights and Forecast, 2019-2031
- 15. West US RTD Coffee Industry Analysis, Insights and Forecast, 2019-2031
- 16. Competitive Analysis
- 16.1. Global Market Share Analysis 2024
- 16.2. Company Profiles
- 16.2.1 Peak Rock Capital LLC
- 16.2.1.1. Overview
- 16.2.1.2. Products
- 16.2.1.3. SWOT Analysis
- 16.2.1.4. Recent Developments
- 16.2.1.5. Financials (Based on Availability)
- 16.2.2 Nestle S A
- 16.2.2.1. Overview
- 16.2.2.2. Products
- 16.2.2.3. SWOT Analysis
- 16.2.2.4. Recent Developments
- 16.2.2.5. Financials (Based on Availability)
- 16.2.3 Costco Wholesale Corporation
- 16.2.3.1. Overview
- 16.2.3.2. Products
- 16.2.3.3. SWOT Analysis
- 16.2.3.4. Recent Developments
- 16.2.3.5. Financials (Based on Availability)
- 16.2.4 Califia Farms LLC
- 16.2.4.1. Overview
- 16.2.4.2. Products
- 16.2.4.3. SWOT Analysis
- 16.2.4.4. Recent Developments
- 16.2.4.5. Financials (Based on Availability)
- 16.2.5 La Colombe Holdings Inc
- 16.2.5.1. Overview
- 16.2.5.2. Products
- 16.2.5.3. SWOT Analysis
- 16.2.5.4. Recent Developments
- 16.2.5.5. Financials (Based on Availability)
- 16.2.6 BRC Inc
- 16.2.6.1. Overview
- 16.2.6.2. Products
- 16.2.6.3. SWOT Analysis
- 16.2.6.4. Recent Developments
- 16.2.6.5. Financials (Based on Availability)
- 16.2.7 PepsiCo Inc
- 16.2.7.1. Overview
- 16.2.7.2. Products
- 16.2.7.3. SWOT Analysis
- 16.2.7.4. Recent Developments
- 16.2.7.5. Financials (Based on Availability)
- 16.2.8 The Coca-Cola Compan
- 16.2.8.1. Overview
- 16.2.8.2. Products
- 16.2.8.3. SWOT Analysis
- 16.2.8.4. Recent Developments
- 16.2.8.5. Financials (Based on Availability)
- 16.2.9 The Central America Bottling Corporation
- 16.2.9.1. Overview
- 16.2.9.2. Products
- 16.2.9.3. SWOT Analysis
- 16.2.9.4. Recent Developments
- 16.2.9.5. Financials (Based on Availability)
- 16.2.10 Luigi Lavazza S p A
- 16.2.10.1. Overview
- 16.2.10.2. Products
- 16.2.10.3. SWOT Analysis
- 16.2.10.4. Recent Developments
- 16.2.10.5. Financials (Based on Availability)
- 16.2.11 Keurig Dr Pepper Inc
- 16.2.11.1. Overview
- 16.2.11.2. Products
- 16.2.11.3. SWOT Analysis
- 16.2.11.4. Recent Developments
- 16.2.11.5. Financials (Based on Availability)
- 16.2.12 Danone S A
- 16.2.12.1. Overview
- 16.2.12.2. Products
- 16.2.12.3. SWOT Analysis
- 16.2.12.4. Recent Developments
- 16.2.12.5. Financials (Based on Availability)
- 16.2.13 Chamberlain Coffee Inc
- 16.2.13.1. Overview
- 16.2.13.2. Products
- 16.2.13.3. SWOT Analysis
- 16.2.13.4. Recent Developments
- 16.2.13.5. Financials (Based on Availability)
- 16.2.1 Peak Rock Capital LLC
List of Figures
- Figure 1: Global US RTD Coffee Industry Revenue Breakdown (Million, %) by Region 2024 & 2032
- Figure 2: Global US RTD Coffee Industry Volume Breakdown (K Tons, %) by Region 2024 & 2032
- Figure 3: United states US RTD Coffee Industry Revenue (Million), by Country 2024 & 2032
- Figure 4: United states US RTD Coffee Industry Volume (K Tons), by Country 2024 & 2032
- Figure 5: United states US RTD Coffee Industry Revenue Share (%), by Country 2024 & 2032
- Figure 6: United states US RTD Coffee Industry Volume Share (%), by Country 2024 & 2032
- Figure 7: North America US RTD Coffee Industry Revenue (Million), by Soft Drink Type 2024 & 2032
- Figure 8: North America US RTD Coffee Industry Volume (K Tons), by Soft Drink Type 2024 & 2032
- Figure 9: North America US RTD Coffee Industry Revenue Share (%), by Soft Drink Type 2024 & 2032
- Figure 10: North America US RTD Coffee Industry Volume Share (%), by Soft Drink Type 2024 & 2032
- Figure 11: North America US RTD Coffee Industry Revenue (Million), by Packaging Type 2024 & 2032
- Figure 12: North America US RTD Coffee Industry Volume (K Tons), by Packaging Type 2024 & 2032
- Figure 13: North America US RTD Coffee Industry Revenue Share (%), by Packaging Type 2024 & 2032
- Figure 14: North America US RTD Coffee Industry Volume Share (%), by Packaging Type 2024 & 2032
- Figure 15: North America US RTD Coffee Industry Revenue (Million), by Distribution Channel 2024 & 2032
- Figure 16: North America US RTD Coffee Industry Volume (K Tons), by Distribution Channel 2024 & 2032
- Figure 17: North America US RTD Coffee Industry Revenue Share (%), by Distribution Channel 2024 & 2032
- Figure 18: North America US RTD Coffee Industry Volume Share (%), by Distribution Channel 2024 & 2032
- Figure 19: North America US RTD Coffee Industry Revenue (Million), by Country 2024 & 2032
- Figure 20: North America US RTD Coffee Industry Volume (K Tons), by Country 2024 & 2032
- Figure 21: North America US RTD Coffee Industry Revenue Share (%), by Country 2024 & 2032
- Figure 22: North America US RTD Coffee Industry Volume Share (%), by Country 2024 & 2032
- Figure 23: South America US RTD Coffee Industry Revenue (Million), by Soft Drink Type 2024 & 2032
- Figure 24: South America US RTD Coffee Industry Volume (K Tons), by Soft Drink Type 2024 & 2032
- Figure 25: South America US RTD Coffee Industry Revenue Share (%), by Soft Drink Type 2024 & 2032
- Figure 26: South America US RTD Coffee Industry Volume Share (%), by Soft Drink Type 2024 & 2032
- Figure 27: South America US RTD Coffee Industry Revenue (Million), by Packaging Type 2024 & 2032
- Figure 28: South America US RTD Coffee Industry Volume (K Tons), by Packaging Type 2024 & 2032
- Figure 29: South America US RTD Coffee Industry Revenue Share (%), by Packaging Type 2024 & 2032
- Figure 30: South America US RTD Coffee Industry Volume Share (%), by Packaging Type 2024 & 2032
- Figure 31: South America US RTD Coffee Industry Revenue (Million), by Distribution Channel 2024 & 2032
- Figure 32: South America US RTD Coffee Industry Volume (K Tons), by Distribution Channel 2024 & 2032
- Figure 33: South America US RTD Coffee Industry Revenue Share (%), by Distribution Channel 2024 & 2032
- Figure 34: South America US RTD Coffee Industry Volume Share (%), by Distribution Channel 2024 & 2032
- Figure 35: South America US RTD Coffee Industry Revenue (Million), by Country 2024 & 2032
- Figure 36: South America US RTD Coffee Industry Volume (K Tons), by Country 2024 & 2032
- Figure 37: South America US RTD Coffee Industry Revenue Share (%), by Country 2024 & 2032
- Figure 38: South America US RTD Coffee Industry Volume Share (%), by Country 2024 & 2032
- Figure 39: Europe US RTD Coffee Industry Revenue (Million), by Soft Drink Type 2024 & 2032
- Figure 40: Europe US RTD Coffee Industry Volume (K Tons), by Soft Drink Type 2024 & 2032
- Figure 41: Europe US RTD Coffee Industry Revenue Share (%), by Soft Drink Type 2024 & 2032
- Figure 42: Europe US RTD Coffee Industry Volume Share (%), by Soft Drink Type 2024 & 2032
- Figure 43: Europe US RTD Coffee Industry Revenue (Million), by Packaging Type 2024 & 2032
- Figure 44: Europe US RTD Coffee Industry Volume (K Tons), by Packaging Type 2024 & 2032
- Figure 45: Europe US RTD Coffee Industry Revenue Share (%), by Packaging Type 2024 & 2032
- Figure 46: Europe US RTD Coffee Industry Volume Share (%), by Packaging Type 2024 & 2032
- Figure 47: Europe US RTD Coffee Industry Revenue (Million), by Distribution Channel 2024 & 2032
- Figure 48: Europe US RTD Coffee Industry Volume (K Tons), by Distribution Channel 2024 & 2032
- Figure 49: Europe US RTD Coffee Industry Revenue Share (%), by Distribution Channel 2024 & 2032
- Figure 50: Europe US RTD Coffee Industry Volume Share (%), by Distribution Channel 2024 & 2032
- Figure 51: Europe US RTD Coffee Industry Revenue (Million), by Country 2024 & 2032
- Figure 52: Europe US RTD Coffee Industry Volume (K Tons), by Country 2024 & 2032
- Figure 53: Europe US RTD Coffee Industry Revenue Share (%), by Country 2024 & 2032
- Figure 54: Europe US RTD Coffee Industry Volume Share (%), by Country 2024 & 2032
- Figure 55: Middle East & Africa US RTD Coffee Industry Revenue (Million), by Soft Drink Type 2024 & 2032
- Figure 56: Middle East & Africa US RTD Coffee Industry Volume (K Tons), by Soft Drink Type 2024 & 2032
- Figure 57: Middle East & Africa US RTD Coffee Industry Revenue Share (%), by Soft Drink Type 2024 & 2032
- Figure 58: Middle East & Africa US RTD Coffee Industry Volume Share (%), by Soft Drink Type 2024 & 2032
- Figure 59: Middle East & Africa US RTD Coffee Industry Revenue (Million), by Packaging Type 2024 & 2032
- Figure 60: Middle East & Africa US RTD Coffee Industry Volume (K Tons), by Packaging Type 2024 & 2032
- Figure 61: Middle East & Africa US RTD Coffee Industry Revenue Share (%), by Packaging Type 2024 & 2032
- Figure 62: Middle East & Africa US RTD Coffee Industry Volume Share (%), by Packaging Type 2024 & 2032
- Figure 63: Middle East & Africa US RTD Coffee Industry Revenue (Million), by Distribution Channel 2024 & 2032
- Figure 64: Middle East & Africa US RTD Coffee Industry Volume (K Tons), by Distribution Channel 2024 & 2032
- Figure 65: Middle East & Africa US RTD Coffee Industry Revenue Share (%), by Distribution Channel 2024 & 2032
- Figure 66: Middle East & Africa US RTD Coffee Industry Volume Share (%), by Distribution Channel 2024 & 2032
- Figure 67: Middle East & Africa US RTD Coffee Industry Revenue (Million), by Country 2024 & 2032
- Figure 68: Middle East & Africa US RTD Coffee Industry Volume (K Tons), by Country 2024 & 2032
- Figure 69: Middle East & Africa US RTD Coffee Industry Revenue Share (%), by Country 2024 & 2032
- Figure 70: Middle East & Africa US RTD Coffee Industry Volume Share (%), by Country 2024 & 2032
- Figure 71: Asia Pacific US RTD Coffee Industry Revenue (Million), by Soft Drink Type 2024 & 2032
- Figure 72: Asia Pacific US RTD Coffee Industry Volume (K Tons), by Soft Drink Type 2024 & 2032
- Figure 73: Asia Pacific US RTD Coffee Industry Revenue Share (%), by Soft Drink Type 2024 & 2032
- Figure 74: Asia Pacific US RTD Coffee Industry Volume Share (%), by Soft Drink Type 2024 & 2032
- Figure 75: Asia Pacific US RTD Coffee Industry Revenue (Million), by Packaging Type 2024 & 2032
- Figure 76: Asia Pacific US RTD Coffee Industry Volume (K Tons), by Packaging Type 2024 & 2032
- Figure 77: Asia Pacific US RTD Coffee Industry Revenue Share (%), by Packaging Type 2024 & 2032
- Figure 78: Asia Pacific US RTD Coffee Industry Volume Share (%), by Packaging Type 2024 & 2032
- Figure 79: Asia Pacific US RTD Coffee Industry Revenue (Million), by Distribution Channel 2024 & 2032
- Figure 80: Asia Pacific US RTD Coffee Industry Volume (K Tons), by Distribution Channel 2024 & 2032
- Figure 81: Asia Pacific US RTD Coffee Industry Revenue Share (%), by Distribution Channel 2024 & 2032
- Figure 82: Asia Pacific US RTD Coffee Industry Volume Share (%), by Distribution Channel 2024 & 2032
- Figure 83: Asia Pacific US RTD Coffee Industry Revenue (Million), by Country 2024 & 2032
- Figure 84: Asia Pacific US RTD Coffee Industry Volume (K Tons), by Country 2024 & 2032
- Figure 85: Asia Pacific US RTD Coffee Industry Revenue Share (%), by Country 2024 & 2032
- Figure 86: Asia Pacific US RTD Coffee Industry Volume Share (%), by Country 2024 & 2032
List of Tables
- Table 1: Global US RTD Coffee Industry Revenue Million Forecast, by Region 2019 & 2032
- Table 2: Global US RTD Coffee Industry Volume K Tons Forecast, by Region 2019 & 2032
- Table 3: Global US RTD Coffee Industry Revenue Million Forecast, by Soft Drink Type 2019 & 2032
- Table 4: Global US RTD Coffee Industry Volume K Tons Forecast, by Soft Drink Type 2019 & 2032
- Table 5: Global US RTD Coffee Industry Revenue Million Forecast, by Packaging Type 2019 & 2032
- Table 6: Global US RTD Coffee Industry Volume K Tons Forecast, by Packaging Type 2019 & 2032
- Table 7: Global US RTD Coffee Industry Revenue Million Forecast, by Distribution Channel 2019 & 2032
- Table 8: Global US RTD Coffee Industry Volume K Tons Forecast, by Distribution Channel 2019 & 2032
- Table 9: Global US RTD Coffee Industry Revenue Million Forecast, by Region 2019 & 2032
- Table 10: Global US RTD Coffee Industry Volume K Tons Forecast, by Region 2019 & 2032
- Table 11: Global US RTD Coffee Industry Revenue Million Forecast, by Country 2019 & 2032
- Table 12: Global US RTD Coffee Industry Volume K Tons Forecast, by Country 2019 & 2032
- Table 13: Northeast US RTD Coffee Industry Revenue (Million) Forecast, by Application 2019 & 2032
- Table 14: Northeast US RTD Coffee Industry Volume (K Tons) Forecast, by Application 2019 & 2032
- Table 15: Southeast US RTD Coffee Industry Revenue (Million) Forecast, by Application 2019 & 2032
- Table 16: Southeast US RTD Coffee Industry Volume (K Tons) Forecast, by Application 2019 & 2032
- Table 17: Midwest US RTD Coffee Industry Revenue (Million) Forecast, by Application 2019 & 2032
- Table 18: Midwest US RTD Coffee Industry Volume (K Tons) Forecast, by Application 2019 & 2032
- Table 19: Southwest US RTD Coffee Industry Revenue (Million) Forecast, by Application 2019 & 2032
- Table 20: Southwest US RTD Coffee Industry Volume (K Tons) Forecast, by Application 2019 & 2032
- Table 21: West US RTD Coffee Industry Revenue (Million) Forecast, by Application 2019 & 2032
- Table 22: West US RTD Coffee Industry Volume (K Tons) Forecast, by Application 2019 & 2032
- Table 23: Global US RTD Coffee Industry Revenue Million Forecast, by Soft Drink Type 2019 & 2032
- Table 24: Global US RTD Coffee Industry Volume K Tons Forecast, by Soft Drink Type 2019 & 2032
- Table 25: Global US RTD Coffee Industry Revenue Million Forecast, by Packaging Type 2019 & 2032
- Table 26: Global US RTD Coffee Industry Volume K Tons Forecast, by Packaging Type 2019 & 2032
- Table 27: Global US RTD Coffee Industry Revenue Million Forecast, by Distribution Channel 2019 & 2032
- Table 28: Global US RTD Coffee Industry Volume K Tons Forecast, by Distribution Channel 2019 & 2032
- Table 29: Global US RTD Coffee Industry Revenue Million Forecast, by Country 2019 & 2032
- Table 30: Global US RTD Coffee Industry Volume K Tons Forecast, by Country 2019 & 2032
- Table 31: United States US RTD Coffee Industry Revenue (Million) Forecast, by Application 2019 & 2032
- Table 32: United States US RTD Coffee Industry Volume (K Tons) Forecast, by Application 2019 & 2032
- Table 33: Canada US RTD Coffee Industry Revenue (Million) Forecast, by Application 2019 & 2032
- Table 34: Canada US RTD Coffee Industry Volume (K Tons) Forecast, by Application 2019 & 2032
- Table 35: Mexico US RTD Coffee Industry Revenue (Million) Forecast, by Application 2019 & 2032
- Table 36: Mexico US RTD Coffee Industry Volume (K Tons) Forecast, by Application 2019 & 2032
- Table 37: Global US RTD Coffee Industry Revenue Million Forecast, by Soft Drink Type 2019 & 2032
- Table 38: Global US RTD Coffee Industry Volume K Tons Forecast, by Soft Drink Type 2019 & 2032
- Table 39: Global US RTD Coffee Industry Revenue Million Forecast, by Packaging Type 2019 & 2032
- Table 40: Global US RTD Coffee Industry Volume K Tons Forecast, by Packaging Type 2019 & 2032
- Table 41: Global US RTD Coffee Industry Revenue Million Forecast, by Distribution Channel 2019 & 2032
- Table 42: Global US RTD Coffee Industry Volume K Tons Forecast, by Distribution Channel 2019 & 2032
- Table 43: Global US RTD Coffee Industry Revenue Million Forecast, by Country 2019 & 2032
- Table 44: Global US RTD Coffee Industry Volume K Tons Forecast, by Country 2019 & 2032
- Table 45: Brazil US RTD Coffee Industry Revenue (Million) Forecast, by Application 2019 & 2032
- Table 46: Brazil US RTD Coffee Industry Volume (K Tons) Forecast, by Application 2019 & 2032
- Table 47: Argentina US RTD Coffee Industry Revenue (Million) Forecast, by Application 2019 & 2032
- Table 48: Argentina US RTD Coffee Industry Volume (K Tons) Forecast, by Application 2019 & 2032
- Table 49: Rest of South America US RTD Coffee Industry Revenue (Million) Forecast, by Application 2019 & 2032
- Table 50: Rest of South America US RTD Coffee Industry Volume (K Tons) Forecast, by Application 2019 & 2032
- Table 51: Global US RTD Coffee Industry Revenue Million Forecast, by Soft Drink Type 2019 & 2032
- Table 52: Global US RTD Coffee Industry Volume K Tons Forecast, by Soft Drink Type 2019 & 2032
- Table 53: Global US RTD Coffee Industry Revenue Million Forecast, by Packaging Type 2019 & 2032
- Table 54: Global US RTD Coffee Industry Volume K Tons Forecast, by Packaging Type 2019 & 2032
- Table 55: Global US RTD Coffee Industry Revenue Million Forecast, by Distribution Channel 2019 & 2032
- Table 56: Global US RTD Coffee Industry Volume K Tons Forecast, by Distribution Channel 2019 & 2032
- Table 57: Global US RTD Coffee Industry Revenue Million Forecast, by Country 2019 & 2032
- Table 58: Global US RTD Coffee Industry Volume K Tons Forecast, by Country 2019 & 2032
- Table 59: United Kingdom US RTD Coffee Industry Revenue (Million) Forecast, by Application 2019 & 2032
- Table 60: United Kingdom US RTD Coffee Industry Volume (K Tons) Forecast, by Application 2019 & 2032
- Table 61: Germany US RTD Coffee Industry Revenue (Million) Forecast, by Application 2019 & 2032
- Table 62: Germany US RTD Coffee Industry Volume (K Tons) Forecast, by Application 2019 & 2032
- Table 63: France US RTD Coffee Industry Revenue (Million) Forecast, by Application 2019 & 2032
- Table 64: France US RTD Coffee Industry Volume (K Tons) Forecast, by Application 2019 & 2032
- Table 65: Italy US RTD Coffee Industry Revenue (Million) Forecast, by Application 2019 & 2032
- Table 66: Italy US RTD Coffee Industry Volume (K Tons) Forecast, by Application 2019 & 2032
- Table 67: Spain US RTD Coffee Industry Revenue (Million) Forecast, by Application 2019 & 2032
- Table 68: Spain US RTD Coffee Industry Volume (K Tons) Forecast, by Application 2019 & 2032
- Table 69: Russia US RTD Coffee Industry Revenue (Million) Forecast, by Application 2019 & 2032
- Table 70: Russia US RTD Coffee Industry Volume (K Tons) Forecast, by Application 2019 & 2032
- Table 71: Benelux US RTD Coffee Industry Revenue (Million) Forecast, by Application 2019 & 2032
- Table 72: Benelux US RTD Coffee Industry Volume (K Tons) Forecast, by Application 2019 & 2032
- Table 73: Nordics US RTD Coffee Industry Revenue (Million) Forecast, by Application 2019 & 2032
- Table 74: Nordics US RTD Coffee Industry Volume (K Tons) Forecast, by Application 2019 & 2032
- Table 75: Rest of Europe US RTD Coffee Industry Revenue (Million) Forecast, by Application 2019 & 2032
- Table 76: Rest of Europe US RTD Coffee Industry Volume (K Tons) Forecast, by Application 2019 & 2032
- Table 77: Global US RTD Coffee Industry Revenue Million Forecast, by Soft Drink Type 2019 & 2032
- Table 78: Global US RTD Coffee Industry Volume K Tons Forecast, by Soft Drink Type 2019 & 2032
- Table 79: Global US RTD Coffee Industry Revenue Million Forecast, by Packaging Type 2019 & 2032
- Table 80: Global US RTD Coffee Industry Volume K Tons Forecast, by Packaging Type 2019 & 2032
- Table 81: Global US RTD Coffee Industry Revenue Million Forecast, by Distribution Channel 2019 & 2032
- Table 82: Global US RTD Coffee Industry Volume K Tons Forecast, by Distribution Channel 2019 & 2032
- Table 83: Global US RTD Coffee Industry Revenue Million Forecast, by Country 2019 & 2032
- Table 84: Global US RTD Coffee Industry Volume K Tons Forecast, by Country 2019 & 2032
- Table 85: Turkey US RTD Coffee Industry Revenue (Million) Forecast, by Application 2019 & 2032
- Table 86: Turkey US RTD Coffee Industry Volume (K Tons) Forecast, by Application 2019 & 2032
- Table 87: Israel US RTD Coffee Industry Revenue (Million) Forecast, by Application 2019 & 2032
- Table 88: Israel US RTD Coffee Industry Volume (K Tons) Forecast, by Application 2019 & 2032
- Table 89: GCC US RTD Coffee Industry Revenue (Million) Forecast, by Application 2019 & 2032
- Table 90: GCC US RTD Coffee Industry Volume (K Tons) Forecast, by Application 2019 & 2032
- Table 91: North Africa US RTD Coffee Industry Revenue (Million) Forecast, by Application 2019 & 2032
- Table 92: North Africa US RTD Coffee Industry Volume (K Tons) Forecast, by Application 2019 & 2032
- Table 93: South Africa US RTD Coffee Industry Revenue (Million) Forecast, by Application 2019 & 2032
- Table 94: South Africa US RTD Coffee Industry Volume (K Tons) Forecast, by Application 2019 & 2032
- Table 95: Rest of Middle East & Africa US RTD Coffee Industry Revenue (Million) Forecast, by Application 2019 & 2032
- Table 96: Rest of Middle East & Africa US RTD Coffee Industry Volume (K Tons) Forecast, by Application 2019 & 2032
- Table 97: Global US RTD Coffee Industry Revenue Million Forecast, by Soft Drink Type 2019 & 2032
- Table 98: Global US RTD Coffee Industry Volume K Tons Forecast, by Soft Drink Type 2019 & 2032
- Table 99: Global US RTD Coffee Industry Revenue Million Forecast, by Packaging Type 2019 & 2032
- Table 100: Global US RTD Coffee Industry Volume K Tons Forecast, by Packaging Type 2019 & 2032
- Table 101: Global US RTD Coffee Industry Revenue Million Forecast, by Distribution Channel 2019 & 2032
- Table 102: Global US RTD Coffee Industry Volume K Tons Forecast, by Distribution Channel 2019 & 2032
- Table 103: Global US RTD Coffee Industry Revenue Million Forecast, by Country 2019 & 2032
- Table 104: Global US RTD Coffee Industry Volume K Tons Forecast, by Country 2019 & 2032
- Table 105: China US RTD Coffee Industry Revenue (Million) Forecast, by Application 2019 & 2032
- Table 106: China US RTD Coffee Industry Volume (K Tons) Forecast, by Application 2019 & 2032
- Table 107: India US RTD Coffee Industry Revenue (Million) Forecast, by Application 2019 & 2032
- Table 108: India US RTD Coffee Industry Volume (K Tons) Forecast, by Application 2019 & 2032
- Table 109: Japan US RTD Coffee Industry Revenue (Million) Forecast, by Application 2019 & 2032
- Table 110: Japan US RTD Coffee Industry Volume (K Tons) Forecast, by Application 2019 & 2032
- Table 111: South Korea US RTD Coffee Industry Revenue (Million) Forecast, by Application 2019 & 2032
- Table 112: South Korea US RTD Coffee Industry Volume (K Tons) Forecast, by Application 2019 & 2032
- Table 113: ASEAN US RTD Coffee Industry Revenue (Million) Forecast, by Application 2019 & 2032
- Table 114: ASEAN US RTD Coffee Industry Volume (K Tons) Forecast, by Application 2019 & 2032
- Table 115: Oceania US RTD Coffee Industry Revenue (Million) Forecast, by Application 2019 & 2032
- Table 116: Oceania US RTD Coffee Industry Volume (K Tons) Forecast, by Application 2019 & 2032
- Table 117: Rest of Asia Pacific US RTD Coffee Industry Revenue (Million) Forecast, by Application 2019 & 2032
- Table 118: Rest of Asia Pacific US RTD Coffee Industry Volume (K Tons) Forecast, by Application 2019 & 2032
Frequently Asked Questions
1. What is the projected Compound Annual Growth Rate (CAGR) of the US RTD Coffee Industry?
The projected CAGR is approximately 1.50%.
2. Which companies are prominent players in the US RTD Coffee Industry?
Key companies in the market include Peak Rock Capital LLC, Nestle S A, Costco Wholesale Corporation, Califia Farms LLC, La Colombe Holdings Inc, BRC Inc, PepsiCo Inc, The Coca-Cola Compan, The Central America Bottling Corporation, Luigi Lavazza S p A, Keurig Dr Pepper Inc, Danone S A, Chamberlain Coffee Inc.
3. What are the main segments of the US RTD Coffee Industry?
The market segments include Soft Drink Type, Packaging Type, Distribution Channel.
4. Can you provide details about the market size?
The market size is estimated to be USD 5200 Million as of 2022.
5. What are some drivers contributing to market growth?
Increasing demand for meat alternatives.
6. What are the notable trends driving market growth?
OTHER KEY INDUSTRY TRENDS COVERED IN THE REPORT.
7. Are there any restraints impacting market growth?
Presence of numerous alternatives in the plant proteins.
8. Can you provide examples of recent developments in the market?
July 2023: Keurig Dr. Pepper Inc. announced a strategic partnership with La Colombe, including a long-term sales and distribution agreement for La Colombe's ready-to-drink coffee. Keurig Dr Pepper will also make an equity investment in La Colombe, enabling KDP to participate in the value creation upside expected from the partnership.April 2023: Chamberlain Coffee, in collaboration with Walmart, rolled out a new line of plant-based cold brew lattes, ready to drink (RTD) and conveniently available at Walmart stores.February 2023: Danone North America planned to invest up to USD 65 million over the next two years to increase ready-to-drink (RTD) coffee and creamer and oat milk production in the US. The investment will cover several of Danone's coffee brands, including coffee creamer International Delight, oat milk brand Silk, and cold brew range SToK.
9. What pricing options are available for accessing the report?
Pricing options include single-user, multi-user, and enterprise licenses priced at USD 3800, USD 4500, and USD 5800 respectively.
10. Is the market size provided in terms of value or volume?
The market size is provided in terms of value, measured in Million and volume, measured in K Tons.
11. Are there any specific market keywords associated with the report?
Yes, the market keyword associated with the report is "US RTD Coffee Industry," which aids in identifying and referencing the specific market segment covered.
12. How do I determine which pricing option suits my needs best?
The pricing options vary based on user requirements and access needs. Individual users may opt for single-user licenses, while businesses requiring broader access may choose multi-user or enterprise licenses for cost-effective access to the report.
13. Are there any additional resources or data provided in the US RTD Coffee Industry report?
While the report offers comprehensive insights, it's advisable to review the specific contents or supplementary materials provided to ascertain if additional resources or data are available.
14. How can I stay updated on further developments or reports in the US RTD Coffee Industry?
To stay informed about further developments, trends, and reports in the US RTD Coffee Industry, consider subscribing to industry newsletters, following relevant companies and organizations, or regularly checking reputable industry news sources and publications.
Methodology
Step 1 - Identification of Relevant Samples Size from Population Database


Step 2 - Approaches for Defining Global Market Size (Value, Volume* & Price*)

Note*: In applicable scenarios
Step 3 - Data Sources
Primary Research
- Web Analytics
- Survey Reports
- Research Institute
- Latest Research Reports
- Opinion Leaders
Secondary Research
- Annual Reports
- White Paper
- Latest Press Release
- Industry Association
- Paid Database
- Investor Presentations

Step 4 - Data Triangulation
Involves using different sources of information in order to increase the validity of a study
These sources are likely to be stakeholders in a program - participants, other researchers, program staff, other community members, and so on.
Then we put all data in single framework & apply various statistical tools to find out the dynamic on the market.
During the analysis stage, feedback from the stakeholder groups would be compared to determine areas of agreement as well as areas of divergence


