
Key Insights
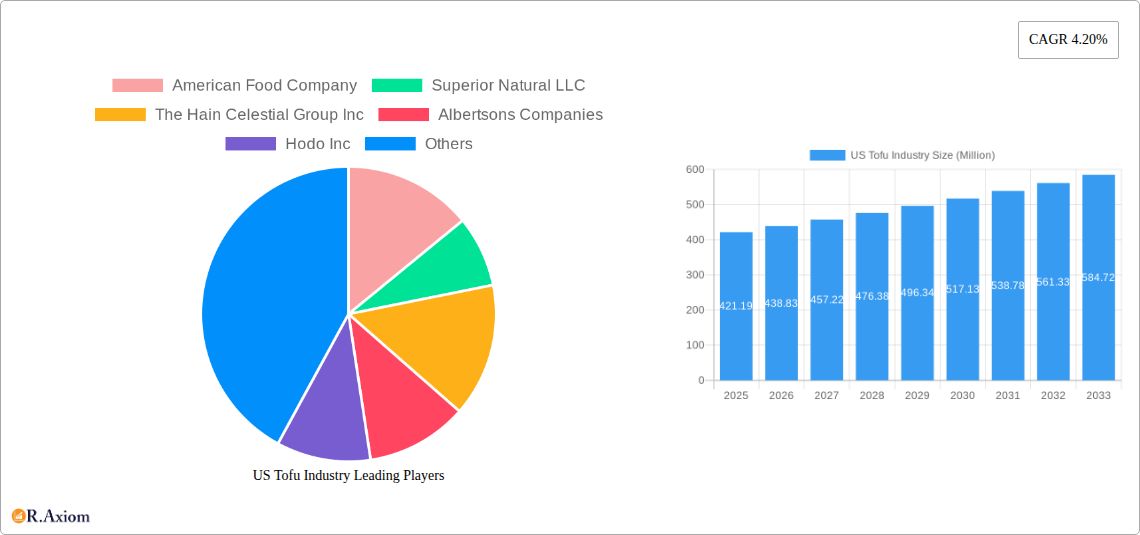
The US tofu market, valued at $421.19 million in 2025, is projected to experience steady growth, exhibiting a Compound Annual Growth Rate (CAGR) of 4.20% from 2025 to 2033. This growth is fueled by several key factors. The increasing popularity of plant-based diets and veganism among health-conscious consumers significantly drives demand. Consumers are actively seeking protein alternatives with lower environmental impact compared to traditional meat sources. Furthermore, the rising awareness of the health benefits of soy, including its high protein and isoflavone content, contributes to tofu's appeal. The market segmentation reveals a robust on-trade sector (restaurants, food service) alongside a substantial off-trade channel (grocery stores, retail). Major players like American Food Company, Superior Natural LLC, and The Hain Celestial Group Inc. are key contributors to market share, indicating a competitive landscape with established brands. Regional analysis reveals varied demand across the United States, with potential for growth in all regions, particularly fueled by targeted marketing campaigns focusing on health and sustainability.
The growth trajectory of the US tofu market from 2025 to 2033 suggests promising opportunities for existing players and new entrants. However, potential restraints include price fluctuations in soy commodities and consumer perceptions about tofu’s taste and versatility. Innovation in tofu-based products, such as ready-to-eat meals, innovative textures and flavors, and expansion into niche markets (e.g., organic and non-GMO tofu) are crucial for sustained growth. The industry will likely witness increased competition and a focus on product differentiation to cater to the evolving demands of health-conscious and environmentally aware consumers. Understanding regional preferences and leveraging effective distribution channels will be vital for achieving success in this dynamic market.
US Tofu Industry: A Comprehensive Market Report (2019-2033)
This detailed report provides a comprehensive analysis of the US Tofu industry, covering market size, segmentation, key players, growth drivers, challenges, and future opportunities. The study period spans from 2019 to 2033, with 2025 serving as the base and estimated year. The report leverages extensive primary and secondary research to offer actionable insights for industry stakeholders, including manufacturers, distributors, investors, and researchers. The market is valued at xx Million in 2025 and is projected to reach xx Million by 2033, exhibiting a CAGR of xx% during the forecast period (2025-2033).
US Tofu Industry Market Concentration & Innovation
The US tofu market exhibits a moderately concentrated structure, with a few major players holding significant market share. American Food Company, Superior Natural LLC, The Hain Celestial Group Inc, and Albertsons Companies are among the leading players, collectively controlling approximately xx% of the market in 2025. However, the presence of several smaller regional and specialty brands indicates a competitive landscape. Innovation is driven by consumer demand for diverse flavors, textures, and functional benefits. Product development focuses on organic, non-GMO, and plant-based options catering to health-conscious consumers. Recent M&A activities, such as Morinaga Nutritional Foods' acquisition of Tofurky in February 2023, highlight the strategic importance of consolidating market share and strengthening supply chains. This deal, valued at xx Million, signifies a growing trend toward consolidation within the industry. Regulatory frameworks concerning food labeling and safety standards significantly impact the market. The rise of plant-based diets and growing awareness of the health benefits of tofu create a favorable environment for market growth. Substitutes like soy milk and other plant-based proteins pose some competitive pressure but also indicate the growing appeal of plant-based alternatives.
- Market Share (2025): American Food Company (xx%), Superior Natural LLC (xx%), The Hain Celestial Group Inc (xx%), Albertsons Companies (xx%), Others (xx%).
- M&A Deal Value (2023): Morinaga Nutritional Foods acquisition of Tofurky and Moocho – xx Million.
- Key Innovation Drivers: Health-conscious consumers, diverse flavor profiles, and functional benefits.
US Tofu Industry Industry Trends & Insights
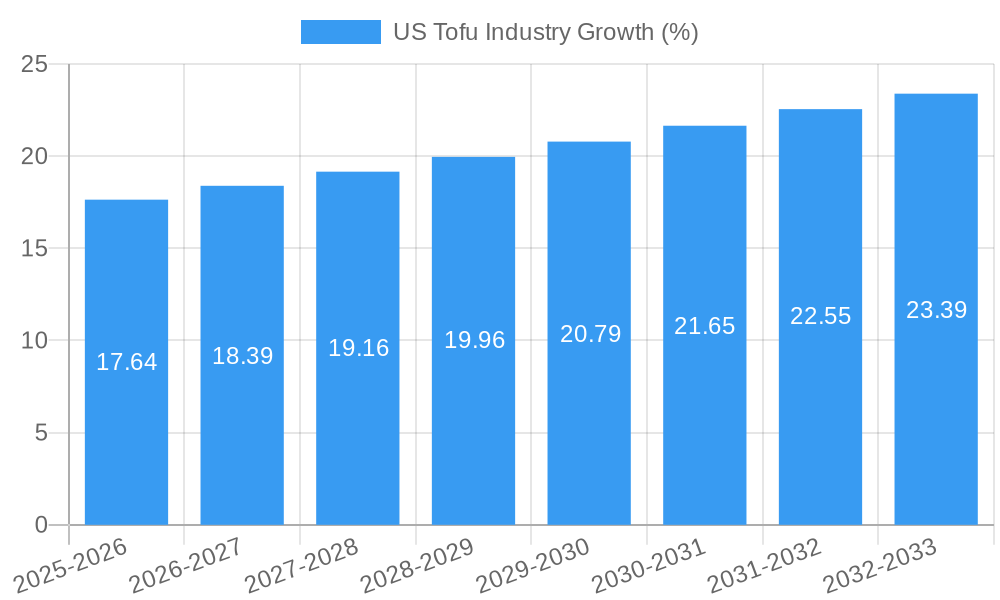
The US tofu market is experiencing robust growth, fueled by several key factors. The increasing adoption of plant-based diets and flexitarianism is a significant driver, with consumers increasingly seeking alternatives to animal protein. The rising awareness of tofu's health benefits, including its high protein content and nutritional value, further boosts demand. Technological advancements in tofu production are enhancing efficiency and lowering costs, making the product more accessible to a wider consumer base. Consumer preferences are shifting toward organic, non-GMO, and sustainably sourced tofu, presenting opportunities for brands that align with these values. Competitive dynamics are characterized by both large established players and smaller, specialized brands, leading to a diverse range of products and price points. The market exhibits a strong potential for growth, particularly in segments such as organic and specialty tofu. The CAGR for the period 2019-2024 is estimated at xx%, indicating a significant expansion of the market. Market penetration in key demographics, such as millennials and Gen Z, is also steadily increasing, showing the growing acceptance of tofu as a versatile and convenient protein source.
Dominant Markets & Segments in US Tofu Industry
The dominant segment within the US Tofu industry in 2025 is the Off-Trade distribution channel, accounting for approximately xx% of the total market value. This reflects the widespread availability of tofu in supermarkets, grocery stores, and other retail outlets. The On-Trade segment, representing the foodservice and restaurant sector, holds a smaller market share (xx%) but presents significant growth potential.
Off-Trade Dominance Drivers:
- Widespread retail availability.
- Convenience and accessibility for consumers.
- Established distribution networks.
On-Trade Growth Potential:
- Increasing demand from restaurants and foodservice establishments offering plant-based options.
- Opportunities for customized tofu products tailored to specific culinary applications.
- Expanding vegan and vegetarian menus in restaurants.
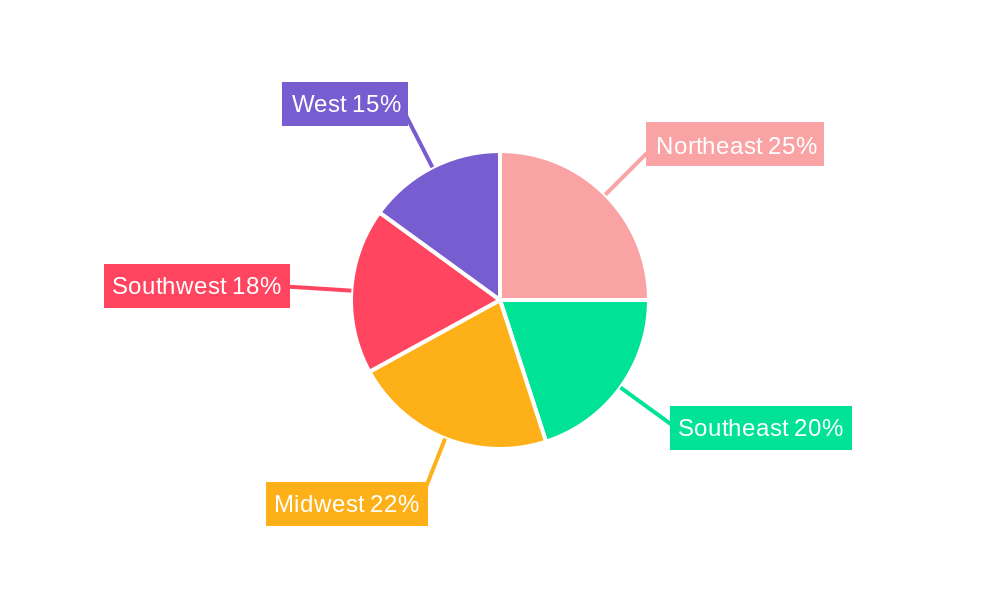
The Western region of the US shows the highest consumption rate and market share in 2025 due to factors such as higher disposable incomes, a greater prevalence of health-conscious consumers, and a high concentration of vegetarian and vegan populations.
US Tofu Industry Product Developments
Recent product innovations in the US tofu market showcase a trend toward offering diverse flavor profiles and convenient formats. Hodo’s launch of Miso Tofu and Indian Spiced Tofu in March 2023 exemplifies this trend, catering to evolving consumer tastes. Morinaga's introduction of Yuzu Flavored Silken Tofu in June 2022 highlights the expansion into premium and specialty tofu varieties. These developments are driven by technological advancements in tofu processing and a greater understanding of consumer preferences. The focus is shifting toward offering unique flavors and textures to increase appeal and versatility in culinary applications.
Report Scope & Segmentation Analysis
This report segments the US tofu market based on distribution channel (Off-Trade and On-Trade) and product type (silken, firm, extra-firm, etc.). The Off-Trade channel, representing sales through retail outlets, is projected to dominate the market throughout the forecast period, with a xx% share in 2025 and steady growth expected. The On-Trade segment, catering to foodservice, is expected to experience moderate growth, driven by the increasing adoption of plant-based menus in restaurants. Growth projections for each segment are based on current market trends, consumer behavior analysis, and expert insights. Competitive dynamics within each segment vary, with established players dominating the Off-Trade channel while smaller, specialized brands find opportunities in the On-Trade segment.
Key Drivers of US Tofu Industry Growth
Several key factors are driving the growth of the US tofu industry. The growing adoption of plant-based diets, fueled by health and environmental concerns, is a major driver. Technological innovations in tofu production are increasing efficiency and reducing costs. Favorable regulatory frameworks, supporting the growth of the plant-based food sector, further contribute to market expansion. Finally, increasing consumer awareness of tofu's nutritional benefits and versatility is driving demand. These factors combine to create a positive outlook for the US tofu market.
Challenges in the US Tofu Industry Sector
The US tofu industry faces several challenges, including fluctuations in the price of soybeans, a key ingredient in tofu production. Intense competition from other plant-based protein sources, like tempeh and seitan, also presents a challenge. Maintaining a consistent supply chain is crucial, and disruptions can impact production and sales. Furthermore, educating consumers about the versatility and nutritional benefits of tofu remains an important ongoing effort.
Emerging Opportunities in US Tofu Industry
Emerging opportunities in the US tofu industry include the development of innovative tofu-based products, including ready-to-eat meals and snacks. Expanding into new markets and distribution channels, such as online retail and direct-to-consumer sales, provides significant potential. Collaborations with food influencers and chefs to promote tofu's versatility can increase its appeal among consumers. Finally, emphasizing sustainability and eco-friendly production practices will attract environmentally conscious consumers.
Leading Players in the US Tofu Industry Market
- American Food Company
- Superior Natural LLC
- The Hain Celestial Group Inc (The Hain Celestial Group Inc)
- Albertsons Companies (Albertsons Companies)
- Hodo Inc (Hodo Inc)
- Pulmuone Corporate
- House Foods Group Inc (House Foods Group Inc)
- Morinaga Milk Industry Co Ltd (Morinaga Milk Industry Co Ltd)
Key Developments in US Tofu Industry Industry
- June 2022: Morinaga Nutritional Foods launched Mori-Nu Yuzu Flavored Silken Tofu.
- February 2023: Morinaga Nutritional Foods acquired Tofurky and Moocho.
- March 2023: Hodo launched Miso Tofu and Indian Spiced Tofu.
Strategic Outlook for US Tofu Industry Market
The US tofu market presents significant growth potential driven by the continued rise of plant-based diets and increasing consumer demand for healthy and convenient food options. Strategic investments in product innovation, sustainable sourcing, and effective marketing will be crucial for success. Expansion into new markets and channels, coupled with a focus on building strong brand awareness, will be key to capturing market share and achieving long-term growth. The future of the US tofu industry is bright, with substantial opportunities for companies that can adapt to evolving consumer preferences and technological advancements.
US Tofu Industry Segmentation
-
1. Distribution Channel
-
1.1. Off-Trade
- 1.1.1. Convenience Stores
- 1.1.2. Online Channel
- 1.1.3. Supermarkets and Hypermarkets
- 1.1.4. Others
- 1.2. On-Trade
-
1.1. Off-Trade
US Tofu Industry Segmentation By Geography
-
1. North America
- 1.1. United States
- 1.2. Canada
- 1.3. Mexico
-
2. South America
- 2.1. Brazil
- 2.2. Argentina
- 2.3. Rest of South America
-
3. Europe
- 3.1. United Kingdom
- 3.2. Germany
- 3.3. France
- 3.4. Italy
- 3.5. Spain
- 3.6. Russia
- 3.7. Benelux
- 3.8. Nordics
- 3.9. Rest of Europe
-
4. Middle East & Africa
- 4.1. Turkey
- 4.2. Israel
- 4.3. GCC
- 4.4. North Africa
- 4.5. South Africa
- 4.6. Rest of Middle East & Africa
-
5. Asia Pacific
- 5.1. China
- 5.2. India
- 5.3. Japan
- 5.4. South Korea
- 5.5. ASEAN
- 5.6. Oceania
- 5.7. Rest of Asia Pacific
US Tofu Industry REPORT HIGHLIGHTS
| Aspects | Details |
|---|---|
| Study Period | 2019-2033 |
| Base Year | 2024 |
| Estimated Year | 2025 |
| Forecast Period | 2025-2033 |
| Historical Period | 2019-2024 |
| Growth Rate | CAGR of 4.20% from 2019-2033 |
| Segmentation |
|
Table of Contents
- 1. Introduction
- 1.1. Research Scope
- 1.2. Market Segmentation
- 1.3. Research Methodology
- 1.4. Definitions and Assumptions
- 2. Executive Summary
- 2.1. Introduction
- 3. Market Dynamics
- 3.1. Introduction
- 3.2. Market Drivers
- 3.2.1. Escalating Demand for Processed Poultry Products; Favorable Government Initiatives to Boost Production
- 3.3. Market Restrains
- 3.3.1. Rising Vegan Trend among Young Consumers; Deeper Penetration of Red Meat Across Saudi Arabia
- 3.4. Market Trends
- 3.4.1. Increasing demand for new variants in the tofu market through the expanded e-commerce channels drives the market
- 4. Market Factor Analysis
- 4.1. Porters Five Forces
- 4.2. Supply/Value Chain
- 4.3. PESTEL analysis
- 4.4. Market Entropy
- 4.5. Patent/Trademark Analysis
- 5. Global US Tofu Industry Analysis, Insights and Forecast, 2019-2031
- 5.1. Market Analysis, Insights and Forecast - by Distribution Channel
- 5.1.1. Off-Trade
- 5.1.1.1. Convenience Stores
- 5.1.1.2. Online Channel
- 5.1.1.3. Supermarkets and Hypermarkets
- 5.1.1.4. Others
- 5.1.2. On-Trade
- 5.1.1. Off-Trade
- 5.2. Market Analysis, Insights and Forecast - by Region
- 5.2.1. North America
- 5.2.2. South America
- 5.2.3. Europe
- 5.2.4. Middle East & Africa
- 5.2.5. Asia Pacific
- 5.1. Market Analysis, Insights and Forecast - by Distribution Channel
- 6. North America US Tofu Industry Analysis, Insights and Forecast, 2019-2031
- 6.1. Market Analysis, Insights and Forecast - by Distribution Channel
- 6.1.1. Off-Trade
- 6.1.1.1. Convenience Stores
- 6.1.1.2. Online Channel
- 6.1.1.3. Supermarkets and Hypermarkets
- 6.1.1.4. Others
- 6.1.2. On-Trade
- 6.1.1. Off-Trade
- 6.1. Market Analysis, Insights and Forecast - by Distribution Channel
- 7. South America US Tofu Industry Analysis, Insights and Forecast, 2019-2031
- 7.1. Market Analysis, Insights and Forecast - by Distribution Channel
- 7.1.1. Off-Trade
- 7.1.1.1. Convenience Stores
- 7.1.1.2. Online Channel
- 7.1.1.3. Supermarkets and Hypermarkets
- 7.1.1.4. Others
- 7.1.2. On-Trade
- 7.1.1. Off-Trade
- 7.1. Market Analysis, Insights and Forecast - by Distribution Channel
- 8. Europe US Tofu Industry Analysis, Insights and Forecast, 2019-2031
- 8.1. Market Analysis, Insights and Forecast - by Distribution Channel
- 8.1.1. Off-Trade
- 8.1.1.1. Convenience Stores
- 8.1.1.2. Online Channel
- 8.1.1.3. Supermarkets and Hypermarkets
- 8.1.1.4. Others
- 8.1.2. On-Trade
- 8.1.1. Off-Trade
- 8.1. Market Analysis, Insights and Forecast - by Distribution Channel
- 9. Middle East & Africa US Tofu Industry Analysis, Insights and Forecast, 2019-2031
- 9.1. Market Analysis, Insights and Forecast - by Distribution Channel
- 9.1.1. Off-Trade
- 9.1.1.1. Convenience Stores
- 9.1.1.2. Online Channel
- 9.1.1.3. Supermarkets and Hypermarkets
- 9.1.1.4. Others
- 9.1.2. On-Trade
- 9.1.1. Off-Trade
- 9.1. Market Analysis, Insights and Forecast - by Distribution Channel
- 10. Asia Pacific US Tofu Industry Analysis, Insights and Forecast, 2019-2031
- 10.1. Market Analysis, Insights and Forecast - by Distribution Channel
- 10.1.1. Off-Trade
- 10.1.1.1. Convenience Stores
- 10.1.1.2. Online Channel
- 10.1.1.3. Supermarkets and Hypermarkets
- 10.1.1.4. Others
- 10.1.2. On-Trade
- 10.1.1. Off-Trade
- 10.1. Market Analysis, Insights and Forecast - by Distribution Channel
- 11. Northeast US Tofu Industry Analysis, Insights and Forecast, 2019-2031
- 12. Southeast US Tofu Industry Analysis, Insights and Forecast, 2019-2031
- 13. Midwest US Tofu Industry Analysis, Insights and Forecast, 2019-2031
- 14. Southwest US Tofu Industry Analysis, Insights and Forecast, 2019-2031
- 15. West US Tofu Industry Analysis, Insights and Forecast, 2019-2031
- 16. Competitive Analysis
- 16.1. Global Market Share Analysis 2024
- 16.2. Company Profiles
- 16.2.1 American Food Company
- 16.2.1.1. Overview
- 16.2.1.2. Products
- 16.2.1.3. SWOT Analysis
- 16.2.1.4. Recent Developments
- 16.2.1.5. Financials (Based on Availability)
- 16.2.2 Superior Natural LLC
- 16.2.2.1. Overview
- 16.2.2.2. Products
- 16.2.2.3. SWOT Analysis
- 16.2.2.4. Recent Developments
- 16.2.2.5. Financials (Based on Availability)
- 16.2.3 The Hain Celestial Group Inc
- 16.2.3.1. Overview
- 16.2.3.2. Products
- 16.2.3.3. SWOT Analysis
- 16.2.3.4. Recent Developments
- 16.2.3.5. Financials (Based on Availability)
- 16.2.4 Albertsons Companies
- 16.2.4.1. Overview
- 16.2.4.2. Products
- 16.2.4.3. SWOT Analysis
- 16.2.4.4. Recent Developments
- 16.2.4.5. Financials (Based on Availability)
- 16.2.5 Hodo Inc
- 16.2.5.1. Overview
- 16.2.5.2. Products
- 16.2.5.3. SWOT Analysis
- 16.2.5.4. Recent Developments
- 16.2.5.5. Financials (Based on Availability)
- 16.2.6 Pulmuone Corporate
- 16.2.6.1. Overview
- 16.2.6.2. Products
- 16.2.6.3. SWOT Analysis
- 16.2.6.4. Recent Developments
- 16.2.6.5. Financials (Based on Availability)
- 16.2.7 House Foods Group Inc
- 16.2.7.1. Overview
- 16.2.7.2. Products
- 16.2.7.3. SWOT Analysis
- 16.2.7.4. Recent Developments
- 16.2.7.5. Financials (Based on Availability)
- 16.2.8 Morinaga Milk Industry Co Ltd
- 16.2.8.1. Overview
- 16.2.8.2. Products
- 16.2.8.3. SWOT Analysis
- 16.2.8.4. Recent Developments
- 16.2.8.5. Financials (Based on Availability)
- 16.2.1 American Food Company
List of Figures
- Figure 1: Global US Tofu Industry Revenue Breakdown (Million, %) by Region 2024 & 2032
- Figure 2: Global US Tofu Industry Volume Breakdown (K Tons, %) by Region 2024 & 2032
- Figure 3: United states US Tofu Industry Revenue (Million), by Country 2024 & 2032
- Figure 4: United states US Tofu Industry Volume (K Tons), by Country 2024 & 2032
- Figure 5: United states US Tofu Industry Revenue Share (%), by Country 2024 & 2032
- Figure 6: United states US Tofu Industry Volume Share (%), by Country 2024 & 2032
- Figure 7: North America US Tofu Industry Revenue (Million), by Distribution Channel 2024 & 2032
- Figure 8: North America US Tofu Industry Volume (K Tons), by Distribution Channel 2024 & 2032
- Figure 9: North America US Tofu Industry Revenue Share (%), by Distribution Channel 2024 & 2032
- Figure 10: North America US Tofu Industry Volume Share (%), by Distribution Channel 2024 & 2032
- Figure 11: North America US Tofu Industry Revenue (Million), by Country 2024 & 2032
- Figure 12: North America US Tofu Industry Volume (K Tons), by Country 2024 & 2032
- Figure 13: North America US Tofu Industry Revenue Share (%), by Country 2024 & 2032
- Figure 14: North America US Tofu Industry Volume Share (%), by Country 2024 & 2032
- Figure 15: South America US Tofu Industry Revenue (Million), by Distribution Channel 2024 & 2032
- Figure 16: South America US Tofu Industry Volume (K Tons), by Distribution Channel 2024 & 2032
- Figure 17: South America US Tofu Industry Revenue Share (%), by Distribution Channel 2024 & 2032
- Figure 18: South America US Tofu Industry Volume Share (%), by Distribution Channel 2024 & 2032
- Figure 19: South America US Tofu Industry Revenue (Million), by Country 2024 & 2032
- Figure 20: South America US Tofu Industry Volume (K Tons), by Country 2024 & 2032
- Figure 21: South America US Tofu Industry Revenue Share (%), by Country 2024 & 2032
- Figure 22: South America US Tofu Industry Volume Share (%), by Country 2024 & 2032
- Figure 23: Europe US Tofu Industry Revenue (Million), by Distribution Channel 2024 & 2032
- Figure 24: Europe US Tofu Industry Volume (K Tons), by Distribution Channel 2024 & 2032
- Figure 25: Europe US Tofu Industry Revenue Share (%), by Distribution Channel 2024 & 2032
- Figure 26: Europe US Tofu Industry Volume Share (%), by Distribution Channel 2024 & 2032
- Figure 27: Europe US Tofu Industry Revenue (Million), by Country 2024 & 2032
- Figure 28: Europe US Tofu Industry Volume (K Tons), by Country 2024 & 2032
- Figure 29: Europe US Tofu Industry Revenue Share (%), by Country 2024 & 2032
- Figure 30: Europe US Tofu Industry Volume Share (%), by Country 2024 & 2032
- Figure 31: Middle East & Africa US Tofu Industry Revenue (Million), by Distribution Channel 2024 & 2032
- Figure 32: Middle East & Africa US Tofu Industry Volume (K Tons), by Distribution Channel 2024 & 2032
- Figure 33: Middle East & Africa US Tofu Industry Revenue Share (%), by Distribution Channel 2024 & 2032
- Figure 34: Middle East & Africa US Tofu Industry Volume Share (%), by Distribution Channel 2024 & 2032
- Figure 35: Middle East & Africa US Tofu Industry Revenue (Million), by Country 2024 & 2032
- Figure 36: Middle East & Africa US Tofu Industry Volume (K Tons), by Country 2024 & 2032
- Figure 37: Middle East & Africa US Tofu Industry Revenue Share (%), by Country 2024 & 2032
- Figure 38: Middle East & Africa US Tofu Industry Volume Share (%), by Country 2024 & 2032
- Figure 39: Asia Pacific US Tofu Industry Revenue (Million), by Distribution Channel 2024 & 2032
- Figure 40: Asia Pacific US Tofu Industry Volume (K Tons), by Distribution Channel 2024 & 2032
- Figure 41: Asia Pacific US Tofu Industry Revenue Share (%), by Distribution Channel 2024 & 2032
- Figure 42: Asia Pacific US Tofu Industry Volume Share (%), by Distribution Channel 2024 & 2032
- Figure 43: Asia Pacific US Tofu Industry Revenue (Million), by Country 2024 & 2032
- Figure 44: Asia Pacific US Tofu Industry Volume (K Tons), by Country 2024 & 2032
- Figure 45: Asia Pacific US Tofu Industry Revenue Share (%), by Country 2024 & 2032
- Figure 46: Asia Pacific US Tofu Industry Volume Share (%), by Country 2024 & 2032
List of Tables
- Table 1: Global US Tofu Industry Revenue Million Forecast, by Region 2019 & 2032
- Table 2: Global US Tofu Industry Volume K Tons Forecast, by Region 2019 & 2032
- Table 3: Global US Tofu Industry Revenue Million Forecast, by Distribution Channel 2019 & 2032
- Table 4: Global US Tofu Industry Volume K Tons Forecast, by Distribution Channel 2019 & 2032
- Table 5: Global US Tofu Industry Revenue Million Forecast, by Region 2019 & 2032
- Table 6: Global US Tofu Industry Volume K Tons Forecast, by Region 2019 & 2032
- Table 7: Global US Tofu Industry Revenue Million Forecast, by Country 2019 & 2032
- Table 8: Global US Tofu Industry Volume K Tons Forecast, by Country 2019 & 2032
- Table 9: Northeast US Tofu Industry Revenue (Million) Forecast, by Application 2019 & 2032
- Table 10: Northeast US Tofu Industry Volume (K Tons) Forecast, by Application 2019 & 2032
- Table 11: Southeast US Tofu Industry Revenue (Million) Forecast, by Application 2019 & 2032
- Table 12: Southeast US Tofu Industry Volume (K Tons) Forecast, by Application 2019 & 2032
- Table 13: Midwest US Tofu Industry Revenue (Million) Forecast, by Application 2019 & 2032
- Table 14: Midwest US Tofu Industry Volume (K Tons) Forecast, by Application 2019 & 2032
- Table 15: Southwest US Tofu Industry Revenue (Million) Forecast, by Application 2019 & 2032
- Table 16: Southwest US Tofu Industry Volume (K Tons) Forecast, by Application 2019 & 2032
- Table 17: West US Tofu Industry Revenue (Million) Forecast, by Application 2019 & 2032
- Table 18: West US Tofu Industry Volume (K Tons) Forecast, by Application 2019 & 2032
- Table 19: Global US Tofu Industry Revenue Million Forecast, by Distribution Channel 2019 & 2032
- Table 20: Global US Tofu Industry Volume K Tons Forecast, by Distribution Channel 2019 & 2032
- Table 21: Global US Tofu Industry Revenue Million Forecast, by Country 2019 & 2032
- Table 22: Global US Tofu Industry Volume K Tons Forecast, by Country 2019 & 2032
- Table 23: United States US Tofu Industry Revenue (Million) Forecast, by Application 2019 & 2032
- Table 24: United States US Tofu Industry Volume (K Tons) Forecast, by Application 2019 & 2032
- Table 25: Canada US Tofu Industry Revenue (Million) Forecast, by Application 2019 & 2032
- Table 26: Canada US Tofu Industry Volume (K Tons) Forecast, by Application 2019 & 2032
- Table 27: Mexico US Tofu Industry Revenue (Million) Forecast, by Application 2019 & 2032
- Table 28: Mexico US Tofu Industry Volume (K Tons) Forecast, by Application 2019 & 2032
- Table 29: Global US Tofu Industry Revenue Million Forecast, by Distribution Channel 2019 & 2032
- Table 30: Global US Tofu Industry Volume K Tons Forecast, by Distribution Channel 2019 & 2032
- Table 31: Global US Tofu Industry Revenue Million Forecast, by Country 2019 & 2032
- Table 32: Global US Tofu Industry Volume K Tons Forecast, by Country 2019 & 2032
- Table 33: Brazil US Tofu Industry Revenue (Million) Forecast, by Application 2019 & 2032
- Table 34: Brazil US Tofu Industry Volume (K Tons) Forecast, by Application 2019 & 2032
- Table 35: Argentina US Tofu Industry Revenue (Million) Forecast, by Application 2019 & 2032
- Table 36: Argentina US Tofu Industry Volume (K Tons) Forecast, by Application 2019 & 2032
- Table 37: Rest of South America US Tofu Industry Revenue (Million) Forecast, by Application 2019 & 2032
- Table 38: Rest of South America US Tofu Industry Volume (K Tons) Forecast, by Application 2019 & 2032
- Table 39: Global US Tofu Industry Revenue Million Forecast, by Distribution Channel 2019 & 2032
- Table 40: Global US Tofu Industry Volume K Tons Forecast, by Distribution Channel 2019 & 2032
- Table 41: Global US Tofu Industry Revenue Million Forecast, by Country 2019 & 2032
- Table 42: Global US Tofu Industry Volume K Tons Forecast, by Country 2019 & 2032
- Table 43: United Kingdom US Tofu Industry Revenue (Million) Forecast, by Application 2019 & 2032
- Table 44: United Kingdom US Tofu Industry Volume (K Tons) Forecast, by Application 2019 & 2032
- Table 45: Germany US Tofu Industry Revenue (Million) Forecast, by Application 2019 & 2032
- Table 46: Germany US Tofu Industry Volume (K Tons) Forecast, by Application 2019 & 2032
- Table 47: France US Tofu Industry Revenue (Million) Forecast, by Application 2019 & 2032
- Table 48: France US Tofu Industry Volume (K Tons) Forecast, by Application 2019 & 2032
- Table 49: Italy US Tofu Industry Revenue (Million) Forecast, by Application 2019 & 2032
- Table 50: Italy US Tofu Industry Volume (K Tons) Forecast, by Application 2019 & 2032
- Table 51: Spain US Tofu Industry Revenue (Million) Forecast, by Application 2019 & 2032
- Table 52: Spain US Tofu Industry Volume (K Tons) Forecast, by Application 2019 & 2032
- Table 53: Russia US Tofu Industry Revenue (Million) Forecast, by Application 2019 & 2032
- Table 54: Russia US Tofu Industry Volume (K Tons) Forecast, by Application 2019 & 2032
- Table 55: Benelux US Tofu Industry Revenue (Million) Forecast, by Application 2019 & 2032
- Table 56: Benelux US Tofu Industry Volume (K Tons) Forecast, by Application 2019 & 2032
- Table 57: Nordics US Tofu Industry Revenue (Million) Forecast, by Application 2019 & 2032
- Table 58: Nordics US Tofu Industry Volume (K Tons) Forecast, by Application 2019 & 2032
- Table 59: Rest of Europe US Tofu Industry Revenue (Million) Forecast, by Application 2019 & 2032
- Table 60: Rest of Europe US Tofu Industry Volume (K Tons) Forecast, by Application 2019 & 2032
- Table 61: Global US Tofu Industry Revenue Million Forecast, by Distribution Channel 2019 & 2032
- Table 62: Global US Tofu Industry Volume K Tons Forecast, by Distribution Channel 2019 & 2032
- Table 63: Global US Tofu Industry Revenue Million Forecast, by Country 2019 & 2032
- Table 64: Global US Tofu Industry Volume K Tons Forecast, by Country 2019 & 2032
- Table 65: Turkey US Tofu Industry Revenue (Million) Forecast, by Application 2019 & 2032
- Table 66: Turkey US Tofu Industry Volume (K Tons) Forecast, by Application 2019 & 2032
- Table 67: Israel US Tofu Industry Revenue (Million) Forecast, by Application 2019 & 2032
- Table 68: Israel US Tofu Industry Volume (K Tons) Forecast, by Application 2019 & 2032
- Table 69: GCC US Tofu Industry Revenue (Million) Forecast, by Application 2019 & 2032
- Table 70: GCC US Tofu Industry Volume (K Tons) Forecast, by Application 2019 & 2032
- Table 71: North Africa US Tofu Industry Revenue (Million) Forecast, by Application 2019 & 2032
- Table 72: North Africa US Tofu Industry Volume (K Tons) Forecast, by Application 2019 & 2032
- Table 73: South Africa US Tofu Industry Revenue (Million) Forecast, by Application 2019 & 2032
- Table 74: South Africa US Tofu Industry Volume (K Tons) Forecast, by Application 2019 & 2032
- Table 75: Rest of Middle East & Africa US Tofu Industry Revenue (Million) Forecast, by Application 2019 & 2032
- Table 76: Rest of Middle East & Africa US Tofu Industry Volume (K Tons) Forecast, by Application 2019 & 2032
- Table 77: Global US Tofu Industry Revenue Million Forecast, by Distribution Channel 2019 & 2032
- Table 78: Global US Tofu Industry Volume K Tons Forecast, by Distribution Channel 2019 & 2032
- Table 79: Global US Tofu Industry Revenue Million Forecast, by Country 2019 & 2032
- Table 80: Global US Tofu Industry Volume K Tons Forecast, by Country 2019 & 2032
- Table 81: China US Tofu Industry Revenue (Million) Forecast, by Application 2019 & 2032
- Table 82: China US Tofu Industry Volume (K Tons) Forecast, by Application 2019 & 2032
- Table 83: India US Tofu Industry Revenue (Million) Forecast, by Application 2019 & 2032
- Table 84: India US Tofu Industry Volume (K Tons) Forecast, by Application 2019 & 2032
- Table 85: Japan US Tofu Industry Revenue (Million) Forecast, by Application 2019 & 2032
- Table 86: Japan US Tofu Industry Volume (K Tons) Forecast, by Application 2019 & 2032
- Table 87: South Korea US Tofu Industry Revenue (Million) Forecast, by Application 2019 & 2032
- Table 88: South Korea US Tofu Industry Volume (K Tons) Forecast, by Application 2019 & 2032
- Table 89: ASEAN US Tofu Industry Revenue (Million) Forecast, by Application 2019 & 2032
- Table 90: ASEAN US Tofu Industry Volume (K Tons) Forecast, by Application 2019 & 2032
- Table 91: Oceania US Tofu Industry Revenue (Million) Forecast, by Application 2019 & 2032
- Table 92: Oceania US Tofu Industry Volume (K Tons) Forecast, by Application 2019 & 2032
- Table 93: Rest of Asia Pacific US Tofu Industry Revenue (Million) Forecast, by Application 2019 & 2032
- Table 94: Rest of Asia Pacific US Tofu Industry Volume (K Tons) Forecast, by Application 2019 & 2032
Frequently Asked Questions
1. What is the projected Compound Annual Growth Rate (CAGR) of the US Tofu Industry?
The projected CAGR is approximately 4.20%.
2. Which companies are prominent players in the US Tofu Industry?
Key companies in the market include American Food Company, Superior Natural LLC, The Hain Celestial Group Inc, Albertsons Companies, Hodo Inc, Pulmuone Corporate, House Foods Group Inc, Morinaga Milk Industry Co Ltd.
3. What are the main segments of the US Tofu Industry?
The market segments include Distribution Channel.
4. Can you provide details about the market size?
The market size is estimated to be USD 421.19 Million as of 2022.
5. What are some drivers contributing to market growth?
Escalating Demand for Processed Poultry Products; Favorable Government Initiatives to Boost Production.
6. What are the notable trends driving market growth?
Increasing demand for new variants in the tofu market through the expanded e-commerce channels drives the market.
7. Are there any restraints impacting market growth?
Rising Vegan Trend among Young Consumers; Deeper Penetration of Red Meat Across Saudi Arabia.
8. Can you provide examples of recent developments in the market?
March 2023: Hodo launched two new block tofus with vibrant global flavors which include Miso Tofu and Indian Spiced Tofu.February 2023: Morinaga Nutritional Foods acquired US plant-based company, Tofurky and its sister brand Moocho. Morinaga has been a tofu supplier for Tofurky products for 17 years. The acquisition of Tofurky and Moocho will help the company to strengthen the integrated supply chain and category growth for the brands.June 2022: Morinaga Nutritional Foods launched Mori-Nu Yuzu Flavored Silken Tofu, known for its velvety smooth texture. The product has a firm texture, is versatile, and can be added to desserts or blended for preparation.
9. What pricing options are available for accessing the report?
Pricing options include single-user, multi-user, and enterprise licenses priced at USD 3800, USD 4500, and USD 5800 respectively.
10. Is the market size provided in terms of value or volume?
The market size is provided in terms of value, measured in Million and volume, measured in K Tons.
11. Are there any specific market keywords associated with the report?
Yes, the market keyword associated with the report is "US Tofu Industry," which aids in identifying and referencing the specific market segment covered.
12. How do I determine which pricing option suits my needs best?
The pricing options vary based on user requirements and access needs. Individual users may opt for single-user licenses, while businesses requiring broader access may choose multi-user or enterprise licenses for cost-effective access to the report.
13. Are there any additional resources or data provided in the US Tofu Industry report?
While the report offers comprehensive insights, it's advisable to review the specific contents or supplementary materials provided to ascertain if additional resources or data are available.
14. How can I stay updated on further developments or reports in the US Tofu Industry?
To stay informed about further developments, trends, and reports in the US Tofu Industry, consider subscribing to industry newsletters, following relevant companies and organizations, or regularly checking reputable industry news sources and publications.
Methodology
Step 1 - Identification of Relevant Samples Size from Population Database


Step 2 - Approaches for Defining Global Market Size (Value, Volume* & Price*)

Note*: In applicable scenarios
Step 3 - Data Sources
Primary Research
- Web Analytics
- Survey Reports
- Research Institute
- Latest Research Reports
- Opinion Leaders
Secondary Research
- Annual Reports
- White Paper
- Latest Press Release
- Industry Association
- Paid Database
- Investor Presentations

Step 4 - Data Triangulation
Involves using different sources of information in order to increase the validity of a study
These sources are likely to be stakeholders in a program - participants, other researchers, program staff, other community members, and so on.
Then we put all data in single framework & apply various statistical tools to find out the dynamic on the market.
During the analysis stage, feedback from the stakeholder groups would be compared to determine areas of agreement as well as areas of divergence


