
Key Insights
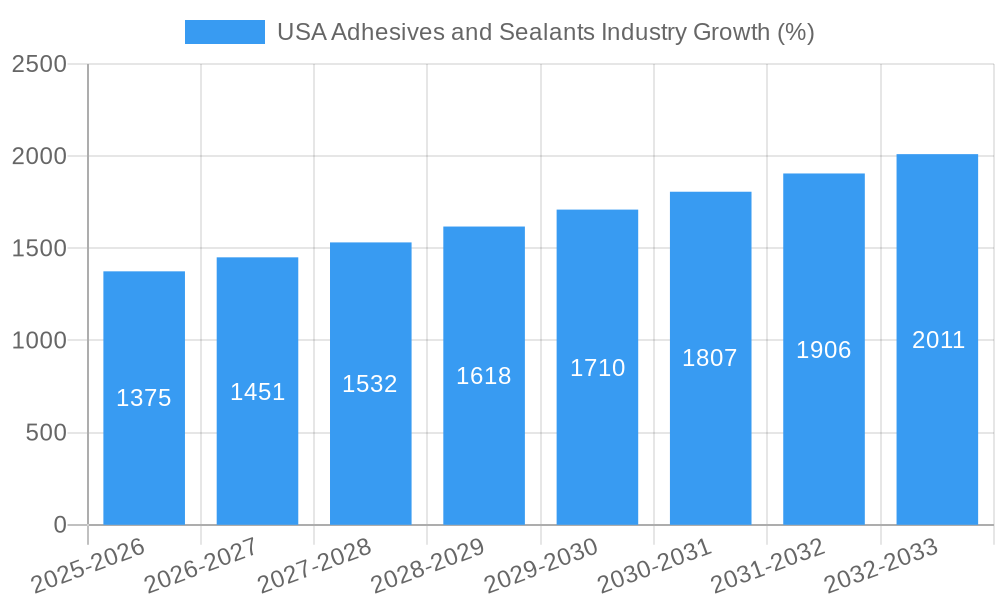
The U.S. adhesives and sealants market exhibits robust growth, driven by the burgeoning construction sector, the expanding packaging industry, and increasing demand from automotive and electronics manufacturing. A compound annual growth rate (CAGR) exceeding 5.50% from 2019 to 2024 indicates a consistently expanding market. While precise market sizing data for 2025 is unavailable, extrapolating from the historical CAGR and considering ongoing industry trends suggests a market valuation in the billions of dollars for the US market in 2025. Key growth drivers include the increasing adoption of advanced adhesive technologies like UV-cured adhesives and hot melt adhesives, offering superior performance and processing efficiency. The rising demand for sustainable and eco-friendly adhesives is also shaping market dynamics, with manufacturers focusing on developing products with reduced volatile organic compound (VOC) emissions and improved recyclability. Market segmentation reveals significant contributions from polyurethane and epoxy-based adhesives and sealants, along with substantial demand from building and construction, packaging, and transportation end-user industries. However, potential restraints include fluctuating raw material prices and concerns related to the health and environmental impacts of certain adhesive formulations. Competitive dynamics are shaped by the presence of major global players such as Henkel, 3M, and Dow, alongside specialized regional manufacturers. Future growth will likely be influenced by technological advancements, stricter environmental regulations, and the ongoing expansion of key end-use sectors.
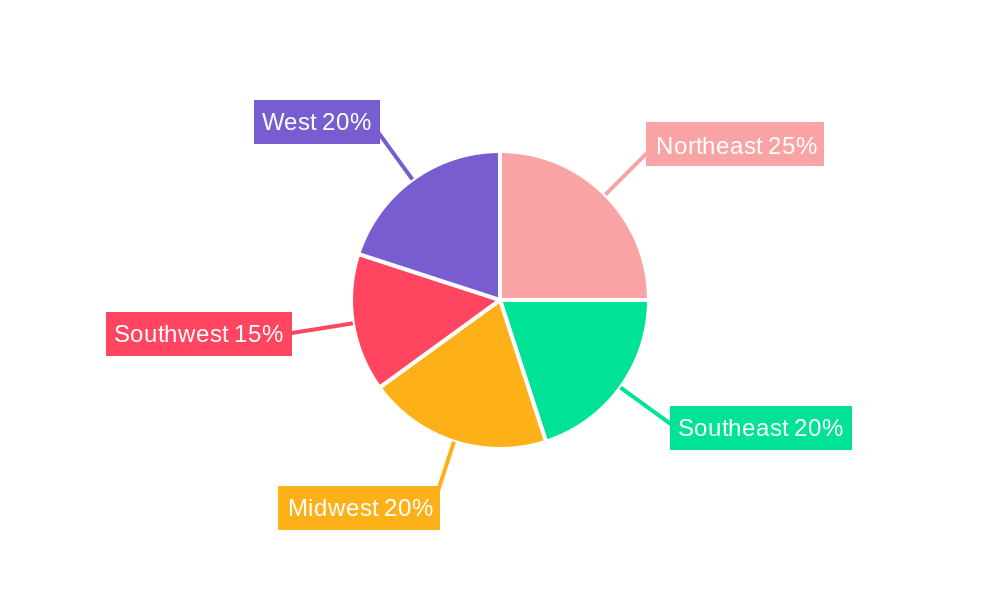
The geographical distribution of the market within the U.S. shows variations in growth rates across regions. While precise regional data is absent, it is reasonable to assume that regions with robust construction activity and significant manufacturing hubs (such as the Northeast and West) will likely display higher market penetration and faster growth rates. However, the Midwest and Southeast may demonstrate moderate growth, reflecting their industrial makeup and economic activities. The forecast period (2025-2033) is expected to see a continuation of these trends, potentially with an acceleration in growth due to innovations in materials science and the adoption of more sustainable practices. Further research and analysis focusing on specific segments, geographic regions and emerging technologies would provide a more detailed understanding of the market's future trajectory.
USA Adhesives and Sealants Industry Market Report: 2019-2033
This comprehensive report provides a detailed analysis of the USA adhesives and sealants industry, offering valuable insights for industry stakeholders, investors, and businesses operating within this dynamic sector. The report covers the period from 2019 to 2033, with a focus on the base year 2025 and a forecast period of 2025-2033. Market size estimations are provided in Millions of USD.
USA Adhesives and Sealants Industry Market Concentration & Innovation
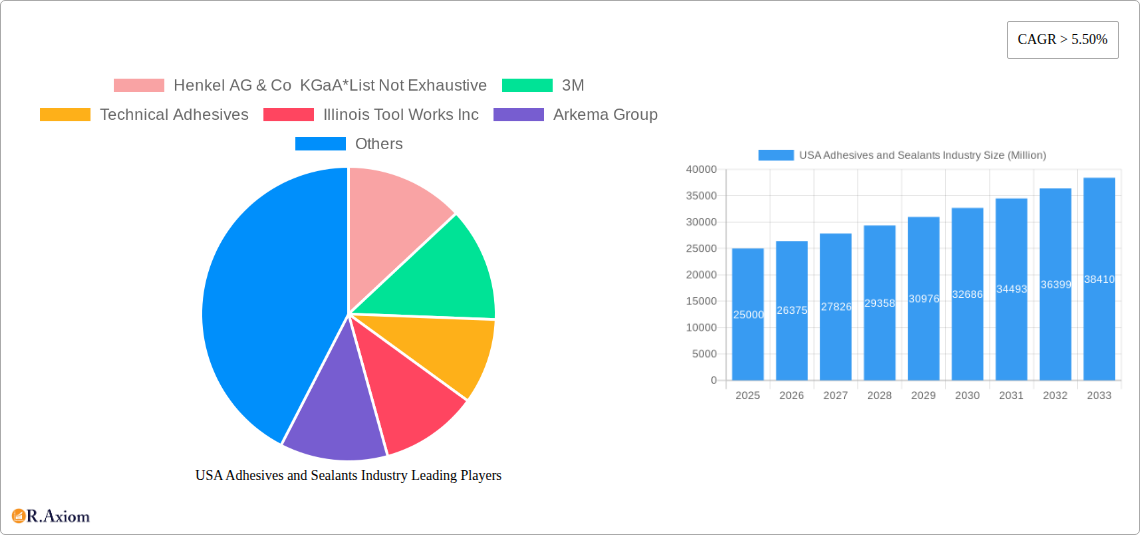
The USA adhesives and sealants market exhibits a moderately concentrated landscape, dominated by multinational corporations and specialized players. Key players like Henkel AG & Co KGaA, 3M, Illinois Tool Works Inc, Arkema Group, Huntsman International LLC, Dow, H B Fuller Company, Avery Dennison Corporation, MAPEI S p A, and Sika AG hold significant market share, estimated collectively at xx%. However, several smaller companies specializing in niche applications contribute to the market's diversity.
Innovation is driven by the demand for high-performance, sustainable, and specialized adhesives and sealants. Significant R&D investments focus on developing eco-friendly formulations, improving bonding strength, and expanding applications across various end-use industries. Regulatory frameworks, such as those concerning VOC emissions and hazardous materials, influence product development and innovation. The industry faces competition from alternative fastening technologies, but the unique advantages of adhesives and sealants – flexibility, cost-effectiveness, and superior bond strength – maintain their market dominance. Mergers and acquisitions (M&A) activity, such as Sika AG's acquisition of Hamatite in 2021 (valued at xx Million) and Arkema Group's acquisition of Ashland's Performance Adhesives business in 2022 (valued at xx Million), demonstrate consolidation and strategic expansion within the sector. These activities impact market share dynamics and competitive landscapes.
USA Adhesives and Sealants Industry Industry Trends & Insights
The USA adhesives and sealants market exhibits robust growth, driven by increasing demand across diverse end-use sectors, including building and construction, packaging, transportation, and electronics. The market experienced a CAGR of xx% during the historical period (2019-2024) and is projected to maintain a CAGR of xx% during the forecast period (2025-2033). Technological advancements, such as the development of advanced polymer chemistries, are leading to improved product performance, enabling better bonding in demanding applications. Furthermore, rising consumer awareness of sustainable products is driving the adoption of eco-friendly formulations with reduced environmental impact. The market witnesses intense competitive dynamics, characterized by product innovation, strategic partnerships, and expansion into new geographic markets. Market penetration of high-performance adhesives is increasing as end-users prioritize efficiency and durability. Challenges such as fluctuating raw material prices and supply chain disruptions exert pressure on profitability and market stability.
Dominant Markets & Segments in USA Adhesives and Sealants Industry
The building and construction sector remains the dominant end-user industry for adhesives and sealants in the USA, accounting for xx% of the total market. Key growth drivers include robust infrastructure development, rising construction activity, and increasing demand for energy-efficient buildings.
- Key Drivers for Building and Construction: Government infrastructure spending, rising construction projects (residential and commercial), demand for energy-efficient and sustainable building materials.
The hot melt adhesives segment dominates the adhesives by technology category due to its ease of application and high productivity. Polyurethane sealants represent a significant share in the sealants market due to their versatility and superior performance characteristics.
- Hot Melt Adhesives Dominance: High production efficiency, ease of application, cost-effectiveness.
- Polyurethane Sealants Dominance: Versatility, excellent adhesion, durability, resistance to various environmental factors.
Other significant segments include packaging, transportation, and electronics, each presenting unique growth opportunities based on specific technological requirements and industry trends.
USA Adhesives and Sealants Industry Product Developments
Recent product innovations focus on enhancing bonding strength, improving durability, and developing eco-friendly formulations. The industry is witnessing a rise in bio-based adhesives and sealants, driven by increasing environmental concerns. New product applications are emerging across diverse sectors, such as advanced manufacturing and medical devices. These developments offer competitive advantages to companies that can successfully adapt to evolving market needs and technological advancements.
Report Scope & Segmentation Analysis
This report segments the USA adhesives and sealants market by technology (Solvent-Borne Coatings, Reactive, Hot Melt, UV-Cured Adhesives), resin type (Polyurethane, Epoxy, Acrylic, Silicone, Cyanoacrylate, VAE/EVA, Other Resins), and end-user industry (Building and Construction, Paper, Board, and Packaging, Transportation, Woodworking and Joinery, Footwear and Leather, Healthcare, Electrical and Electronics, Other End-user Industries). Each segment's market size, growth projections, and competitive dynamics are thoroughly analyzed, providing detailed market intelligence and future forecasts. Market size estimations are provided for each segment for the historical, base, and forecast years.
Key Drivers of USA Adhesives and Sealants Industry Growth
The growth of the USA adhesives and sealants industry is driven by several factors: increased construction activity fueled by infrastructure investments, rising demand for durable and high-performance packaging solutions, technological advancements in adhesive formulations, and the growing adoption of eco-friendly materials in various industries. Favorable government policies supporting infrastructure development further contribute to market expansion.
Challenges in the USA Adhesives and Sealants Industry Sector
The industry faces challenges such as fluctuating raw material prices, supply chain disruptions impacting production and delivery, and intense competition among numerous players. Stringent environmental regulations also add to the complexity of operations, requiring companies to invest in sustainable and compliant technologies. These factors can impact profitability and constrain growth.
Emerging Opportunities in USA Adhesives and Sealants Industry
Emerging opportunities include the growing demand for specialized adhesives in advanced manufacturing, the expansion of bio-based and sustainable adhesive formulations, and the increasing integration of smart technologies in adhesive application systems. Growth in specific end-use sectors like electric vehicles and renewable energy offers further potential for market expansion.
Leading Players in the USA Adhesives and Sealants Industry Market
- Henkel AG & Co KGaA
- 3M
- Technical Adhesives
- Illinois Tool Works Inc
- Arkema Group
- Huntsman International LLC
- Dow
- H B Fuller Company
- Avery Dennison Corporation
- MAPEI S p A
- Sika AG
Key Developments in USA Adhesives and Sealants Industry Industry
- April 2021: Sika AG acquired Hamatite, expanding its presence in automotive and construction adhesives.
- Feb 2022: Arkema Group completed the acquisition of Ashland's Performance Adhesives business, strengthening its market position.
Strategic Outlook for USA Adhesives and Sealants Industry Market
The future of the USA adhesives and sealants market appears promising, driven by sustained growth in key end-use sectors, ongoing technological innovations, and the increasing demand for sustainable and high-performance solutions. Companies focusing on R&D, sustainable product development, and strategic acquisitions are well-positioned to capitalize on future growth opportunities.
USA Adhesives and Sealants Industry Segmentation
-
1. Adhesives Resin
- 1.1. Polyurethane
- 1.2. Epoxy
- 1.3. Acrylic
- 1.4. Silicone
- 1.5. Cyanoacrylate
- 1.6. VAE/EVA
- 1.7. Other Resins
-
2. Adhesives Technology
- 2.1. Solvent-Borne Coatings
- 2.2. Reactive
- 2.3. Hot Melt
- 2.4. UV-Cured Adhesives
-
3. Sealants Resin
- 3.1. Polyurethane
- 3.2. Epoxy
- 3.3. Acrylic
- 3.4. Silicone
- 3.5. Other Resins
-
4. End-user Industry
- 4.1. Building and Construction
- 4.2. Paper, Board, and Packaging
- 4.3. Transportation
- 4.4. Woodworking and Joinery
- 4.5. Footwear and Leather
- 4.6. Healthcare
- 4.7. Electrical and Electronics
- 4.8. Other End-user Industries
USA Adhesives and Sealants Industry Segmentation By Geography
-
1. North America
- 1.1. United States
- 1.2. Canada
- 1.3. Mexico
-
2. South America
- 2.1. Brazil
- 2.2. Argentina
- 2.3. Rest of South America
-
3. Europe
- 3.1. United Kingdom
- 3.2. Germany
- 3.3. France
- 3.4. Italy
- 3.5. Spain
- 3.6. Russia
- 3.7. Benelux
- 3.8. Nordics
- 3.9. Rest of Europe
-
4. Middle East & Africa
- 4.1. Turkey
- 4.2. Israel
- 4.3. GCC
- 4.4. North Africa
- 4.5. South Africa
- 4.6. Rest of Middle East & Africa
-
5. Asia Pacific
- 5.1. China
- 5.2. India
- 5.3. Japan
- 5.4. South Korea
- 5.5. ASEAN
- 5.6. Oceania
- 5.7. Rest of Asia Pacific
USA Adhesives and Sealants Industry REPORT HIGHLIGHTS
| Aspects | Details |
|---|---|
| Study Period | 2019-2033 |
| Base Year | 2024 |
| Estimated Year | 2025 |
| Forecast Period | 2025-2033 |
| Historical Period | 2019-2024 |
| Growth Rate | CAGR of > 5.50% from 2019-2033 |
| Segmentation |
|
Table of Contents
- 1. Introduction
- 1.1. Research Scope
- 1.2. Market Segmentation
- 1.3. Research Methodology
- 1.4. Definitions and Assumptions
- 2. Executive Summary
- 2.1. Introduction
- 3. Market Dynamics
- 3.1. Introduction
- 3.2. Market Drivers
- 3.2.1. Rising Demand from Packaging Industry; Other Drivers
- 3.3. Market Restrains
- 3.3.1. Strict Regulations on the Usage of VOC-free Contents; Other Restraints
- 3.4. Market Trends
- 3.4.1. Increasing Demand from Packaging Industry
- 4. Market Factor Analysis
- 4.1. Porters Five Forces
- 4.2. Supply/Value Chain
- 4.3. PESTEL analysis
- 4.4. Market Entropy
- 4.5. Patent/Trademark Analysis
- 5. Global USA Adhesives and Sealants Industry Analysis, Insights and Forecast, 2019-2031
- 5.1. Market Analysis, Insights and Forecast - by Adhesives Resin
- 5.1.1. Polyurethane
- 5.1.2. Epoxy
- 5.1.3. Acrylic
- 5.1.4. Silicone
- 5.1.5. Cyanoacrylate
- 5.1.6. VAE/EVA
- 5.1.7. Other Resins
- 5.2. Market Analysis, Insights and Forecast - by Adhesives Technology
- 5.2.1. Solvent-Borne Coatings
- 5.2.2. Reactive
- 5.2.3. Hot Melt
- 5.2.4. UV-Cured Adhesives
- 5.3. Market Analysis, Insights and Forecast - by Sealants Resin
- 5.3.1. Polyurethane
- 5.3.2. Epoxy
- 5.3.3. Acrylic
- 5.3.4. Silicone
- 5.3.5. Other Resins
- 5.4. Market Analysis, Insights and Forecast - by End-user Industry
- 5.4.1. Building and Construction
- 5.4.2. Paper, Board, and Packaging
- 5.4.3. Transportation
- 5.4.4. Woodworking and Joinery
- 5.4.5. Footwear and Leather
- 5.4.6. Healthcare
- 5.4.7. Electrical and Electronics
- 5.4.8. Other End-user Industries
- 5.5. Market Analysis, Insights and Forecast - by Region
- 5.5.1. North America
- 5.5.2. South America
- 5.5.3. Europe
- 5.5.4. Middle East & Africa
- 5.5.5. Asia Pacific
- 5.1. Market Analysis, Insights and Forecast - by Adhesives Resin
- 6. North America USA Adhesives and Sealants Industry Analysis, Insights and Forecast, 2019-2031
- 6.1. Market Analysis, Insights and Forecast - by Adhesives Resin
- 6.1.1. Polyurethane
- 6.1.2. Epoxy
- 6.1.3. Acrylic
- 6.1.4. Silicone
- 6.1.5. Cyanoacrylate
- 6.1.6. VAE/EVA
- 6.1.7. Other Resins
- 6.2. Market Analysis, Insights and Forecast - by Adhesives Technology
- 6.2.1. Solvent-Borne Coatings
- 6.2.2. Reactive
- 6.2.3. Hot Melt
- 6.2.4. UV-Cured Adhesives
- 6.3. Market Analysis, Insights and Forecast - by Sealants Resin
- 6.3.1. Polyurethane
- 6.3.2. Epoxy
- 6.3.3. Acrylic
- 6.3.4. Silicone
- 6.3.5. Other Resins
- 6.4. Market Analysis, Insights and Forecast - by End-user Industry
- 6.4.1. Building and Construction
- 6.4.2. Paper, Board, and Packaging
- 6.4.3. Transportation
- 6.4.4. Woodworking and Joinery
- 6.4.5. Footwear and Leather
- 6.4.6. Healthcare
- 6.4.7. Electrical and Electronics
- 6.4.8. Other End-user Industries
- 6.1. Market Analysis, Insights and Forecast - by Adhesives Resin
- 7. South America USA Adhesives and Sealants Industry Analysis, Insights and Forecast, 2019-2031
- 7.1. Market Analysis, Insights and Forecast - by Adhesives Resin
- 7.1.1. Polyurethane
- 7.1.2. Epoxy
- 7.1.3. Acrylic
- 7.1.4. Silicone
- 7.1.5. Cyanoacrylate
- 7.1.6. VAE/EVA
- 7.1.7. Other Resins
- 7.2. Market Analysis, Insights and Forecast - by Adhesives Technology
- 7.2.1. Solvent-Borne Coatings
- 7.2.2. Reactive
- 7.2.3. Hot Melt
- 7.2.4. UV-Cured Adhesives
- 7.3. Market Analysis, Insights and Forecast - by Sealants Resin
- 7.3.1. Polyurethane
- 7.3.2. Epoxy
- 7.3.3. Acrylic
- 7.3.4. Silicone
- 7.3.5. Other Resins
- 7.4. Market Analysis, Insights and Forecast - by End-user Industry
- 7.4.1. Building and Construction
- 7.4.2. Paper, Board, and Packaging
- 7.4.3. Transportation
- 7.4.4. Woodworking and Joinery
- 7.4.5. Footwear and Leather
- 7.4.6. Healthcare
- 7.4.7. Electrical and Electronics
- 7.4.8. Other End-user Industries
- 7.1. Market Analysis, Insights and Forecast - by Adhesives Resin
- 8. Europe USA Adhesives and Sealants Industry Analysis, Insights and Forecast, 2019-2031
- 8.1. Market Analysis, Insights and Forecast - by Adhesives Resin
- 8.1.1. Polyurethane
- 8.1.2. Epoxy
- 8.1.3. Acrylic
- 8.1.4. Silicone
- 8.1.5. Cyanoacrylate
- 8.1.6. VAE/EVA
- 8.1.7. Other Resins
- 8.2. Market Analysis, Insights and Forecast - by Adhesives Technology
- 8.2.1. Solvent-Borne Coatings
- 8.2.2. Reactive
- 8.2.3. Hot Melt
- 8.2.4. UV-Cured Adhesives
- 8.3. Market Analysis, Insights and Forecast - by Sealants Resin
- 8.3.1. Polyurethane
- 8.3.2. Epoxy
- 8.3.3. Acrylic
- 8.3.4. Silicone
- 8.3.5. Other Resins
- 8.4. Market Analysis, Insights and Forecast - by End-user Industry
- 8.4.1. Building and Construction
- 8.4.2. Paper, Board, and Packaging
- 8.4.3. Transportation
- 8.4.4. Woodworking and Joinery
- 8.4.5. Footwear and Leather
- 8.4.6. Healthcare
- 8.4.7. Electrical and Electronics
- 8.4.8. Other End-user Industries
- 8.1. Market Analysis, Insights and Forecast - by Adhesives Resin
- 9. Middle East & Africa USA Adhesives and Sealants Industry Analysis, Insights and Forecast, 2019-2031
- 9.1. Market Analysis, Insights and Forecast - by Adhesives Resin
- 9.1.1. Polyurethane
- 9.1.2. Epoxy
- 9.1.3. Acrylic
- 9.1.4. Silicone
- 9.1.5. Cyanoacrylate
- 9.1.6. VAE/EVA
- 9.1.7. Other Resins
- 9.2. Market Analysis, Insights and Forecast - by Adhesives Technology
- 9.2.1. Solvent-Borne Coatings
- 9.2.2. Reactive
- 9.2.3. Hot Melt
- 9.2.4. UV-Cured Adhesives
- 9.3. Market Analysis, Insights and Forecast - by Sealants Resin
- 9.3.1. Polyurethane
- 9.3.2. Epoxy
- 9.3.3. Acrylic
- 9.3.4. Silicone
- 9.3.5. Other Resins
- 9.4. Market Analysis, Insights and Forecast - by End-user Industry
- 9.4.1. Building and Construction
- 9.4.2. Paper, Board, and Packaging
- 9.4.3. Transportation
- 9.4.4. Woodworking and Joinery
- 9.4.5. Footwear and Leather
- 9.4.6. Healthcare
- 9.4.7. Electrical and Electronics
- 9.4.8. Other End-user Industries
- 9.1. Market Analysis, Insights and Forecast - by Adhesives Resin
- 10. Asia Pacific USA Adhesives and Sealants Industry Analysis, Insights and Forecast, 2019-2031
- 10.1. Market Analysis, Insights and Forecast - by Adhesives Resin
- 10.1.1. Polyurethane
- 10.1.2. Epoxy
- 10.1.3. Acrylic
- 10.1.4. Silicone
- 10.1.5. Cyanoacrylate
- 10.1.6. VAE/EVA
- 10.1.7. Other Resins
- 10.2. Market Analysis, Insights and Forecast - by Adhesives Technology
- 10.2.1. Solvent-Borne Coatings
- 10.2.2. Reactive
- 10.2.3. Hot Melt
- 10.2.4. UV-Cured Adhesives
- 10.3. Market Analysis, Insights and Forecast - by Sealants Resin
- 10.3.1. Polyurethane
- 10.3.2. Epoxy
- 10.3.3. Acrylic
- 10.3.4. Silicone
- 10.3.5. Other Resins
- 10.4. Market Analysis, Insights and Forecast - by End-user Industry
- 10.4.1. Building and Construction
- 10.4.2. Paper, Board, and Packaging
- 10.4.3. Transportation
- 10.4.4. Woodworking and Joinery
- 10.4.5. Footwear and Leather
- 10.4.6. Healthcare
- 10.4.7. Electrical and Electronics
- 10.4.8. Other End-user Industries
- 10.1. Market Analysis, Insights and Forecast - by Adhesives Resin
- 11. Northeast USA Adhesives and Sealants Industry Analysis, Insights and Forecast, 2019-2031
- 12. Southeast USA Adhesives and Sealants Industry Analysis, Insights and Forecast, 2019-2031
- 13. Midwest USA Adhesives and Sealants Industry Analysis, Insights and Forecast, 2019-2031
- 14. Southwest USA Adhesives and Sealants Industry Analysis, Insights and Forecast, 2019-2031
- 15. West USA Adhesives and Sealants Industry Analysis, Insights and Forecast, 2019-2031
- 16. Competitive Analysis
- 16.1. Global Market Share Analysis 2024
- 16.2. Company Profiles
- 16.2.1 Henkel AG & Co KGaA*List Not Exhaustive
- 16.2.1.1. Overview
- 16.2.1.2. Products
- 16.2.1.3. SWOT Analysis
- 16.2.1.4. Recent Developments
- 16.2.1.5. Financials (Based on Availability)
- 16.2.2 3M
- 16.2.2.1. Overview
- 16.2.2.2. Products
- 16.2.2.3. SWOT Analysis
- 16.2.2.4. Recent Developments
- 16.2.2.5. Financials (Based on Availability)
- 16.2.3 Technical Adhesives
- 16.2.3.1. Overview
- 16.2.3.2. Products
- 16.2.3.3. SWOT Analysis
- 16.2.3.4. Recent Developments
- 16.2.3.5. Financials (Based on Availability)
- 16.2.4 Illinois Tool Works Inc
- 16.2.4.1. Overview
- 16.2.4.2. Products
- 16.2.4.3. SWOT Analysis
- 16.2.4.4. Recent Developments
- 16.2.4.5. Financials (Based on Availability)
- 16.2.5 Arkema Group
- 16.2.5.1. Overview
- 16.2.5.2. Products
- 16.2.5.3. SWOT Analysis
- 16.2.5.4. Recent Developments
- 16.2.5.5. Financials (Based on Availability)
- 16.2.6 Huntsman International LLC
- 16.2.6.1. Overview
- 16.2.6.2. Products
- 16.2.6.3. SWOT Analysis
- 16.2.6.4. Recent Developments
- 16.2.6.5. Financials (Based on Availability)
- 16.2.7 Dow
- 16.2.7.1. Overview
- 16.2.7.2. Products
- 16.2.7.3. SWOT Analysis
- 16.2.7.4. Recent Developments
- 16.2.7.5. Financials (Based on Availability)
- 16.2.8 H B Fuller Company
- 16.2.8.1. Overview
- 16.2.8.2. Products
- 16.2.8.3. SWOT Analysis
- 16.2.8.4. Recent Developments
- 16.2.8.5. Financials (Based on Availability)
- 16.2.9 Avery Dennison Corporation
- 16.2.9.1. Overview
- 16.2.9.2. Products
- 16.2.9.3. SWOT Analysis
- 16.2.9.4. Recent Developments
- 16.2.9.5. Financials (Based on Availability)
- 16.2.10 MAPEI S p A
- 16.2.10.1. Overview
- 16.2.10.2. Products
- 16.2.10.3. SWOT Analysis
- 16.2.10.4. Recent Developments
- 16.2.10.5. Financials (Based on Availability)
- 16.2.11 Sika AG
- 16.2.11.1. Overview
- 16.2.11.2. Products
- 16.2.11.3. SWOT Analysis
- 16.2.11.4. Recent Developments
- 16.2.11.5. Financials (Based on Availability)
- 16.2.1 Henkel AG & Co KGaA*List Not Exhaustive
List of Figures
- Figure 1: Global USA Adhesives and Sealants Industry Revenue Breakdown (Million, %) by Region 2024 & 2032
- Figure 2: United states USA Adhesives and Sealants Industry Revenue (Million), by Country 2024 & 2032
- Figure 3: United states USA Adhesives and Sealants Industry Revenue Share (%), by Country 2024 & 2032
- Figure 4: North America USA Adhesives and Sealants Industry Revenue (Million), by Adhesives Resin 2024 & 2032
- Figure 5: North America USA Adhesives and Sealants Industry Revenue Share (%), by Adhesives Resin 2024 & 2032
- Figure 6: North America USA Adhesives and Sealants Industry Revenue (Million), by Adhesives Technology 2024 & 2032
- Figure 7: North America USA Adhesives and Sealants Industry Revenue Share (%), by Adhesives Technology 2024 & 2032
- Figure 8: North America USA Adhesives and Sealants Industry Revenue (Million), by Sealants Resin 2024 & 2032
- Figure 9: North America USA Adhesives and Sealants Industry Revenue Share (%), by Sealants Resin 2024 & 2032
- Figure 10: North America USA Adhesives and Sealants Industry Revenue (Million), by End-user Industry 2024 & 2032
- Figure 11: North America USA Adhesives and Sealants Industry Revenue Share (%), by End-user Industry 2024 & 2032
- Figure 12: North America USA Adhesives and Sealants Industry Revenue (Million), by Country 2024 & 2032
- Figure 13: North America USA Adhesives and Sealants Industry Revenue Share (%), by Country 2024 & 2032
- Figure 14: South America USA Adhesives and Sealants Industry Revenue (Million), by Adhesives Resin 2024 & 2032
- Figure 15: South America USA Adhesives and Sealants Industry Revenue Share (%), by Adhesives Resin 2024 & 2032
- Figure 16: South America USA Adhesives and Sealants Industry Revenue (Million), by Adhesives Technology 2024 & 2032
- Figure 17: South America USA Adhesives and Sealants Industry Revenue Share (%), by Adhesives Technology 2024 & 2032
- Figure 18: South America USA Adhesives and Sealants Industry Revenue (Million), by Sealants Resin 2024 & 2032
- Figure 19: South America USA Adhesives and Sealants Industry Revenue Share (%), by Sealants Resin 2024 & 2032
- Figure 20: South America USA Adhesives and Sealants Industry Revenue (Million), by End-user Industry 2024 & 2032
- Figure 21: South America USA Adhesives and Sealants Industry Revenue Share (%), by End-user Industry 2024 & 2032
- Figure 22: South America USA Adhesives and Sealants Industry Revenue (Million), by Country 2024 & 2032
- Figure 23: South America USA Adhesives and Sealants Industry Revenue Share (%), by Country 2024 & 2032
- Figure 24: Europe USA Adhesives and Sealants Industry Revenue (Million), by Adhesives Resin 2024 & 2032
- Figure 25: Europe USA Adhesives and Sealants Industry Revenue Share (%), by Adhesives Resin 2024 & 2032
- Figure 26: Europe USA Adhesives and Sealants Industry Revenue (Million), by Adhesives Technology 2024 & 2032
- Figure 27: Europe USA Adhesives and Sealants Industry Revenue Share (%), by Adhesives Technology 2024 & 2032
- Figure 28: Europe USA Adhesives and Sealants Industry Revenue (Million), by Sealants Resin 2024 & 2032
- Figure 29: Europe USA Adhesives and Sealants Industry Revenue Share (%), by Sealants Resin 2024 & 2032
- Figure 30: Europe USA Adhesives and Sealants Industry Revenue (Million), by End-user Industry 2024 & 2032
- Figure 31: Europe USA Adhesives and Sealants Industry Revenue Share (%), by End-user Industry 2024 & 2032
- Figure 32: Europe USA Adhesives and Sealants Industry Revenue (Million), by Country 2024 & 2032
- Figure 33: Europe USA Adhesives and Sealants Industry Revenue Share (%), by Country 2024 & 2032
- Figure 34: Middle East & Africa USA Adhesives and Sealants Industry Revenue (Million), by Adhesives Resin 2024 & 2032
- Figure 35: Middle East & Africa USA Adhesives and Sealants Industry Revenue Share (%), by Adhesives Resin 2024 & 2032
- Figure 36: Middle East & Africa USA Adhesives and Sealants Industry Revenue (Million), by Adhesives Technology 2024 & 2032
- Figure 37: Middle East & Africa USA Adhesives and Sealants Industry Revenue Share (%), by Adhesives Technology 2024 & 2032
- Figure 38: Middle East & Africa USA Adhesives and Sealants Industry Revenue (Million), by Sealants Resin 2024 & 2032
- Figure 39: Middle East & Africa USA Adhesives and Sealants Industry Revenue Share (%), by Sealants Resin 2024 & 2032
- Figure 40: Middle East & Africa USA Adhesives and Sealants Industry Revenue (Million), by End-user Industry 2024 & 2032
- Figure 41: Middle East & Africa USA Adhesives and Sealants Industry Revenue Share (%), by End-user Industry 2024 & 2032
- Figure 42: Middle East & Africa USA Adhesives and Sealants Industry Revenue (Million), by Country 2024 & 2032
- Figure 43: Middle East & Africa USA Adhesives and Sealants Industry Revenue Share (%), by Country 2024 & 2032
- Figure 44: Asia Pacific USA Adhesives and Sealants Industry Revenue (Million), by Adhesives Resin 2024 & 2032
- Figure 45: Asia Pacific USA Adhesives and Sealants Industry Revenue Share (%), by Adhesives Resin 2024 & 2032
- Figure 46: Asia Pacific USA Adhesives and Sealants Industry Revenue (Million), by Adhesives Technology 2024 & 2032
- Figure 47: Asia Pacific USA Adhesives and Sealants Industry Revenue Share (%), by Adhesives Technology 2024 & 2032
- Figure 48: Asia Pacific USA Adhesives and Sealants Industry Revenue (Million), by Sealants Resin 2024 & 2032
- Figure 49: Asia Pacific USA Adhesives and Sealants Industry Revenue Share (%), by Sealants Resin 2024 & 2032
- Figure 50: Asia Pacific USA Adhesives and Sealants Industry Revenue (Million), by End-user Industry 2024 & 2032
- Figure 51: Asia Pacific USA Adhesives and Sealants Industry Revenue Share (%), by End-user Industry 2024 & 2032
- Figure 52: Asia Pacific USA Adhesives and Sealants Industry Revenue (Million), by Country 2024 & 2032
- Figure 53: Asia Pacific USA Adhesives and Sealants Industry Revenue Share (%), by Country 2024 & 2032
List of Tables
- Table 1: Global USA Adhesives and Sealants Industry Revenue Million Forecast, by Region 2019 & 2032
- Table 2: Global USA Adhesives and Sealants Industry Revenue Million Forecast, by Adhesives Resin 2019 & 2032
- Table 3: Global USA Adhesives and Sealants Industry Revenue Million Forecast, by Adhesives Technology 2019 & 2032
- Table 4: Global USA Adhesives and Sealants Industry Revenue Million Forecast, by Sealants Resin 2019 & 2032
- Table 5: Global USA Adhesives and Sealants Industry Revenue Million Forecast, by End-user Industry 2019 & 2032
- Table 6: Global USA Adhesives and Sealants Industry Revenue Million Forecast, by Region 2019 & 2032
- Table 7: Global USA Adhesives and Sealants Industry Revenue Million Forecast, by Country 2019 & 2032
- Table 8: Northeast USA Adhesives and Sealants Industry Revenue (Million) Forecast, by Application 2019 & 2032
- Table 9: Southeast USA Adhesives and Sealants Industry Revenue (Million) Forecast, by Application 2019 & 2032
- Table 10: Midwest USA Adhesives and Sealants Industry Revenue (Million) Forecast, by Application 2019 & 2032
- Table 11: Southwest USA Adhesives and Sealants Industry Revenue (Million) Forecast, by Application 2019 & 2032
- Table 12: West USA Adhesives and Sealants Industry Revenue (Million) Forecast, by Application 2019 & 2032
- Table 13: Global USA Adhesives and Sealants Industry Revenue Million Forecast, by Adhesives Resin 2019 & 2032
- Table 14: Global USA Adhesives and Sealants Industry Revenue Million Forecast, by Adhesives Technology 2019 & 2032
- Table 15: Global USA Adhesives and Sealants Industry Revenue Million Forecast, by Sealants Resin 2019 & 2032
- Table 16: Global USA Adhesives and Sealants Industry Revenue Million Forecast, by End-user Industry 2019 & 2032
- Table 17: Global USA Adhesives and Sealants Industry Revenue Million Forecast, by Country 2019 & 2032
- Table 18: United States USA Adhesives and Sealants Industry Revenue (Million) Forecast, by Application 2019 & 2032
- Table 19: Canada USA Adhesives and Sealants Industry Revenue (Million) Forecast, by Application 2019 & 2032
- Table 20: Mexico USA Adhesives and Sealants Industry Revenue (Million) Forecast, by Application 2019 & 2032
- Table 21: Global USA Adhesives and Sealants Industry Revenue Million Forecast, by Adhesives Resin 2019 & 2032
- Table 22: Global USA Adhesives and Sealants Industry Revenue Million Forecast, by Adhesives Technology 2019 & 2032
- Table 23: Global USA Adhesives and Sealants Industry Revenue Million Forecast, by Sealants Resin 2019 & 2032
- Table 24: Global USA Adhesives and Sealants Industry Revenue Million Forecast, by End-user Industry 2019 & 2032
- Table 25: Global USA Adhesives and Sealants Industry Revenue Million Forecast, by Country 2019 & 2032
- Table 26: Brazil USA Adhesives and Sealants Industry Revenue (Million) Forecast, by Application 2019 & 2032
- Table 27: Argentina USA Adhesives and Sealants Industry Revenue (Million) Forecast, by Application 2019 & 2032
- Table 28: Rest of South America USA Adhesives and Sealants Industry Revenue (Million) Forecast, by Application 2019 & 2032
- Table 29: Global USA Adhesives and Sealants Industry Revenue Million Forecast, by Adhesives Resin 2019 & 2032
- Table 30: Global USA Adhesives and Sealants Industry Revenue Million Forecast, by Adhesives Technology 2019 & 2032
- Table 31: Global USA Adhesives and Sealants Industry Revenue Million Forecast, by Sealants Resin 2019 & 2032
- Table 32: Global USA Adhesives and Sealants Industry Revenue Million Forecast, by End-user Industry 2019 & 2032
- Table 33: Global USA Adhesives and Sealants Industry Revenue Million Forecast, by Country 2019 & 2032
- Table 34: United Kingdom USA Adhesives and Sealants Industry Revenue (Million) Forecast, by Application 2019 & 2032
- Table 35: Germany USA Adhesives and Sealants Industry Revenue (Million) Forecast, by Application 2019 & 2032
- Table 36: France USA Adhesives and Sealants Industry Revenue (Million) Forecast, by Application 2019 & 2032
- Table 37: Italy USA Adhesives and Sealants Industry Revenue (Million) Forecast, by Application 2019 & 2032
- Table 38: Spain USA Adhesives and Sealants Industry Revenue (Million) Forecast, by Application 2019 & 2032
- Table 39: Russia USA Adhesives and Sealants Industry Revenue (Million) Forecast, by Application 2019 & 2032
- Table 40: Benelux USA Adhesives and Sealants Industry Revenue (Million) Forecast, by Application 2019 & 2032
- Table 41: Nordics USA Adhesives and Sealants Industry Revenue (Million) Forecast, by Application 2019 & 2032
- Table 42: Rest of Europe USA Adhesives and Sealants Industry Revenue (Million) Forecast, by Application 2019 & 2032
- Table 43: Global USA Adhesives and Sealants Industry Revenue Million Forecast, by Adhesives Resin 2019 & 2032
- Table 44: Global USA Adhesives and Sealants Industry Revenue Million Forecast, by Adhesives Technology 2019 & 2032
- Table 45: Global USA Adhesives and Sealants Industry Revenue Million Forecast, by Sealants Resin 2019 & 2032
- Table 46: Global USA Adhesives and Sealants Industry Revenue Million Forecast, by End-user Industry 2019 & 2032
- Table 47: Global USA Adhesives and Sealants Industry Revenue Million Forecast, by Country 2019 & 2032
- Table 48: Turkey USA Adhesives and Sealants Industry Revenue (Million) Forecast, by Application 2019 & 2032
- Table 49: Israel USA Adhesives and Sealants Industry Revenue (Million) Forecast, by Application 2019 & 2032
- Table 50: GCC USA Adhesives and Sealants Industry Revenue (Million) Forecast, by Application 2019 & 2032
- Table 51: North Africa USA Adhesives and Sealants Industry Revenue (Million) Forecast, by Application 2019 & 2032
- Table 52: South Africa USA Adhesives and Sealants Industry Revenue (Million) Forecast, by Application 2019 & 2032
- Table 53: Rest of Middle East & Africa USA Adhesives and Sealants Industry Revenue (Million) Forecast, by Application 2019 & 2032
- Table 54: Global USA Adhesives and Sealants Industry Revenue Million Forecast, by Adhesives Resin 2019 & 2032
- Table 55: Global USA Adhesives and Sealants Industry Revenue Million Forecast, by Adhesives Technology 2019 & 2032
- Table 56: Global USA Adhesives and Sealants Industry Revenue Million Forecast, by Sealants Resin 2019 & 2032
- Table 57: Global USA Adhesives and Sealants Industry Revenue Million Forecast, by End-user Industry 2019 & 2032
- Table 58: Global USA Adhesives and Sealants Industry Revenue Million Forecast, by Country 2019 & 2032
- Table 59: China USA Adhesives and Sealants Industry Revenue (Million) Forecast, by Application 2019 & 2032
- Table 60: India USA Adhesives and Sealants Industry Revenue (Million) Forecast, by Application 2019 & 2032
- Table 61: Japan USA Adhesives and Sealants Industry Revenue (Million) Forecast, by Application 2019 & 2032
- Table 62: South Korea USA Adhesives and Sealants Industry Revenue (Million) Forecast, by Application 2019 & 2032
- Table 63: ASEAN USA Adhesives and Sealants Industry Revenue (Million) Forecast, by Application 2019 & 2032
- Table 64: Oceania USA Adhesives and Sealants Industry Revenue (Million) Forecast, by Application 2019 & 2032
- Table 65: Rest of Asia Pacific USA Adhesives and Sealants Industry Revenue (Million) Forecast, by Application 2019 & 2032
Frequently Asked Questions
1. What is the projected Compound Annual Growth Rate (CAGR) of the USA Adhesives and Sealants Industry?
The projected CAGR is approximately > 5.50%.
2. Which companies are prominent players in the USA Adhesives and Sealants Industry?
Key companies in the market include Henkel AG & Co KGaA*List Not Exhaustive, 3M, Technical Adhesives, Illinois Tool Works Inc, Arkema Group, Huntsman International LLC, Dow, H B Fuller Company, Avery Dennison Corporation, MAPEI S p A, Sika AG.
3. What are the main segments of the USA Adhesives and Sealants Industry?
The market segments include Adhesives Resin, Adhesives Technology, Sealants Resin, End-user Industry.
4. Can you provide details about the market size?
The market size is estimated to be USD XX Million as of 2022.
5. What are some drivers contributing to market growth?
Rising Demand from Packaging Industry; Other Drivers.
6. What are the notable trends driving market growth?
Increasing Demand from Packaging Industry.
7. Are there any restraints impacting market growth?
Strict Regulations on the Usage of VOC-free Contents; Other Restraints.
8. Can you provide examples of recent developments in the market?
In April 2021, Sika AG signed an agreement to acquire The Yokohama Rubber Co. Ltd's adhesives division, Hamatite, based in Japan. Hamatite offers polyurethanes, hot melts, and modified silicones technology adhesives and sealants for the automotive and construction industries.
9. What pricing options are available for accessing the report?
Pricing options include single-user, multi-user, and enterprise licenses priced at USD 3800, USD 4500, and USD 5800 respectively.
10. Is the market size provided in terms of value or volume?
The market size is provided in terms of value, measured in Million.
11. Are there any specific market keywords associated with the report?
Yes, the market keyword associated with the report is "USA Adhesives and Sealants Industry," which aids in identifying and referencing the specific market segment covered.
12. How do I determine which pricing option suits my needs best?
The pricing options vary based on user requirements and access needs. Individual users may opt for single-user licenses, while businesses requiring broader access may choose multi-user or enterprise licenses for cost-effective access to the report.
13. Are there any additional resources or data provided in the USA Adhesives and Sealants Industry report?
While the report offers comprehensive insights, it's advisable to review the specific contents or supplementary materials provided to ascertain if additional resources or data are available.
14. How can I stay updated on further developments or reports in the USA Adhesives and Sealants Industry?
To stay informed about further developments, trends, and reports in the USA Adhesives and Sealants Industry, consider subscribing to industry newsletters, following relevant companies and organizations, or regularly checking reputable industry news sources and publications.
Methodology
Step 1 - Identification of Relevant Samples Size from Population Database


Step 2 - Approaches for Defining Global Market Size (Value, Volume* & Price*)

Note*: In applicable scenarios
Step 3 - Data Sources
Primary Research
- Web Analytics
- Survey Reports
- Research Institute
- Latest Research Reports
- Opinion Leaders
Secondary Research
- Annual Reports
- White Paper
- Latest Press Release
- Industry Association
- Paid Database
- Investor Presentations

Step 4 - Data Triangulation
Involves using different sources of information in order to increase the validity of a study
These sources are likely to be stakeholders in a program - participants, other researchers, program staff, other community members, and so on.
Then we put all data in single framework & apply various statistical tools to find out the dynamic on the market.
During the analysis stage, feedback from the stakeholder groups would be compared to determine areas of agreement as well as areas of divergence


