


Key Insights
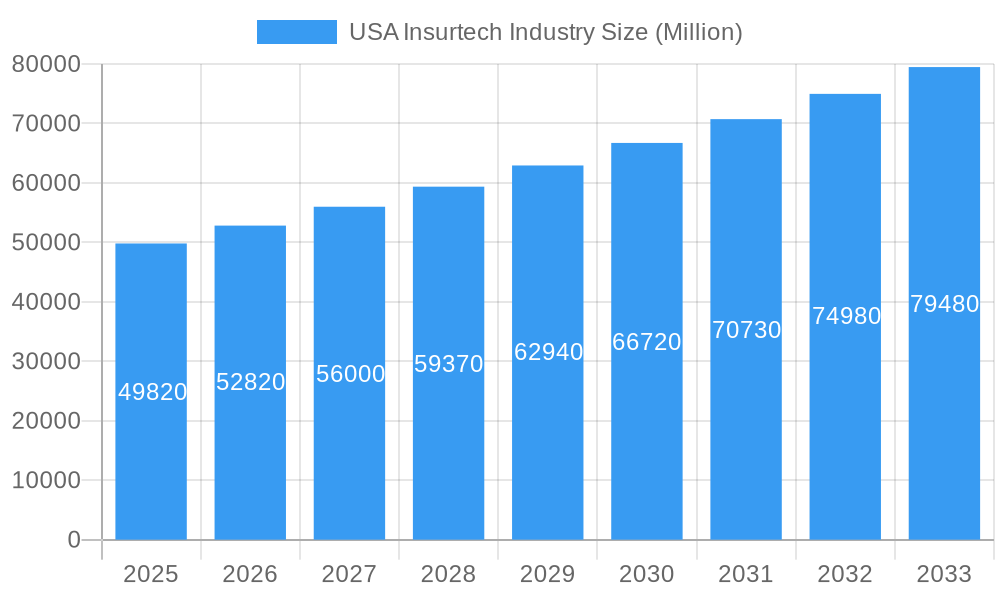
The US Insurtech market, valued at $49.82 billion in 2025, is experiencing robust growth, projected to maintain a Compound Annual Growth Rate (CAGR) exceeding 6.00% from 2025 to 2033. This expansion is fueled by several key drivers. Firstly, increasing consumer demand for digital-first experiences and personalized insurance products is pushing traditional insurers to adopt innovative technologies and business models. Secondly, the proliferation of data analytics and artificial intelligence (AI) enables more accurate risk assessment and personalized pricing, leading to greater efficiency and cost savings for both insurers and customers. Furthermore, advancements in mobile technology and the widespread adoption of smartphones facilitate easier access to insurance services and streamline claims processing. The emergence of new business models, such as usage-based insurance and embedded insurance, further contributes to the market's dynamism. While challenges exist, such as regulatory hurdles and cybersecurity concerns, the overall market outlook remains positive, driven by continuous technological innovation and evolving consumer expectations. Companies like Gusto, Oscar, Bright Health, and Lemonade are leading the charge, leveraging technology to disrupt traditional insurance practices and offer more convenient and affordable solutions. The market segmentation will likely see continued growth in areas like personalized health insurance, usage-based auto insurance, and digital-first property and casualty insurance.

USA Insurtech Industry Market Size (In Billion)

The sustained growth of the US Insurtech market over the forecast period (2025-2033) is anticipated to be driven by several factors. The increasing adoption of cloud computing and big data analytics will improve operational efficiency and reduce costs. Moreover, the integration of Internet of Things (IoT) devices will lead to more accurate risk assessments and personalized insurance offerings. The growing popularity of Insurtech platforms catering to niche markets will further contribute to market expansion. However, the market's growth trajectory might face some headwinds, including concerns related to data privacy and security, the need for robust regulatory frameworks, and potential integration challenges with existing legacy systems within the insurance sector. Despite these potential challenges, the overall positive market sentiment remains strong, fueled by a continuously growing consumer base embracing digital-first insurance solutions and technological advancements continuously improving the user experience.
USA Insurtech Industry Company Market Share
USA Insurtech Industry Market Report: 2019-2033
This comprehensive report provides a detailed analysis of the USA Insurtech industry, covering market size, growth drivers, challenges, and opportunities from 2019 to 2033. The report incorporates key market trends, competitive landscape, and strategic insights to empower businesses and investors to make informed decisions. The study period is 2019-2033, with 2025 as the base and estimated year. The forecast period is 2025-2033, and the historical period is 2019-2024.
USA Insurtech Industry Market Concentration & Innovation
This section analyzes the concentration of the US Insurtech market, identifying key players and their market share. It examines innovation drivers, regulatory frameworks, substitute products, and end-user trends influencing market dynamics. The analysis also includes a review of mergers and acquisitions (M&A) activity, detailing deal values and their impact on market consolidation. The US Insurtech market is characterized by a dynamic competitive landscape, with a mix of established players and emerging startups. Market concentration is moderate, with no single dominant player controlling a significant portion of the market. However, several companies have established substantial market share in specific segments. For example, Lemonade and Next Insurance have gained considerable traction in the personal lines insurance segment. Meanwhile, Oscar and Bright Health have made significant inroads in the healthcare sector.
- Market Share: The top 5 players control approximately xx% of the market (2024 data).
- M&A Activity: The total value of M&A deals in the US Insurtech market from 2019-2024 reached approximately $xx Billion. Deals have primarily focused on expanding technological capabilities and market reach.
- Innovation Drivers: Technological advancements like AI, machine learning, and blockchain are driving innovation. Consumer demand for personalized and digitally-driven insurance solutions further fuels innovation.
- Regulatory Framework: The regulatory environment plays a significant role in shaping market dynamics, influencing product development and market access.
- Product Substitutes: The emergence of alternative financial services and fintech solutions presents some level of substitution for certain insurtech offerings.
USA Insurtech Industry Industry Trends & Insights
The US Insurtech market exhibits robust growth, driven by several factors. Technological disruptions, changing consumer preferences, and intensified competition are reshaping industry dynamics. Market growth is fueled by increased smartphone penetration, rising digital literacy, and the increasing demand for convenient and personalized insurance solutions. The shift toward digital distribution channels, coupled with technological advancements, is accelerating market expansion. The increasing adoption of telematics and IoT devices is also shaping the insurance landscape, enabling more accurate risk assessment and personalized pricing.
- CAGR: The market is projected to experience a CAGR of xx% during the forecast period (2025-2033).
- Market Penetration: The market penetration of Insurtech solutions is steadily increasing, driven by the rising adoption of digital platforms and services. By 2033, market penetration is expected to reach xx%.
- Technological Disruptions: AI, Machine Learning, and Blockchain are transforming underwriting, claims processing, and customer service.
- Consumer Preferences: Consumers increasingly prefer digital-first insurance solutions that offer convenience, personalization, and transparency.
Dominant Markets & Segments in USA Insurtech Industry
The US Insurtech market is segmented by several factors including the type of insurance (auto, health, life, etc.), distribution channels (direct-to-consumer, agents, etc.), and technology used. The report provides a detailed analysis of each segment, highlighting their respective growth drivers and competitive landscapes.
- Key Drivers:
- Technological Advancements: The continuous development and adoption of new technologies are pushing the industry forward.
- Favorable Regulatory Environment: A supportive regulatory landscape is enabling innovation and expansion.
- Growing Consumer Demand: Increased awareness and demand for digital insurance solutions fuel market growth.
- Dominant Segment: The personal lines insurance segment (auto and home) currently constitutes the largest segment, driven by high consumer adoption and ease of digitalization. This trend is expected to continue throughout the forecast period. The health insurance segment is also growing rapidly, driven by increased health awareness and technological advancements enabling remote health solutions.
USA Insurtech Industry Product Developments
The Insurtech industry is characterized by continuous product innovation, with new applications and services emerging regularly. These developments leverage advancements in AI, machine learning, blockchain, and other technologies to enhance efficiency, personalize offerings, and improve customer experience. Key developments include the incorporation of telematics data into auto insurance pricing and the rise of digital-only health insurance providers offering personalized plans and remote healthcare access. These innovations aim to improve both the efficiency and affordability of insurance offerings while also catering to the evolving preferences of modern consumers.
Report Scope & Segmentation Analysis
This report segments the US Insurtech market by several factors, including:
- Insurance Type: Auto, Health, Life, Homeowners, Commercial. Each segment is analyzed in terms of growth projections, market size, and competitive dynamics. The health insurance segment is expected to experience significant growth during the forecast period, driven by rising healthcare costs and increasing demand for affordable and accessible health plans.
- Distribution Channel: Direct-to-consumer, brokers/agents, partnerships. The direct-to-consumer channel is growing rapidly, driven by consumer preference for digital and self-service options.
Key Drivers of USA Insurtech Industry Growth
Several key factors drive the growth of the US Insurtech industry. Technological advancements such as AI, machine learning, and blockchain are improving efficiency, personalization, and risk assessment. Favorable regulatory environments are fostering innovation and competition. Increasing consumer demand for convenient, transparent, and digitally-driven insurance solutions fuels market expansion. The growing adoption of mobile technology and digital platforms further accelerates market growth.
Challenges in the USA Insurtech Industry Sector
Despite the positive growth outlook, the US Insurtech industry faces several challenges. Regulatory hurdles and compliance requirements present significant barriers to entry and market expansion. Cybersecurity risks and data privacy concerns are also paramount. Intense competition from established insurers and other Insurtech players poses a significant challenge. The need for substantial investment in technology and infrastructure represents a significant financial barrier. Maintaining consumer trust and ensuring data security are critical to overcoming these challenges.
Emerging Opportunities in USA Insurtech Industry
The US Insurtech market presents several emerging opportunities. Expansion into underserved markets, leveraging innovative technologies like IoT and blockchain, and addressing specific consumer needs can unlock significant growth potential. Focusing on niche insurance products like parametric insurance and developing personalized solutions through AI can further broaden market reach. Exploring opportunities in embedded insurance and strategic partnerships with other fintech players can also drive market expansion.
Leading Players in the USA Insurtech Industry Market
- Gusto
- Oscar
- Bright Health
- Clover Health
- Root Insurance
- American Well
- Lemonade
- Outsystems
- Next Insurance
- Metromile
- Hippo
- List Not Exhaustive
Key Developments in USA Insurtech Industry Industry
- March 2023: Duck Creek Technologies, a provider of intelligent solutions for P&C and general insurance, was acquired by Vista Equity Partners. This acquisition strengthens Duck Creek's position in the market and expands its capabilities.
- January 2023: Encora, a global next-gen product engineering provider, acquired Excellarate, a technology solutions and services company. This acquisition enhances Encora's capabilities in AI, analytics, and automation and expands its expertise in HealthTech, FinTech, and InsurTech.
Strategic Outlook for USA Insurtech Industry Market
The US Insurtech market is poised for continued growth, driven by technological advancements, evolving consumer preferences, and increasing demand for digital insurance solutions. Strategic partnerships, acquisitions, and investments in innovative technologies will be key to maintaining competitiveness and expanding market share. Companies that can effectively leverage data analytics, personalize their offerings, and ensure a seamless customer experience will be well-positioned to succeed in this dynamic market. The focus on innovation, strategic partnerships, and regulatory compliance will determine the success of companies in this rapidly evolving sector.
USA Insurtech Industry Segmentation
-
1. Business Model
- 1.1. Carrier
- 1.2. Enabler
- 1.3. Distributor
-
2. Insurance Type
- 2.1. Life Insurance
- 2.2. Non-Life Insurance
USA Insurtech Industry Segmentation By Geography
-
1. North America
- 1.1. United States
- 1.2. Canada
- 1.3. Mexico
-
2. South America
- 2.1. Brazil
- 2.2. Argentina
- 2.3. Rest of South America
-
3. Europe
- 3.1. United Kingdom
- 3.2. Germany
- 3.3. France
- 3.4. Italy
- 3.5. Spain
- 3.6. Russia
- 3.7. Benelux
- 3.8. Nordics
- 3.9. Rest of Europe
-
4. Middle East & Africa
- 4.1. Turkey
- 4.2. Israel
- 4.3. GCC
- 4.4. North Africa
- 4.5. South Africa
- 4.6. Rest of Middle East & Africa
-
5. Asia Pacific
- 5.1. China
- 5.2. India
- 5.3. Japan
- 5.4. South Korea
- 5.5. ASEAN
- 5.6. Oceania
- 5.7. Rest of Asia Pacific

USA Insurtech Industry Regional Market Share
Geographic Coverage of USA Insurtech Industry
USA Insurtech Industry REPORT HIGHLIGHTS
| Aspects | Details |
|---|---|
| Study Period | 2020-2034 |
| Base Year | 2025 |
| Estimated Year | 2026 |
| Forecast Period | 2026-2034 |
| Historical Period | 2020-2025 |
| Growth Rate | CAGR of > 6.00% from 2020-2034 |
| Segmentation |
|
Table of Contents
- 1. Introduction
- 1.1. Research Scope
- 1.2. Market Segmentation
- 1.3. Research Methodology
- 1.4. Definitions and Assumptions
- 2. Executive Summary
- 2.1. Introduction
- 3. Market Dynamics
- 3.1. Introduction
- 3.2. Market Drivers
- 3.2.1. Growing Demand for Data Analytics and Artificial Intelligence; Increasing Adoption of Digital Technologies
- 3.3. Market Restrains
- 3.3.1. Growing Demand for Data Analytics and Artificial Intelligence; Increasing Adoption of Digital Technologies
- 3.4. Market Trends
- 3.4.1. Surged Funding towards Insurtech Companies
- 4. Market Factor Analysis
- 4.1. Porters Five Forces
- 4.2. Supply/Value Chain
- 4.3. PESTEL analysis
- 4.4. Market Entropy
- 4.5. Patent/Trademark Analysis
- 5. Global USA Insurtech Industry Analysis, Insights and Forecast, 2020-2032
- 5.1. Market Analysis, Insights and Forecast - by Business Model
- 5.1.1. Carrier
- 5.1.2. Enabler
- 5.1.3. Distributor
- 5.2. Market Analysis, Insights and Forecast - by Insurance Type
- 5.2.1. Life Insurance
- 5.2.2. Non-Life Insurance
- 5.3. Market Analysis, Insights and Forecast - by Region
- 5.3.1. North America
- 5.3.2. South America
- 5.3.3. Europe
- 5.3.4. Middle East & Africa
- 5.3.5. Asia Pacific
- 5.1. Market Analysis, Insights and Forecast - by Business Model
- 6. North America USA Insurtech Industry Analysis, Insights and Forecast, 2020-2032
- 6.1. Market Analysis, Insights and Forecast - by Business Model
- 6.1.1. Carrier
- 6.1.2. Enabler
- 6.1.3. Distributor
- 6.2. Market Analysis, Insights and Forecast - by Insurance Type
- 6.2.1. Life Insurance
- 6.2.2. Non-Life Insurance
- 6.1. Market Analysis, Insights and Forecast - by Business Model
- 7. South America USA Insurtech Industry Analysis, Insights and Forecast, 2020-2032
- 7.1. Market Analysis, Insights and Forecast - by Business Model
- 7.1.1. Carrier
- 7.1.2. Enabler
- 7.1.3. Distributor
- 7.2. Market Analysis, Insights and Forecast - by Insurance Type
- 7.2.1. Life Insurance
- 7.2.2. Non-Life Insurance
- 7.1. Market Analysis, Insights and Forecast - by Business Model
- 8. Europe USA Insurtech Industry Analysis, Insights and Forecast, 2020-2032
- 8.1. Market Analysis, Insights and Forecast - by Business Model
- 8.1.1. Carrier
- 8.1.2. Enabler
- 8.1.3. Distributor
- 8.2. Market Analysis, Insights and Forecast - by Insurance Type
- 8.2.1. Life Insurance
- 8.2.2. Non-Life Insurance
- 8.1. Market Analysis, Insights and Forecast - by Business Model
- 9. Middle East & Africa USA Insurtech Industry Analysis, Insights and Forecast, 2020-2032
- 9.1. Market Analysis, Insights and Forecast - by Business Model
- 9.1.1. Carrier
- 9.1.2. Enabler
- 9.1.3. Distributor
- 9.2. Market Analysis, Insights and Forecast - by Insurance Type
- 9.2.1. Life Insurance
- 9.2.2. Non-Life Insurance
- 9.1. Market Analysis, Insights and Forecast - by Business Model
- 10. Asia Pacific USA Insurtech Industry Analysis, Insights and Forecast, 2020-2032
- 10.1. Market Analysis, Insights and Forecast - by Business Model
- 10.1.1. Carrier
- 10.1.2. Enabler
- 10.1.3. Distributor
- 10.2. Market Analysis, Insights and Forecast - by Insurance Type
- 10.2.1. Life Insurance
- 10.2.2. Non-Life Insurance
- 10.1. Market Analysis, Insights and Forecast - by Business Model
- 11. Competitive Analysis
- 11.1. Global Market Share Analysis 2025
- 11.2. Company Profiles
- 11.2.1 Gusto
- 11.2.1.1. Overview
- 11.2.1.2. Products
- 11.2.1.3. SWOT Analysis
- 11.2.1.4. Recent Developments
- 11.2.1.5. Financials (Based on Availability)
- 11.2.2 Oscar
- 11.2.2.1. Overview
- 11.2.2.2. Products
- 11.2.2.3. SWOT Analysis
- 11.2.2.4. Recent Developments
- 11.2.2.5. Financials (Based on Availability)
- 11.2.3 Bright Health
- 11.2.3.1. Overview
- 11.2.3.2. Products
- 11.2.3.3. SWOT Analysis
- 11.2.3.4. Recent Developments
- 11.2.3.5. Financials (Based on Availability)
- 11.2.4 Clover Health
- 11.2.4.1. Overview
- 11.2.4.2. Products
- 11.2.4.3. SWOT Analysis
- 11.2.4.4. Recent Developments
- 11.2.4.5. Financials (Based on Availability)
- 11.2.5 Root Insurance
- 11.2.5.1. Overview
- 11.2.5.2. Products
- 11.2.5.3. SWOT Analysis
- 11.2.5.4. Recent Developments
- 11.2.5.5. Financials (Based on Availability)
- 11.2.6 American Well
- 11.2.6.1. Overview
- 11.2.6.2. Products
- 11.2.6.3. SWOT Analysis
- 11.2.6.4. Recent Developments
- 11.2.6.5. Financials (Based on Availability)
- 11.2.7 Lemonade
- 11.2.7.1. Overview
- 11.2.7.2. Products
- 11.2.7.3. SWOT Analysis
- 11.2.7.4. Recent Developments
- 11.2.7.5. Financials (Based on Availability)
- 11.2.8 Outsystems
- 11.2.8.1. Overview
- 11.2.8.2. Products
- 11.2.8.3. SWOT Analysis
- 11.2.8.4. Recent Developments
- 11.2.8.5. Financials (Based on Availability)
- 11.2.9 Next Insurance
- 11.2.9.1. Overview
- 11.2.9.2. Products
- 11.2.9.3. SWOT Analysis
- 11.2.9.4. Recent Developments
- 11.2.9.5. Financials (Based on Availability)
- 11.2.10 Metromile
- 11.2.10.1. Overview
- 11.2.10.2. Products
- 11.2.10.3. SWOT Analysis
- 11.2.10.4. Recent Developments
- 11.2.10.5. Financials (Based on Availability)
- 11.2.11 Hippo**List Not Exhaustive
- 11.2.11.1. Overview
- 11.2.11.2. Products
- 11.2.11.3. SWOT Analysis
- 11.2.11.4. Recent Developments
- 11.2.11.5. Financials (Based on Availability)
- 11.2.1 Gusto
List of Figures
- Figure 1: Global USA Insurtech Industry Revenue Breakdown (Million, %) by Region 2025 & 2033
- Figure 2: Global USA Insurtech Industry Volume Breakdown (Billion, %) by Region 2025 & 2033
- Figure 3: North America USA Insurtech Industry Revenue (Million), by Business Model 2025 & 2033
- Figure 4: North America USA Insurtech Industry Volume (Billion), by Business Model 2025 & 2033
- Figure 5: North America USA Insurtech Industry Revenue Share (%), by Business Model 2025 & 2033
- Figure 6: North America USA Insurtech Industry Volume Share (%), by Business Model 2025 & 2033
- Figure 7: North America USA Insurtech Industry Revenue (Million), by Insurance Type 2025 & 2033
- Figure 8: North America USA Insurtech Industry Volume (Billion), by Insurance Type 2025 & 2033
- Figure 9: North America USA Insurtech Industry Revenue Share (%), by Insurance Type 2025 & 2033
- Figure 10: North America USA Insurtech Industry Volume Share (%), by Insurance Type 2025 & 2033
- Figure 11: North America USA Insurtech Industry Revenue (Million), by Country 2025 & 2033
- Figure 12: North America USA Insurtech Industry Volume (Billion), by Country 2025 & 2033
- Figure 13: North America USA Insurtech Industry Revenue Share (%), by Country 2025 & 2033
- Figure 14: North America USA Insurtech Industry Volume Share (%), by Country 2025 & 2033
- Figure 15: South America USA Insurtech Industry Revenue (Million), by Business Model 2025 & 2033
- Figure 16: South America USA Insurtech Industry Volume (Billion), by Business Model 2025 & 2033
- Figure 17: South America USA Insurtech Industry Revenue Share (%), by Business Model 2025 & 2033
- Figure 18: South America USA Insurtech Industry Volume Share (%), by Business Model 2025 & 2033
- Figure 19: South America USA Insurtech Industry Revenue (Million), by Insurance Type 2025 & 2033
- Figure 20: South America USA Insurtech Industry Volume (Billion), by Insurance Type 2025 & 2033
- Figure 21: South America USA Insurtech Industry Revenue Share (%), by Insurance Type 2025 & 2033
- Figure 22: South America USA Insurtech Industry Volume Share (%), by Insurance Type 2025 & 2033
- Figure 23: South America USA Insurtech Industry Revenue (Million), by Country 2025 & 2033
- Figure 24: South America USA Insurtech Industry Volume (Billion), by Country 2025 & 2033
- Figure 25: South America USA Insurtech Industry Revenue Share (%), by Country 2025 & 2033
- Figure 26: South America USA Insurtech Industry Volume Share (%), by Country 2025 & 2033
- Figure 27: Europe USA Insurtech Industry Revenue (Million), by Business Model 2025 & 2033
- Figure 28: Europe USA Insurtech Industry Volume (Billion), by Business Model 2025 & 2033
- Figure 29: Europe USA Insurtech Industry Revenue Share (%), by Business Model 2025 & 2033
- Figure 30: Europe USA Insurtech Industry Volume Share (%), by Business Model 2025 & 2033
- Figure 31: Europe USA Insurtech Industry Revenue (Million), by Insurance Type 2025 & 2033
- Figure 32: Europe USA Insurtech Industry Volume (Billion), by Insurance Type 2025 & 2033
- Figure 33: Europe USA Insurtech Industry Revenue Share (%), by Insurance Type 2025 & 2033
- Figure 34: Europe USA Insurtech Industry Volume Share (%), by Insurance Type 2025 & 2033
- Figure 35: Europe USA Insurtech Industry Revenue (Million), by Country 2025 & 2033
- Figure 36: Europe USA Insurtech Industry Volume (Billion), by Country 2025 & 2033
- Figure 37: Europe USA Insurtech Industry Revenue Share (%), by Country 2025 & 2033
- Figure 38: Europe USA Insurtech Industry Volume Share (%), by Country 2025 & 2033
- Figure 39: Middle East & Africa USA Insurtech Industry Revenue (Million), by Business Model 2025 & 2033
- Figure 40: Middle East & Africa USA Insurtech Industry Volume (Billion), by Business Model 2025 & 2033
- Figure 41: Middle East & Africa USA Insurtech Industry Revenue Share (%), by Business Model 2025 & 2033
- Figure 42: Middle East & Africa USA Insurtech Industry Volume Share (%), by Business Model 2025 & 2033
- Figure 43: Middle East & Africa USA Insurtech Industry Revenue (Million), by Insurance Type 2025 & 2033
- Figure 44: Middle East & Africa USA Insurtech Industry Volume (Billion), by Insurance Type 2025 & 2033
- Figure 45: Middle East & Africa USA Insurtech Industry Revenue Share (%), by Insurance Type 2025 & 2033
- Figure 46: Middle East & Africa USA Insurtech Industry Volume Share (%), by Insurance Type 2025 & 2033
- Figure 47: Middle East & Africa USA Insurtech Industry Revenue (Million), by Country 2025 & 2033
- Figure 48: Middle East & Africa USA Insurtech Industry Volume (Billion), by Country 2025 & 2033
- Figure 49: Middle East & Africa USA Insurtech Industry Revenue Share (%), by Country 2025 & 2033
- Figure 50: Middle East & Africa USA Insurtech Industry Volume Share (%), by Country 2025 & 2033
- Figure 51: Asia Pacific USA Insurtech Industry Revenue (Million), by Business Model 2025 & 2033
- Figure 52: Asia Pacific USA Insurtech Industry Volume (Billion), by Business Model 2025 & 2033
- Figure 53: Asia Pacific USA Insurtech Industry Revenue Share (%), by Business Model 2025 & 2033
- Figure 54: Asia Pacific USA Insurtech Industry Volume Share (%), by Business Model 2025 & 2033
- Figure 55: Asia Pacific USA Insurtech Industry Revenue (Million), by Insurance Type 2025 & 2033
- Figure 56: Asia Pacific USA Insurtech Industry Volume (Billion), by Insurance Type 2025 & 2033
- Figure 57: Asia Pacific USA Insurtech Industry Revenue Share (%), by Insurance Type 2025 & 2033
- Figure 58: Asia Pacific USA Insurtech Industry Volume Share (%), by Insurance Type 2025 & 2033
- Figure 59: Asia Pacific USA Insurtech Industry Revenue (Million), by Country 2025 & 2033
- Figure 60: Asia Pacific USA Insurtech Industry Volume (Billion), by Country 2025 & 2033
- Figure 61: Asia Pacific USA Insurtech Industry Revenue Share (%), by Country 2025 & 2033
- Figure 62: Asia Pacific USA Insurtech Industry Volume Share (%), by Country 2025 & 2033
List of Tables
- Table 1: Global USA Insurtech Industry Revenue Million Forecast, by Business Model 2020 & 2033
- Table 2: Global USA Insurtech Industry Volume Billion Forecast, by Business Model 2020 & 2033
- Table 3: Global USA Insurtech Industry Revenue Million Forecast, by Insurance Type 2020 & 2033
- Table 4: Global USA Insurtech Industry Volume Billion Forecast, by Insurance Type 2020 & 2033
- Table 5: Global USA Insurtech Industry Revenue Million Forecast, by Region 2020 & 2033
- Table 6: Global USA Insurtech Industry Volume Billion Forecast, by Region 2020 & 2033
- Table 7: Global USA Insurtech Industry Revenue Million Forecast, by Business Model 2020 & 2033
- Table 8: Global USA Insurtech Industry Volume Billion Forecast, by Business Model 2020 & 2033
- Table 9: Global USA Insurtech Industry Revenue Million Forecast, by Insurance Type 2020 & 2033
- Table 10: Global USA Insurtech Industry Volume Billion Forecast, by Insurance Type 2020 & 2033
- Table 11: Global USA Insurtech Industry Revenue Million Forecast, by Country 2020 & 2033
- Table 12: Global USA Insurtech Industry Volume Billion Forecast, by Country 2020 & 2033
- Table 13: United States USA Insurtech Industry Revenue (Million) Forecast, by Application 2020 & 2033
- Table 14: United States USA Insurtech Industry Volume (Billion) Forecast, by Application 2020 & 2033
- Table 15: Canada USA Insurtech Industry Revenue (Million) Forecast, by Application 2020 & 2033
- Table 16: Canada USA Insurtech Industry Volume (Billion) Forecast, by Application 2020 & 2033
- Table 17: Mexico USA Insurtech Industry Revenue (Million) Forecast, by Application 2020 & 2033
- Table 18: Mexico USA Insurtech Industry Volume (Billion) Forecast, by Application 2020 & 2033
- Table 19: Global USA Insurtech Industry Revenue Million Forecast, by Business Model 2020 & 2033
- Table 20: Global USA Insurtech Industry Volume Billion Forecast, by Business Model 2020 & 2033
- Table 21: Global USA Insurtech Industry Revenue Million Forecast, by Insurance Type 2020 & 2033
- Table 22: Global USA Insurtech Industry Volume Billion Forecast, by Insurance Type 2020 & 2033
- Table 23: Global USA Insurtech Industry Revenue Million Forecast, by Country 2020 & 2033
- Table 24: Global USA Insurtech Industry Volume Billion Forecast, by Country 2020 & 2033
- Table 25: Brazil USA Insurtech Industry Revenue (Million) Forecast, by Application 2020 & 2033
- Table 26: Brazil USA Insurtech Industry Volume (Billion) Forecast, by Application 2020 & 2033
- Table 27: Argentina USA Insurtech Industry Revenue (Million) Forecast, by Application 2020 & 2033
- Table 28: Argentina USA Insurtech Industry Volume (Billion) Forecast, by Application 2020 & 2033
- Table 29: Rest of South America USA Insurtech Industry Revenue (Million) Forecast, by Application 2020 & 2033
- Table 30: Rest of South America USA Insurtech Industry Volume (Billion) Forecast, by Application 2020 & 2033
- Table 31: Global USA Insurtech Industry Revenue Million Forecast, by Business Model 2020 & 2033
- Table 32: Global USA Insurtech Industry Volume Billion Forecast, by Business Model 2020 & 2033
- Table 33: Global USA Insurtech Industry Revenue Million Forecast, by Insurance Type 2020 & 2033
- Table 34: Global USA Insurtech Industry Volume Billion Forecast, by Insurance Type 2020 & 2033
- Table 35: Global USA Insurtech Industry Revenue Million Forecast, by Country 2020 & 2033
- Table 36: Global USA Insurtech Industry Volume Billion Forecast, by Country 2020 & 2033
- Table 37: United Kingdom USA Insurtech Industry Revenue (Million) Forecast, by Application 2020 & 2033
- Table 38: United Kingdom USA Insurtech Industry Volume (Billion) Forecast, by Application 2020 & 2033
- Table 39: Germany USA Insurtech Industry Revenue (Million) Forecast, by Application 2020 & 2033
- Table 40: Germany USA Insurtech Industry Volume (Billion) Forecast, by Application 2020 & 2033
- Table 41: France USA Insurtech Industry Revenue (Million) Forecast, by Application 2020 & 2033
- Table 42: France USA Insurtech Industry Volume (Billion) Forecast, by Application 2020 & 2033
- Table 43: Italy USA Insurtech Industry Revenue (Million) Forecast, by Application 2020 & 2033
- Table 44: Italy USA Insurtech Industry Volume (Billion) Forecast, by Application 2020 & 2033
- Table 45: Spain USA Insurtech Industry Revenue (Million) Forecast, by Application 2020 & 2033
- Table 46: Spain USA Insurtech Industry Volume (Billion) Forecast, by Application 2020 & 2033
- Table 47: Russia USA Insurtech Industry Revenue (Million) Forecast, by Application 2020 & 2033
- Table 48: Russia USA Insurtech Industry Volume (Billion) Forecast, by Application 2020 & 2033
- Table 49: Benelux USA Insurtech Industry Revenue (Million) Forecast, by Application 2020 & 2033
- Table 50: Benelux USA Insurtech Industry Volume (Billion) Forecast, by Application 2020 & 2033
- Table 51: Nordics USA Insurtech Industry Revenue (Million) Forecast, by Application 2020 & 2033
- Table 52: Nordics USA Insurtech Industry Volume (Billion) Forecast, by Application 2020 & 2033
- Table 53: Rest of Europe USA Insurtech Industry Revenue (Million) Forecast, by Application 2020 & 2033
- Table 54: Rest of Europe USA Insurtech Industry Volume (Billion) Forecast, by Application 2020 & 2033
- Table 55: Global USA Insurtech Industry Revenue Million Forecast, by Business Model 2020 & 2033
- Table 56: Global USA Insurtech Industry Volume Billion Forecast, by Business Model 2020 & 2033
- Table 57: Global USA Insurtech Industry Revenue Million Forecast, by Insurance Type 2020 & 2033
- Table 58: Global USA Insurtech Industry Volume Billion Forecast, by Insurance Type 2020 & 2033
- Table 59: Global USA Insurtech Industry Revenue Million Forecast, by Country 2020 & 2033
- Table 60: Global USA Insurtech Industry Volume Billion Forecast, by Country 2020 & 2033
- Table 61: Turkey USA Insurtech Industry Revenue (Million) Forecast, by Application 2020 & 2033
- Table 62: Turkey USA Insurtech Industry Volume (Billion) Forecast, by Application 2020 & 2033
- Table 63: Israel USA Insurtech Industry Revenue (Million) Forecast, by Application 2020 & 2033
- Table 64: Israel USA Insurtech Industry Volume (Billion) Forecast, by Application 2020 & 2033
- Table 65: GCC USA Insurtech Industry Revenue (Million) Forecast, by Application 2020 & 2033
- Table 66: GCC USA Insurtech Industry Volume (Billion) Forecast, by Application 2020 & 2033
- Table 67: North Africa USA Insurtech Industry Revenue (Million) Forecast, by Application 2020 & 2033
- Table 68: North Africa USA Insurtech Industry Volume (Billion) Forecast, by Application 2020 & 2033
- Table 69: South Africa USA Insurtech Industry Revenue (Million) Forecast, by Application 2020 & 2033
- Table 70: South Africa USA Insurtech Industry Volume (Billion) Forecast, by Application 2020 & 2033
- Table 71: Rest of Middle East & Africa USA Insurtech Industry Revenue (Million) Forecast, by Application 2020 & 2033
- Table 72: Rest of Middle East & Africa USA Insurtech Industry Volume (Billion) Forecast, by Application 2020 & 2033
- Table 73: Global USA Insurtech Industry Revenue Million Forecast, by Business Model 2020 & 2033
- Table 74: Global USA Insurtech Industry Volume Billion Forecast, by Business Model 2020 & 2033
- Table 75: Global USA Insurtech Industry Revenue Million Forecast, by Insurance Type 2020 & 2033
- Table 76: Global USA Insurtech Industry Volume Billion Forecast, by Insurance Type 2020 & 2033
- Table 77: Global USA Insurtech Industry Revenue Million Forecast, by Country 2020 & 2033
- Table 78: Global USA Insurtech Industry Volume Billion Forecast, by Country 2020 & 2033
- Table 79: China USA Insurtech Industry Revenue (Million) Forecast, by Application 2020 & 2033
- Table 80: China USA Insurtech Industry Volume (Billion) Forecast, by Application 2020 & 2033
- Table 81: India USA Insurtech Industry Revenue (Million) Forecast, by Application 2020 & 2033
- Table 82: India USA Insurtech Industry Volume (Billion) Forecast, by Application 2020 & 2033
- Table 83: Japan USA Insurtech Industry Revenue (Million) Forecast, by Application 2020 & 2033
- Table 84: Japan USA Insurtech Industry Volume (Billion) Forecast, by Application 2020 & 2033
- Table 85: South Korea USA Insurtech Industry Revenue (Million) Forecast, by Application 2020 & 2033
- Table 86: South Korea USA Insurtech Industry Volume (Billion) Forecast, by Application 2020 & 2033
- Table 87: ASEAN USA Insurtech Industry Revenue (Million) Forecast, by Application 2020 & 2033
- Table 88: ASEAN USA Insurtech Industry Volume (Billion) Forecast, by Application 2020 & 2033
- Table 89: Oceania USA Insurtech Industry Revenue (Million) Forecast, by Application 2020 & 2033
- Table 90: Oceania USA Insurtech Industry Volume (Billion) Forecast, by Application 2020 & 2033
- Table 91: Rest of Asia Pacific USA Insurtech Industry Revenue (Million) Forecast, by Application 2020 & 2033
- Table 92: Rest of Asia Pacific USA Insurtech Industry Volume (Billion) Forecast, by Application 2020 & 2033
Frequently Asked Questions
1. What is the projected Compound Annual Growth Rate (CAGR) of the USA Insurtech Industry?
The projected CAGR is approximately > 6.00%.
2. Which companies are prominent players in the USA Insurtech Industry?
Key companies in the market include Gusto, Oscar, Bright Health, Clover Health, Root Insurance, American Well, Lemonade, Outsystems, Next Insurance, Metromile, Hippo**List Not Exhaustive.
3. What are the main segments of the USA Insurtech Industry?
The market segments include Business Model, Insurance Type.
4. Can you provide details about the market size?
The market size is estimated to be USD 49.82 Million as of 2022.
5. What are some drivers contributing to market growth?
Growing Demand for Data Analytics and Artificial Intelligence; Increasing Adoption of Digital Technologies.
6. What are the notable trends driving market growth?
Surged Funding towards Insurtech Companies.
7. Are there any restraints impacting market growth?
Growing Demand for Data Analytics and Artificial Intelligence; Increasing Adoption of Digital Technologies.
8. Can you provide examples of recent developments in the market?
March 2023: Duck Creek Technologies, the intelligent solutions provider defining the future of property and casualty (P&C) and general insurance acquired by Vista Equity Partners, a leading global investment firm.
9. What pricing options are available for accessing the report?
Pricing options include single-user, multi-user, and enterprise licenses priced at USD 3800, USD 4500, and USD 5800 respectively.
10. Is the market size provided in terms of value or volume?
The market size is provided in terms of value, measured in Million and volume, measured in Billion.
11. Are there any specific market keywords associated with the report?
Yes, the market keyword associated with the report is "USA Insurtech Industry," which aids in identifying and referencing the specific market segment covered.
12. How do I determine which pricing option suits my needs best?
The pricing options vary based on user requirements and access needs. Individual users may opt for single-user licenses, while businesses requiring broader access may choose multi-user or enterprise licenses for cost-effective access to the report.
13. Are there any additional resources or data provided in the USA Insurtech Industry report?
While the report offers comprehensive insights, it's advisable to review the specific contents or supplementary materials provided to ascertain if additional resources or data are available.
14. How can I stay updated on further developments or reports in the USA Insurtech Industry?
To stay informed about further developments, trends, and reports in the USA Insurtech Industry, consider subscribing to industry newsletters, following relevant companies and organizations, or regularly checking reputable industry news sources and publications.
Methodology
Step 1 - Identification of Relevant Samples Size from Population Database


Step 2 - Approaches for Defining Global Market Size (Value, Volume* & Price*)

Note*: In applicable scenarios
Step 3 - Data Sources
Primary Research
- Web Analytics
- Survey Reports
- Research Institute
- Latest Research Reports
- Opinion Leaders
Secondary Research
- Annual Reports
- White Paper
- Latest Press Release
- Industry Association
- Paid Database
- Investor Presentations

Step 4 - Data Triangulation
Involves using different sources of information in order to increase the validity of a study
These sources are likely to be stakeholders in a program - participants, other researchers, program staff, other community members, and so on.
Then we put all data in single framework & apply various statistical tools to find out the dynamic on the market.
During the analysis stage, feedback from the stakeholder groups would be compared to determine areas of agreement as well as areas of divergence