

Key Insights
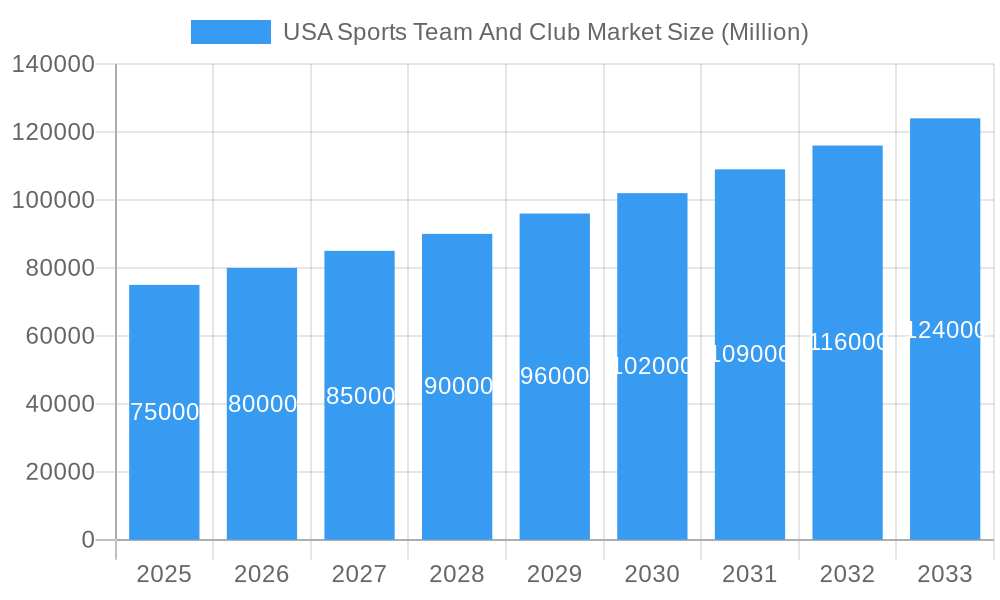
The U.S. Sports Team and Club Market is poised for significant expansion, projecting a Compound Annual Growth Rate (CAGR) of 8.6%. With a current market size estimated at $48.9 billion in the base year 2025, this industry thrives on escalating media consumption across digital platforms, robust fan engagement with major leagues (NFL, MLB, NBA, NHL) and collegiate sports, and strategic brand partnerships. Key revenue streams include media rights, merchandising, ticket sales, and sponsorships. While economic volatility and evolving fan engagement strategies present challenges, the market's inherent appeal and growth potential are substantial.
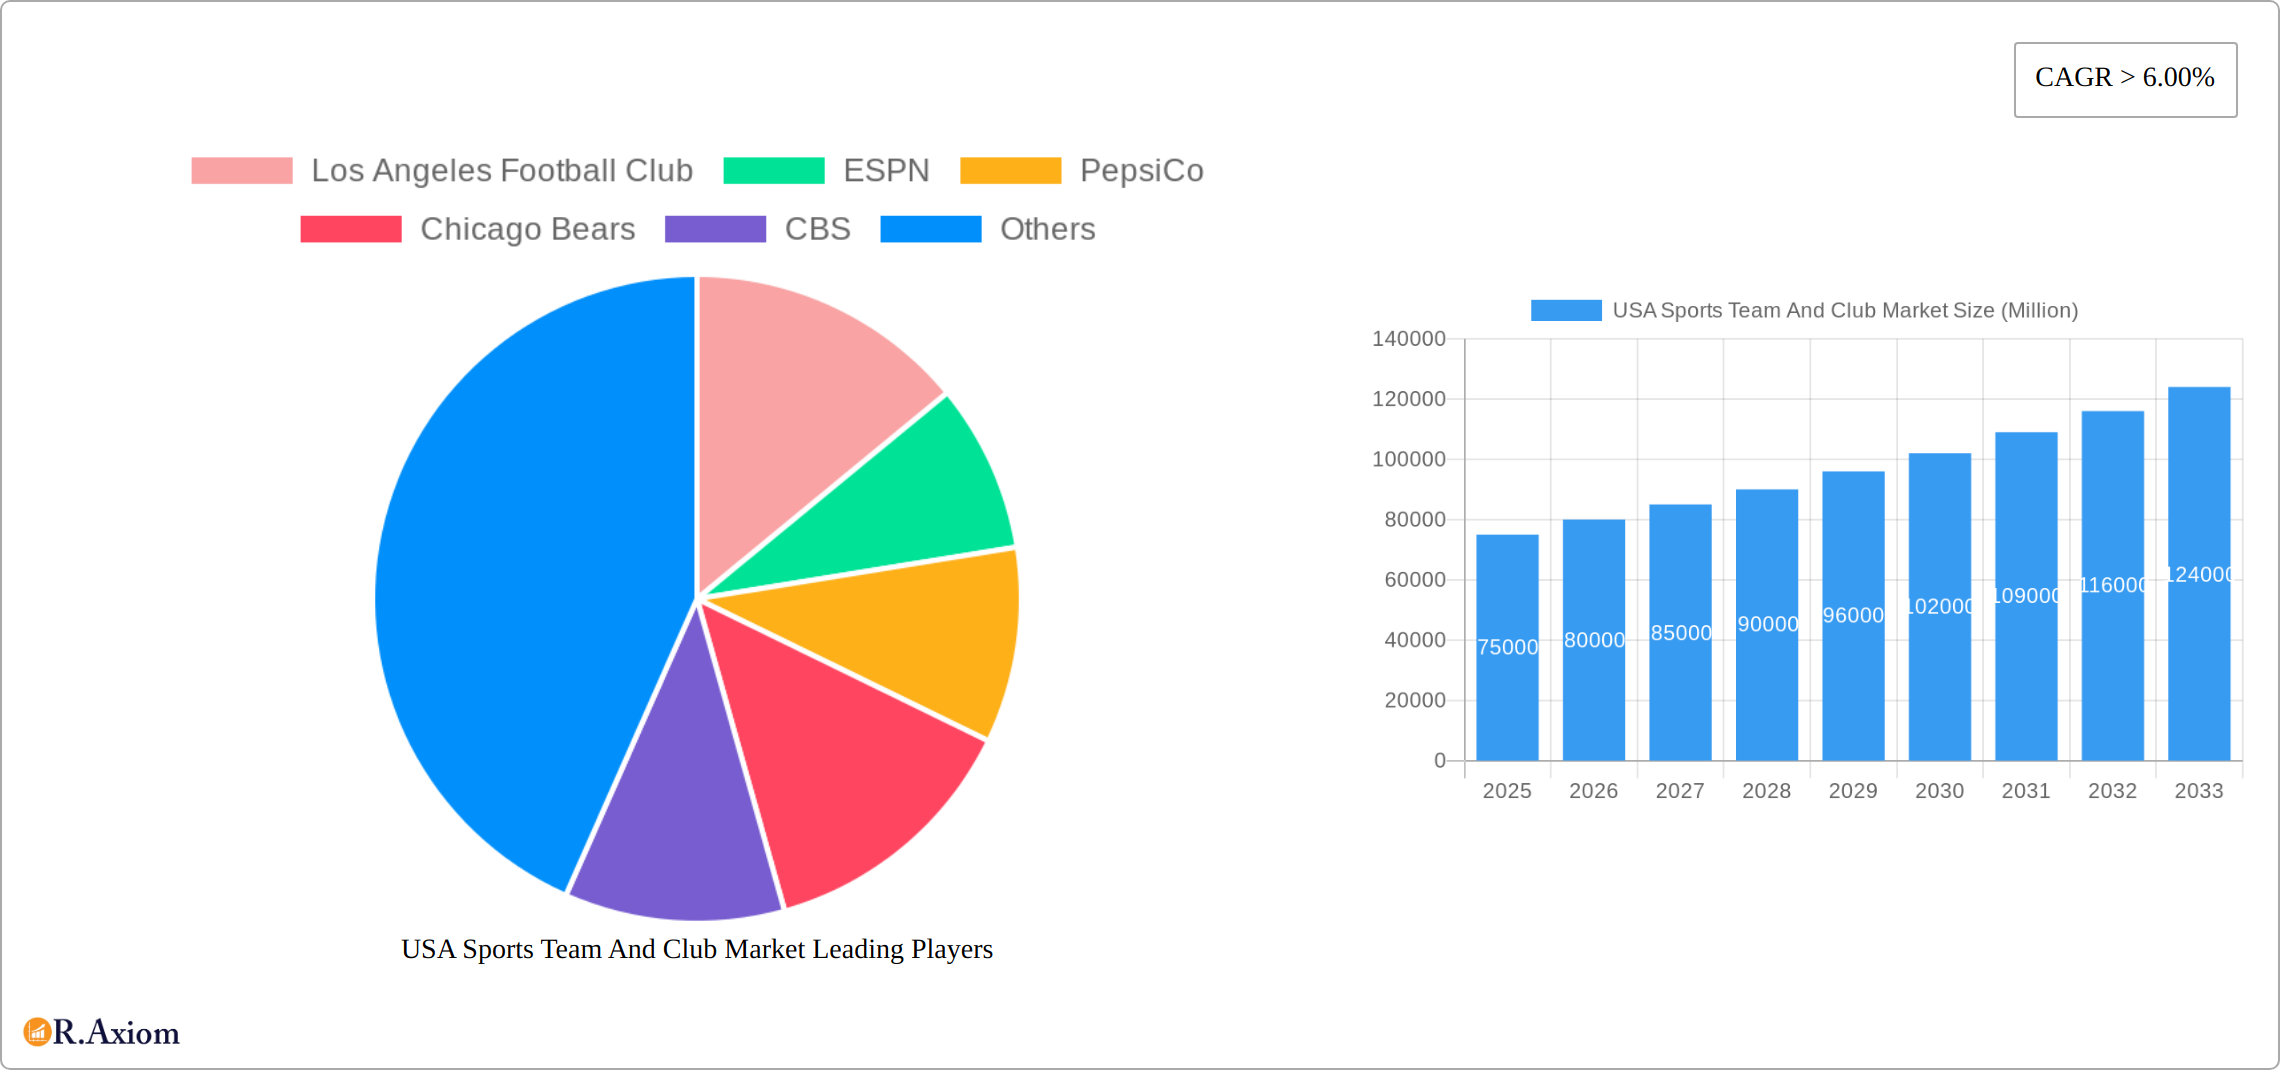
USA Sports Team And Club Market Market Size (In Billion)
Revenue from media rights is anticipated to lead market growth, supported by merchandising and ticket sales. Football, basketball, and baseball are expected to command the largest market shares. Opportunities abound for enhancing fan experience through technology, optimizing marketing with data analytics, and tapping into emerging sports and e-sports. The U.S. will continue to dominate the North American market, with strategic expansion into underserved regions being crucial for sustained growth. By 2033, the market is projected to reach new heights, driven by innovation and unwavering fan loyalty.
USA Sports Team And Club Market Company Market Share
USA Sports Team and Club Market: A Comprehensive Report (2019-2033)
This in-depth report provides a comprehensive analysis of the USA Sports Team and Club Market, covering the period from 2019 to 2033. It delves into market dynamics, key players, emerging trends, and future growth opportunities, offering valuable insights for industry stakeholders, investors, and strategic decision-makers. The report utilizes a robust methodology, incorporating historical data (2019-2024), a base year of 2025, and forecasts extending to 2033. Market values are expressed in Millions USD.
USA Sports Team And Club Market Market Concentration & Innovation
The USA Sports Team and Club Market is characterized by a robust, yet moderately concentrated structure. A select group of powerhouse franchises and major sports leagues command a significant portion of market share, fueled by deep-rooted fan bases and substantial media rights deals. While precise market share figures are dynamic and often proprietary, the landscape includes both venerable, established entities (such as the Dallas Cowboys and Chicago Bears) and agile, newer organizations that are actively innovating to capture market share and fan loyalty. Innovation is a critical differentiator, primarily driven by the pervasive integration of technology. This includes the development of immersive fan engagement platforms, featuring high-definition streaming, interactive mobile applications, and augmented reality experiences. Furthermore, sophisticated data analytics are revolutionizing player performance optimization, scouting, and strategic decision-making. Stadium technology is also a key area of innovation, with advancements in connectivity, in-seat ordering, and immersive entertainment. The market's competitive dynamics are significantly shaped by a comprehensive regulatory framework, encompassing antitrust legislation designed to ensure fair competition and broadcast regulations that govern media rights. Product substitutes, such as the rapidly growing esports industry and other forms of entertainment, present an ongoing competitive challenge. However, the unparalleled emotional connection and communal experience offered by live sports create a formidable barrier to entry for these substitutes. End-user trends highlight a pronounced shift towards hyper-personalized fan experiences and seamless digital accessibility across all touchpoints. This demand is prompting strategic merger and acquisition (M&A) activities, reflecting a broader trend towards consolidation, diversification, and strategic expansion to secure market leadership. Recent notable deal values underscore this trend, with transactions such as Liberty Media's acquisition of QuintEvents for over USD 300 million demonstrating significant investment and confidence in the sector's continued growth and potential.
- Market Concentration: The market exhibits moderate to high concentration, with a few dominant teams and leagues holding substantial influence. Detailed proprietary market share data is available in the comprehensive market report.
- Innovation Drivers: Key drivers include cutting-edge technological advancements in fan engagement, sophisticated data analytics for performance and strategy, and the evolution of stadium technology to enhance spectator experiences.
- Regulatory Framework: Antitrust laws and complex media regulations play a crucial role in shaping market structure, influencing competition, and dictating operational strategies for teams and leagues.
- M&A Activity: The market is witnessing significant M&A activity, with several high-value transactions, including deals exceeding USD 300 Million, indicating strategic consolidation and expansion efforts.
USA Sports Team And Club Market Industry Trends & Insights
The USA Sports Team and Club Market is experiencing robust growth, driven by increasing media consumption, a passionate fan base, and lucrative sponsorship opportunities. The Compound Annual Growth Rate (CAGR) for the forecast period (2025-2033) is projected to be xx%, reflecting the enduring popularity of live sports. Technological disruptions, such as streaming services and social media engagement, continue to reshape fan experiences and revenue streams. Consumer preferences are shifting towards personalized experiences, digital accessibility, and immersive entertainment, impacting merchandising strategies and media rights deals. Competitive dynamics are intensely competitive, with teams constantly striving to enhance their brand appeal, attract sponsors, and secure premium media rights deals. Market penetration in key segments (e.g., digital media rights) is steadily increasing.
Dominant Markets & Segments in USA Sports Team And Club Market
The USA Sports Team and Club Market is dominated by major leagues and teams in key regions. The football (NFL, MLS) and basketball (NBA) segments currently hold substantial market share, driven by large audiences, strong media deals, and merchandising opportunities. Baseball (MLB) maintains a significant presence, although its growth may be relatively slower compared to football and basketball. The hockey (NHL) segment is also well established but possesses a smaller market compared to the top three.
By Type:
- Football: Dominated by the NFL and growing MLS; high revenue from media rights and sponsorship.
- Basketball: NBA holds significant market share, strong merchandising and media rights revenues.
- Baseball: MLB enjoys a large and loyal fan base, generating solid revenue streams.
- Hockey: NHL occupies a significant, though smaller, segment of the market.
- Other Types: Includes various sports like soccer (outside of MLS), cycling, and others.
By Revenue Source:
- Media Rights: A major revenue driver for all segments, with intense competition for broadcast and streaming contracts.
- Merchandising: Significant revenue stream, driven by fan loyalty and brand recognition.
- Tickets: Remains a core revenue source, influenced by stadium capacity, ticket pricing, and game attendance.
- Sponsorship: A crucial revenue source, reflecting the market value and reach of sports teams and leagues.
Key Drivers: Strong consumer demand, robust media deals, and effective sponsorship strategies contribute significantly to market dominance.
USA Sports Team And Club Market Product Developments
Recent product innovations center on enhancing fan engagement through technology. Interactive apps, personalized content, and virtual reality experiences are transforming the fan experience. Teams are leveraging data analytics to optimize player performance and strategic decision-making. Competitive advantages stem from innovative marketing, branding, and technological investments. This market is constantly evolving to meet the changing demands of consumers.
Report Scope & Segmentation Analysis
This report comprehensively analyzes the USA Sports Team and Club Market across multiple segments.
By Type: The report covers Football, Basketball, Baseball, Hockey, and Other Types, providing market size, growth projections, and competitive landscapes for each segment.
By Revenue Source: The analysis includes Media Rights, Merchandising, Tickets, and Sponsorship, detailing revenue contributions, growth trends, and competitive dynamics.
Key Drivers of USA Sports Team And Club Market Growth
Several factors fuel the market's growth. The passionate fan base in the USA creates consistent demand. Lucrative media rights deals and substantial sponsorship revenue streams are crucial for growth. Technological advancements, particularly in digital media and fan engagement, are vital. Finally, government regulations impact broadcasting rights and competition significantly.
Challenges in the USA Sports Team And Club Market Sector
The sector faces challenges like fluctuating economic conditions impacting sponsorship and ticket sales, supply chain disruptions affecting merchandise availability, and fierce competition among teams and leagues for fans and revenue. Antitrust concerns and the potential for regulatory changes create additional uncertainty.
Emerging Opportunities in USA Sports Team And Club Market
The USA Sports Team and Club Market is ripe with emerging opportunities designed to captivate evolving fan bases and capitalize on technological advancements. A significant avenue for growth lies in the strategic integration of eSports, leveraging the massive appeal of competitive video gaming to attract new demographics and create synergistic entertainment offerings. Expanding reach and engagement through new digital platforms, including immersive virtual reality environments and interactive metaverse experiences, presents a substantial growth frontier. The market also has considerable potential in targeting and cultivating niche sports markets that may be underserved by traditional broadcasting and marketing efforts. Furthermore, a growing emphasis on sustainability practices within sports operations presents an opportunity to appeal to environmentally conscious consumers and enhance brand reputation. The development of deeply personalized fan experiences, tailored to individual preferences through AI-driven recommendations and exclusive content, is a critical growth area. Similarly, the implementation of advanced interactive technologies, from gamified apps to real-time data visualization for fans, promises to deepen engagement and create new revenue streams. Investing in these areas will be key to unlocking future growth and maintaining competitive relevance.
Leading Players in the USA Sports Team And Club Market Market
- Los Angeles Football Club (MLS)
- ESPN (Media Broadcaster & Rights Holder)
- PepsiCo (Sponsor & Partner)
- Chicago Bears (NFL)
- CBS (Media Broadcaster & Rights Holder)
- Detroit Tigers (MLB)
- Fox Sports (Media Broadcaster & Rights Holder)
- Dallas Cowboys (NFL)
- Nike (Apparel & Equipment)
- USA Cycling (Governing Body)
- Major League Baseball (MLB) (League)
- National Football League (NFL) (League)
- National Basketball Association (NBA) (League)
- National Hockey League (NHL) (League)
Key Developments in USA Sports Team And Club Market Industry
- July 2023: U.S. Soccer and Coca-Cola North America solidified a long-term strategic partnership, significantly enhancing the promotion of U.S. soccer domestically and globally, while extending Coca-Cola's extensive fan reach.
- September 2023: Liberty Media's acquisition of over 90% of QuintEvents for USD 313 Million marked a significant consolidation move within the sports ticketing, hospitality, and premium experience sector, indicating strategic focus on integrated fan services.
- Q4 2023: The launch of new, immersive fan engagement platforms by several major sports leagues, incorporating AI-driven personalization and interactive augmented reality features, signaling a commitment to next-generation digital experiences.
- Early 2024: Increased investment in sports-related venture capital funds, with a focus on sustainable sports technology, athlete performance analytics, and direct-to-fan content creation, highlighting investor confidence in the sector's innovation potential.
Strategic Outlook for USA Sports Team And Club Market Market
The USA Sports Team and Club Market is poised for continued robust growth and transformation, underpinned by a confluence of powerful trends. The enduring and deeply ingrained popularity of live sports remains the foundational driver, providing a loyal and passionate audience. Technological innovation will continue to be a primary catalyst, with significant investments expected in digital platforms that offer enhanced connectivity, immersive content, and seamless fan experiences. The development and adoption of sophisticated data analytics will be paramount for optimizing everything from player performance to personalized marketing strategies, offering a competitive edge. Evolving consumer preferences, particularly the demand for personalized, interactive, and accessible entertainment, will shape product development and service delivery. We anticipate continued consolidation and strategic partnerships, as organizations seek to broaden their reach, diversify revenue streams, and achieve economies of scale in an increasingly competitive landscape. The market's future trajectory is exceptionally bright, presenting substantial and multifaceted opportunities for organizations that can effectively adapt to technological advancements, cater to shifting consumer desires, and strategically navigate the evolving competitive dynamics.
USA Sports Team And Club Market Segmentation
-
1. Type
- 1.1. Football
- 1.2. Basketball
- 1.3. Baseball
- 1.4. Hockey
- 1.5. Other Types
-
2. Revenue Source
- 2.1. Media Rights
- 2.2. Merchandising
- 2.3. Tickets
- 2.4. Sponsorship
USA Sports Team And Club Market Segmentation By Geography
-
1. North America
- 1.1. United States
- 1.2. Canada
- 1.3. Mexico
-
2. South America
- 2.1. Brazil
- 2.2. Argentina
- 2.3. Rest of South America
-
3. Europe
- 3.1. United Kingdom
- 3.2. Germany
- 3.3. France
- 3.4. Italy
- 3.5. Spain
- 3.6. Russia
- 3.7. Benelux
- 3.8. Nordics
- 3.9. Rest of Europe
-
4. Middle East & Africa
- 4.1. Turkey
- 4.2. Israel
- 4.3. GCC
- 4.4. North Africa
- 4.5. South Africa
- 4.6. Rest of Middle East & Africa
-
5. Asia Pacific
- 5.1. China
- 5.2. India
- 5.3. Japan
- 5.4. South Korea
- 5.5. ASEAN
- 5.6. Oceania
- 5.7. Rest of Asia Pacific
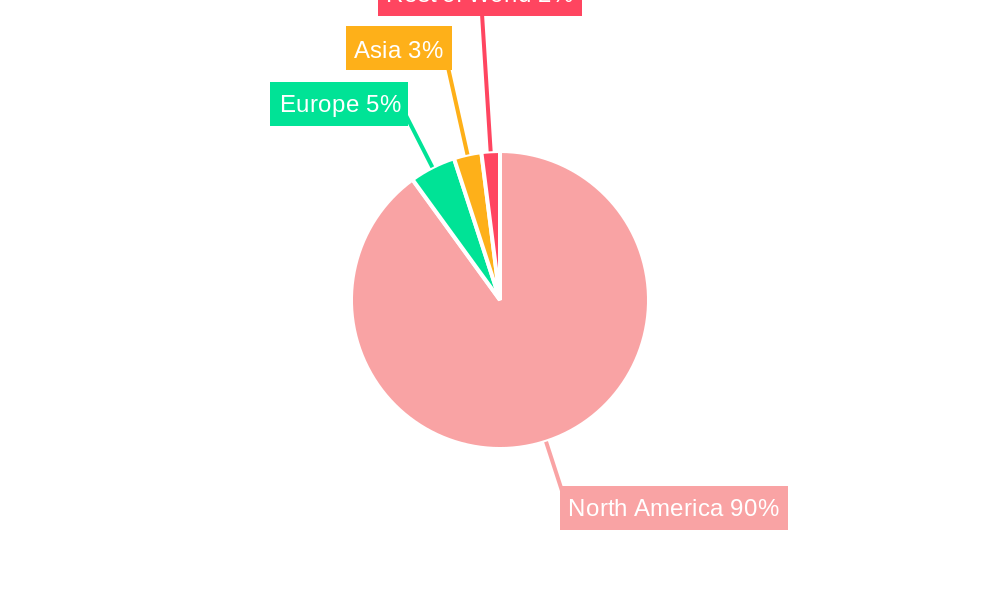
USA Sports Team And Club Market Regional Market Share
Geographic Coverage of USA Sports Team And Club Market
USA Sports Team And Club Market REPORT HIGHLIGHTS
| Aspects | Details |
|---|---|
| Study Period | 2020-2034 |
| Base Year | 2025 |
| Estimated Year | 2026 |
| Forecast Period | 2026-2034 |
| Historical Period | 2020-2025 |
| Growth Rate | CAGR of 8.6% from 2020-2034 |
| Segmentation |
|
Table of Contents
- 1. Introduction
- 1.1. Research Scope
- 1.2. Market Segmentation
- 1.3. Research Objective
- 1.4. Definitions and Assumptions
- 2. Executive Summary
- 2.1. Market Snapshot
- 3. Market Dynamics
- 3.1. Market Drivers
- 3.2. Market Restrains
- 3.3. Market Trends
- 3.4. Market Opportunities
- 4. Market Factor Analysis
- 4.1. Porters Five Forces
- 4.1.1. Bargaining Power of Suppliers
- 4.1.2. Bargaining Power of Buyers
- 4.1.3. Threat of New Entrants
- 4.1.4. Threat of Substitutes
- 4.1.5. Competitive Rivalry
- 4.2. PESTEL analysis
- 4.3. BCG Analysis
- 4.3.1. Stars (High Growth, High Market Share)
- 4.3.2. Cash Cows (Low Growth, High Market Share)
- 4.3.3. Question Mark (High Growth, Low Market Share)
- 4.3.4. Dogs (Low Growth, Low Market Share)
- 4.4. Ansoff Matrix Analysis
- 4.5. Supply Chain Analysis
- 4.6. Regulatory Landscape
- 4.7. Current Market Potential and Opportunity Assessment (TAM–SAM–SOM Framework)
- 4.8. RAX Analyst Note
- 4.1. Porters Five Forces
- 5. Market Analysis, Insights and Forecast 2021-2033
- 5.1. Market Analysis, Insights and Forecast - by Type
- 5.1.1. Football
- 5.1.2. Basketball
- 5.1.3. Baseball
- 5.1.4. Hockey
- 5.1.5. Other Types
- 5.2. Market Analysis, Insights and Forecast - by Revenue Source
- 5.2.1. Media Rights
- 5.2.2. Merchandising
- 5.2.3. Tickets
- 5.2.4. Sponsorship
- 5.3. Market Analysis, Insights and Forecast - by Region
- 5.3.1. North America
- 5.3.2. South America
- 5.3.3. Europe
- 5.3.4. Middle East & Africa
- 5.3.5. Asia Pacific
- 5.1. Market Analysis, Insights and Forecast - by Type
- 6. Global USA Sports Team And Club Market Analysis, Insights and Forecast, 2021-2033
- 6.1. Market Analysis, Insights and Forecast - by Type
- 6.1.1. Football
- 6.1.2. Basketball
- 6.1.3. Baseball
- 6.1.4. Hockey
- 6.1.5. Other Types
- 6.2. Market Analysis, Insights and Forecast - by Revenue Source
- 6.2.1. Media Rights
- 6.2.2. Merchandising
- 6.2.3. Tickets
- 6.2.4. Sponsorship
- 6.1. Market Analysis, Insights and Forecast - by Type
- 7. North America USA Sports Team And Club Market Analysis, Insights and Forecast, 2020-2032
- 7.1. Market Analysis, Insights and Forecast - by Type
- 7.1.1. Football
- 7.1.2. Basketball
- 7.1.3. Baseball
- 7.1.4. Hockey
- 7.1.5. Other Types
- 7.2. Market Analysis, Insights and Forecast - by Revenue Source
- 7.2.1. Media Rights
- 7.2.2. Merchandising
- 7.2.3. Tickets
- 7.2.4. Sponsorship
- 7.1. Market Analysis, Insights and Forecast - by Type
- 8. South America USA Sports Team And Club Market Analysis, Insights and Forecast, 2020-2032
- 8.1. Market Analysis, Insights and Forecast - by Type
- 8.1.1. Football
- 8.1.2. Basketball
- 8.1.3. Baseball
- 8.1.4. Hockey
- 8.1.5. Other Types
- 8.2. Market Analysis, Insights and Forecast - by Revenue Source
- 8.2.1. Media Rights
- 8.2.2. Merchandising
- 8.2.3. Tickets
- 8.2.4. Sponsorship
- 8.1. Market Analysis, Insights and Forecast - by Type
- 9. Europe USA Sports Team And Club Market Analysis, Insights and Forecast, 2020-2032
- 9.1. Market Analysis, Insights and Forecast - by Type
- 9.1.1. Football
- 9.1.2. Basketball
- 9.1.3. Baseball
- 9.1.4. Hockey
- 9.1.5. Other Types
- 9.2. Market Analysis, Insights and Forecast - by Revenue Source
- 9.2.1. Media Rights
- 9.2.2. Merchandising
- 9.2.3. Tickets
- 9.2.4. Sponsorship
- 9.1. Market Analysis, Insights and Forecast - by Type
- 10. Middle East & Africa USA Sports Team And Club Market Analysis, Insights and Forecast, 2020-2032
- 10.1. Market Analysis, Insights and Forecast - by Type
- 10.1.1. Football
- 10.1.2. Basketball
- 10.1.3. Baseball
- 10.1.4. Hockey
- 10.1.5. Other Types
- 10.2. Market Analysis, Insights and Forecast - by Revenue Source
- 10.2.1. Media Rights
- 10.2.2. Merchandising
- 10.2.3. Tickets
- 10.2.4. Sponsorship
- 10.1. Market Analysis, Insights and Forecast - by Type
- 11. Asia Pacific USA Sports Team And Club Market Analysis, Insights and Forecast, 2020-2032
- 11.1. Market Analysis, Insights and Forecast - by Type
- 11.1.1. Football
- 11.1.2. Basketball
- 11.1.3. Baseball
- 11.1.4. Hockey
- 11.1.5. Other Types
- 11.2. Market Analysis, Insights and Forecast - by Revenue Source
- 11.2.1. Media Rights
- 11.2.2. Merchandising
- 11.2.3. Tickets
- 11.2.4. Sponsorship
- 11.1. Market Analysis, Insights and Forecast - by Type
- 12. Competitive Analysis
- 12.1. Company Profiles
- 12.1.1 Los Angeles Football Club
- 12.1.1.1. Company Overview
- 12.1.1.2. Products
- 12.1.1.3. Company Financials
- 12.1.1.4. SWOT Analysis
- 12.1.2 ESPN
- 12.1.2.1. Company Overview
- 12.1.2.2. Products
- 12.1.2.3. Company Financials
- 12.1.2.4. SWOT Analysis
- 12.1.3 PepsiCo
- 12.1.3.1. Company Overview
- 12.1.3.2. Products
- 12.1.3.3. Company Financials
- 12.1.3.4. SWOT Analysis
- 12.1.4 Chicago Bears
- 12.1.4.1. Company Overview
- 12.1.4.2. Products
- 12.1.4.3. Company Financials
- 12.1.4.4. SWOT Analysis
- 12.1.5 CBS
- 12.1.5.1. Company Overview
- 12.1.5.2. Products
- 12.1.5.3. Company Financials
- 12.1.5.4. SWOT Analysis
- 12.1.6 Detroit Tigers
- 12.1.6.1. Company Overview
- 12.1.6.2. Products
- 12.1.6.3. Company Financials
- 12.1.6.4. SWOT Analysis
- 12.1.7 Fox Sports
- 12.1.7.1. Company Overview
- 12.1.7.2. Products
- 12.1.7.3. Company Financials
- 12.1.7.4. SWOT Analysis
- 12.1.8 Dallas Cowboy
- 12.1.8.1. Company Overview
- 12.1.8.2. Products
- 12.1.8.3. Company Financials
- 12.1.8.4. SWOT Analysis
- 12.1.9 Nike
- 12.1.9.1. Company Overview
- 12.1.9.2. Products
- 12.1.9.3. Company Financials
- 12.1.9.4. SWOT Analysis
- 12.1.10 USA Cycling
- 12.1.10.1. Company Overview
- 12.1.10.2. Products
- 12.1.10.3. Company Financials
- 12.1.10.4. SWOT Analysis
- 12.1.1 Los Angeles Football Club
- 12.2. Market Entropy
- 12.2.1 Company's Key Areas Served
- 12.2.2 Recent Developments
- 12.3. Company Market Share Analysis 2025
- 12.3.1 Top 5 Companies Market Share Analysis
- 12.3.2 Top 3 Companies Market Share Analysis
- 12.4. List of Potential Customers
- 13. Research Methodology
List of Figures
- Figure 1: Global USA Sports Team And Club Market Revenue Breakdown (billion, %) by Region 2025 & 2033
- Figure 2: North America USA Sports Team And Club Market Revenue (billion), by Type 2025 & 2033
- Figure 3: North America USA Sports Team And Club Market Revenue Share (%), by Type 2025 & 2033
- Figure 4: North America USA Sports Team And Club Market Revenue (billion), by Revenue Source 2025 & 2033
- Figure 5: North America USA Sports Team And Club Market Revenue Share (%), by Revenue Source 2025 & 2033
- Figure 6: North America USA Sports Team And Club Market Revenue (billion), by Country 2025 & 2033
- Figure 7: North America USA Sports Team And Club Market Revenue Share (%), by Country 2025 & 2033
- Figure 8: South America USA Sports Team And Club Market Revenue (billion), by Type 2025 & 2033
- Figure 9: South America USA Sports Team And Club Market Revenue Share (%), by Type 2025 & 2033
- Figure 10: South America USA Sports Team And Club Market Revenue (billion), by Revenue Source 2025 & 2033
- Figure 11: South America USA Sports Team And Club Market Revenue Share (%), by Revenue Source 2025 & 2033
- Figure 12: South America USA Sports Team And Club Market Revenue (billion), by Country 2025 & 2033
- Figure 13: South America USA Sports Team And Club Market Revenue Share (%), by Country 2025 & 2033
- Figure 14: Europe USA Sports Team And Club Market Revenue (billion), by Type 2025 & 2033
- Figure 15: Europe USA Sports Team And Club Market Revenue Share (%), by Type 2025 & 2033
- Figure 16: Europe USA Sports Team And Club Market Revenue (billion), by Revenue Source 2025 & 2033
- Figure 17: Europe USA Sports Team And Club Market Revenue Share (%), by Revenue Source 2025 & 2033
- Figure 18: Europe USA Sports Team And Club Market Revenue (billion), by Country 2025 & 2033
- Figure 19: Europe USA Sports Team And Club Market Revenue Share (%), by Country 2025 & 2033
- Figure 20: Middle East & Africa USA Sports Team And Club Market Revenue (billion), by Type 2025 & 2033
- Figure 21: Middle East & Africa USA Sports Team And Club Market Revenue Share (%), by Type 2025 & 2033
- Figure 22: Middle East & Africa USA Sports Team And Club Market Revenue (billion), by Revenue Source 2025 & 2033
- Figure 23: Middle East & Africa USA Sports Team And Club Market Revenue Share (%), by Revenue Source 2025 & 2033
- Figure 24: Middle East & Africa USA Sports Team And Club Market Revenue (billion), by Country 2025 & 2033
- Figure 25: Middle East & Africa USA Sports Team And Club Market Revenue Share (%), by Country 2025 & 2033
- Figure 26: Asia Pacific USA Sports Team And Club Market Revenue (billion), by Type 2025 & 2033
- Figure 27: Asia Pacific USA Sports Team And Club Market Revenue Share (%), by Type 2025 & 2033
- Figure 28: Asia Pacific USA Sports Team And Club Market Revenue (billion), by Revenue Source 2025 & 2033
- Figure 29: Asia Pacific USA Sports Team And Club Market Revenue Share (%), by Revenue Source 2025 & 2033
- Figure 30: Asia Pacific USA Sports Team And Club Market Revenue (billion), by Country 2025 & 2033
- Figure 31: Asia Pacific USA Sports Team And Club Market Revenue Share (%), by Country 2025 & 2033
List of Tables
- Table 1: Global USA Sports Team And Club Market Revenue billion Forecast, by Type 2020 & 2033
- Table 2: Global USA Sports Team And Club Market Revenue billion Forecast, by Revenue Source 2020 & 2033
- Table 3: Global USA Sports Team And Club Market Revenue billion Forecast, by Region 2020 & 2033
- Table 4: Global USA Sports Team And Club Market Revenue billion Forecast, by Type 2020 & 2033
- Table 5: Global USA Sports Team And Club Market Revenue billion Forecast, by Revenue Source 2020 & 2033
- Table 6: Global USA Sports Team And Club Market Revenue billion Forecast, by Country 2020 & 2033
- Table 7: United States USA Sports Team And Club Market Revenue (billion) Forecast, by Application 2020 & 2033
- Table 8: Canada USA Sports Team And Club Market Revenue (billion) Forecast, by Application 2020 & 2033
- Table 9: Mexico USA Sports Team And Club Market Revenue (billion) Forecast, by Application 2020 & 2033
- Table 10: Global USA Sports Team And Club Market Revenue billion Forecast, by Type 2020 & 2033
- Table 11: Global USA Sports Team And Club Market Revenue billion Forecast, by Revenue Source 2020 & 2033
- Table 12: Global USA Sports Team And Club Market Revenue billion Forecast, by Country 2020 & 2033
- Table 13: Brazil USA Sports Team And Club Market Revenue (billion) Forecast, by Application 2020 & 2033
- Table 14: Argentina USA Sports Team And Club Market Revenue (billion) Forecast, by Application 2020 & 2033
- Table 15: Rest of South America USA Sports Team And Club Market Revenue (billion) Forecast, by Application 2020 & 2033
- Table 16: Global USA Sports Team And Club Market Revenue billion Forecast, by Type 2020 & 2033
- Table 17: Global USA Sports Team And Club Market Revenue billion Forecast, by Revenue Source 2020 & 2033
- Table 18: Global USA Sports Team And Club Market Revenue billion Forecast, by Country 2020 & 2033
- Table 19: United Kingdom USA Sports Team And Club Market Revenue (billion) Forecast, by Application 2020 & 2033
- Table 20: Germany USA Sports Team And Club Market Revenue (billion) Forecast, by Application 2020 & 2033
- Table 21: France USA Sports Team And Club Market Revenue (billion) Forecast, by Application 2020 & 2033
- Table 22: Italy USA Sports Team And Club Market Revenue (billion) Forecast, by Application 2020 & 2033
- Table 23: Spain USA Sports Team And Club Market Revenue (billion) Forecast, by Application 2020 & 2033
- Table 24: Russia USA Sports Team And Club Market Revenue (billion) Forecast, by Application 2020 & 2033
- Table 25: Benelux USA Sports Team And Club Market Revenue (billion) Forecast, by Application 2020 & 2033
- Table 26: Nordics USA Sports Team And Club Market Revenue (billion) Forecast, by Application 2020 & 2033
- Table 27: Rest of Europe USA Sports Team And Club Market Revenue (billion) Forecast, by Application 2020 & 2033
- Table 28: Global USA Sports Team And Club Market Revenue billion Forecast, by Type 2020 & 2033
- Table 29: Global USA Sports Team And Club Market Revenue billion Forecast, by Revenue Source 2020 & 2033
- Table 30: Global USA Sports Team And Club Market Revenue billion Forecast, by Country 2020 & 2033
- Table 31: Turkey USA Sports Team And Club Market Revenue (billion) Forecast, by Application 2020 & 2033
- Table 32: Israel USA Sports Team And Club Market Revenue (billion) Forecast, by Application 2020 & 2033
- Table 33: GCC USA Sports Team And Club Market Revenue (billion) Forecast, by Application 2020 & 2033
- Table 34: North Africa USA Sports Team And Club Market Revenue (billion) Forecast, by Application 2020 & 2033
- Table 35: South Africa USA Sports Team And Club Market Revenue (billion) Forecast, by Application 2020 & 2033
- Table 36: Rest of Middle East & Africa USA Sports Team And Club Market Revenue (billion) Forecast, by Application 2020 & 2033
- Table 37: Global USA Sports Team And Club Market Revenue billion Forecast, by Type 2020 & 2033
- Table 38: Global USA Sports Team And Club Market Revenue billion Forecast, by Revenue Source 2020 & 2033
- Table 39: Global USA Sports Team And Club Market Revenue billion Forecast, by Country 2020 & 2033
- Table 40: China USA Sports Team And Club Market Revenue (billion) Forecast, by Application 2020 & 2033
- Table 41: India USA Sports Team And Club Market Revenue (billion) Forecast, by Application 2020 & 2033
- Table 42: Japan USA Sports Team And Club Market Revenue (billion) Forecast, by Application 2020 & 2033
- Table 43: South Korea USA Sports Team And Club Market Revenue (billion) Forecast, by Application 2020 & 2033
- Table 44: ASEAN USA Sports Team And Club Market Revenue (billion) Forecast, by Application 2020 & 2033
- Table 45: Oceania USA Sports Team And Club Market Revenue (billion) Forecast, by Application 2020 & 2033
- Table 46: Rest of Asia Pacific USA Sports Team And Club Market Revenue (billion) Forecast, by Application 2020 & 2033
Frequently Asked Questions
1. What is the projected Compound Annual Growth Rate (CAGR) of the USA Sports Team And Club Market?
The projected CAGR is approximately 8.6%.
2. Which companies are prominent players in the USA Sports Team And Club Market?
Key companies in the market include Los Angeles Football Club, ESPN, PepsiCo, Chicago Bears, CBS, Detroit Tigers, Fox Sports, Dallas Cowboy, Nike, USA Cycling.
3. What are the main segments of the USA Sports Team And Club Market?
The market segments include Type, Revenue Source.
4. Can you provide details about the market size?
The market size is estimated to be USD 48.9 billion as of 2022.
5. What are some drivers contributing to market growth?
E-sports and Digital Innovation Driving the market; Rising Sports Event In United States Driving The Market.
6. What are the notable trends driving market growth?
Increasing Sports Sponsorship Driving Sports Team And Club.
7. Are there any restraints impacting market growth?
Large share of Sponsoring and Media limited to few sports; Concentration of leading players in few clubs negatively affecting small clubs.
8. Can you provide examples of recent developments in the market?
July 2023: U.S. Soccer and Coca-Cola North America entered into a long-term partnership, supporting the U.S. soccer ecosystem and providing Coca-Cola with a global reach to connect with fans around the world. Coca-Cola exists as a total beverage company with products sold in more than 200 countries, and the U.S. Soccer Federation has existed as the official governing body of the sport in the United States for more than 100 years.
9. What pricing options are available for accessing the report?
Pricing options include single-user, multi-user, and enterprise licenses priced at USD 3800, USD 4500, and USD 5800 respectively.
10. Is the market size provided in terms of value or volume?
The market size is provided in terms of value, measured in billion.
11. Are there any specific market keywords associated with the report?
Yes, the market keyword associated with the report is "USA Sports Team And Club Market," which aids in identifying and referencing the specific market segment covered.
12. How do I determine which pricing option suits my needs best?
The pricing options vary based on user requirements and access needs. Individual users may opt for single-user licenses, while businesses requiring broader access may choose multi-user or enterprise licenses for cost-effective access to the report.
13. Are there any additional resources or data provided in the USA Sports Team And Club Market report?
While the report offers comprehensive insights, it's advisable to review the specific contents or supplementary materials provided to ascertain if additional resources or data are available.
14. How can I stay updated on further developments or reports in the USA Sports Team And Club Market?
To stay informed about further developments, trends, and reports in the USA Sports Team And Club Market, consider subscribing to industry newsletters, following relevant companies and organizations, or regularly checking reputable industry news sources and publications.
Methodology
Step 1 - Identification of Relevant Samples Size from Population Database


Step 2 - Approaches for Defining Global Market Size (Value, Volume* & Price*)

Note*: In applicable scenarios
Step 3 - Data Sources
Primary Research
- Web Analytics
- Survey Reports
- Research Institute
- Latest Research Reports
- Opinion Leaders
Secondary Research
- Annual Reports
- White Paper
- Latest Press Release
- Industry Association
- Paid Database
- Investor Presentations

Step 4 - Data Triangulation
Involves using different sources of information in order to increase the validity of a study
These sources are likely to be stakeholders in a program - participants, other researchers, program staff, other community members, and so on.
Then we put all data in single framework & apply various statistical tools to find out the dynamic on the market.
During the analysis stage, feedback from the stakeholder groups would be compared to determine areas of agreement as well as areas of divergence