

Key Insights
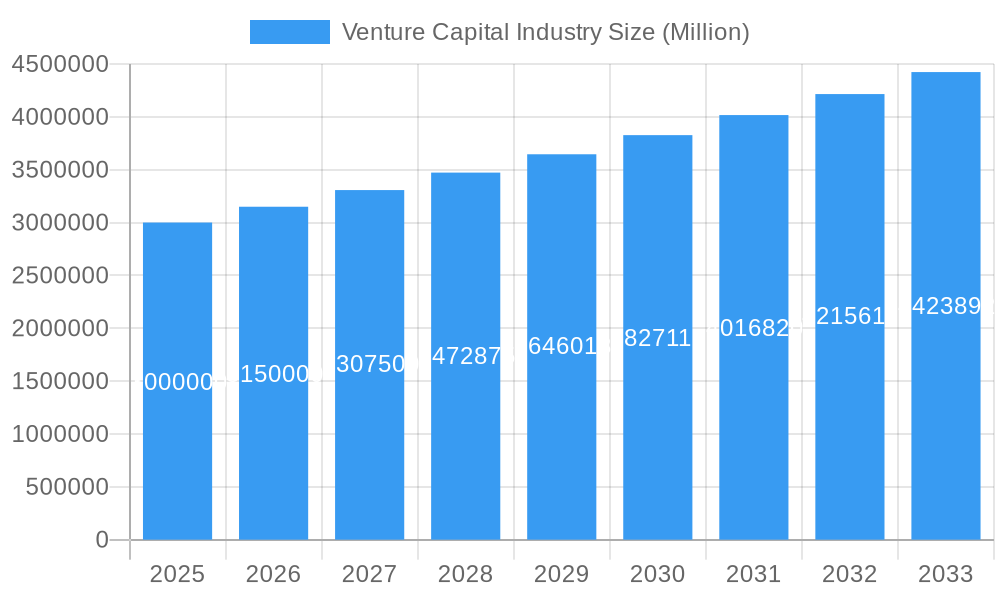
The Venture Capital (VC) industry, currently exhibiting a Compound Annual Growth Rate (CAGR) exceeding 5%, is experiencing significant expansion. The market, valued at an estimated $3 trillion in 2025, is driven by several key factors. Firstly, a burgeoning number of innovative startups across diverse sectors, particularly in technology, healthcare, and renewable energy, are attracting substantial VC investment. Secondly, the increasing availability of funding sources, including both traditional VC firms and corporate venture capital arms, fuels this growth. Furthermore, favorable regulatory environments in certain regions and a growing appetite for higher-risk, higher-reward investments contribute to the industry’s momentum. The presence of major players like Tiger Global Management, Sequoia Capital, and DST Global highlights the industry's consolidation and the ongoing competition for promising investment opportunities.
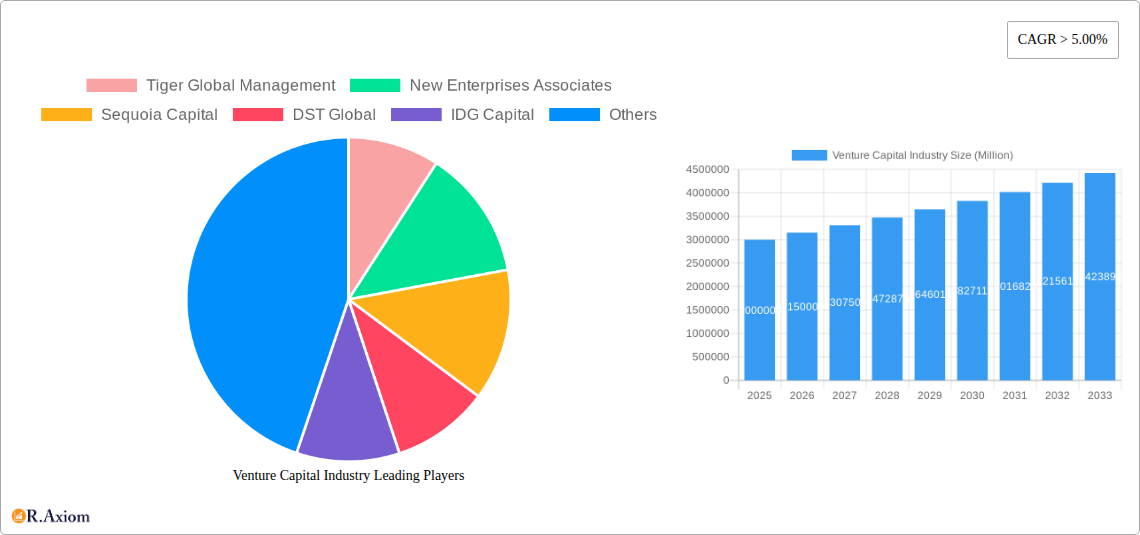
Venture Capital Industry Market Size (In Million)
However, the industry also faces certain constraints. Economic downturns and macroeconomic uncertainty can significantly impact investment decisions and funding rounds. The increasing competition among VC firms for top-tier deals also creates pressure on valuations and returns. Additionally, the exit strategies for VC-backed companies, often reliant on IPOs or acquisitions, are susceptible to market fluctuations. While the industry’s growth trajectory remains positive, careful consideration of these potential roadblocks is essential for navigating the complexities of the VC landscape. Successful firms will need to leverage strong networks, deep sector expertise, and a robust due diligence process to achieve sustainable success in this dynamic market.
Venture Capital Industry Company Market Share
Venture Capital Industry: A Comprehensive Market Report (2019-2033)
This in-depth report provides a comprehensive analysis of the Venture Capital (VC) industry, covering market trends, leading players, investment strategies, and future growth projections from 2019 to 2033. The report leverages a robust data set, including historical data (2019-2024), a base year (2025), and detailed forecasts (2025-2033), to offer actionable insights for investors, entrepreneurs, and industry stakeholders. Key players analyzed include Tiger Global Management, New Enterprises Associates, Sequoia Capital, DST Global, IDG Capital, Index Ventures, Healthcare Royalty Partners, GGV Capital, Nanjing Zijin Investment, and Greylock Partners (list not exhaustive). The report segments the market based on region, investment stage, industry vertical, and other key factors. The estimated market size for 2025 is xx Million USD, with a projected compound annual growth rate (CAGR) of xx% during the forecast period.
Venture Capital Industry Market Concentration & Innovation
The Venture Capital industry exhibits a concentrated landscape, with a few dominant players controlling significant market share. While precise market share figures for each firm fluctuate, Sequoia Capital, Tiger Global Management, and Accel consistently rank among the top firms globally, managing billions of dollars in assets and participating in numerous high-profile deals. The level of concentration varies across geographic regions and industry sectors. For example, the US market displays higher concentration compared to emerging markets.
Innovation within the VC industry is driven by several factors:
- Technological advancements: The rise of Fintech, AI, and other disruptive technologies necessitates new investment strategies and operational models.
- Regulatory frameworks: Changes in regulations (e.g., regarding private fund regulations or crowdfunding) influence investment patterns and risk profiles.
- Product substitutes: While direct substitutes are limited, alternative funding sources like angel investors and crowdfunding platforms compete for a share of the early-stage investment market.
- End-user trends: Shifting consumer preferences and market demand influence investment focus towards specific sectors like sustainable energy or health tech.
- M&A activities: Consolidation within the VC industry through mergers and acquisitions reflects efforts to increase market share, access new expertise, or expand geographic reach. M&A deal values have seen significant increases in recent years, with some deals exceeding xx Million USD. The average deal size is estimated at xx Million USD in 2025.
Venture Capital Industry Industry Trends & Insights
The Venture Capital industry is experiencing dynamic growth, shaped by several key trends:
The global Venture Capital market is exhibiting robust growth, fueled by increased technological innovation, the rise of disruptive business models, and a favorable regulatory environment in several key markets. The Americas continue to be the dominant region for VC investment, followed by Europe and Asia. However, emerging markets are witnessing a surge in VC activity, driven by rapid economic growth and increasing entrepreneurial activity. The CAGR for the global VC market is projected to be xx% from 2025 to 2033. Market penetration in key sectors like technology and healthcare remains high. Increased competition among VC firms is driving innovation in investment strategies and portfolio management techniques. The growing adoption of data analytics and AI in investment decision-making is transforming the industry. Consumer preference for sustainable and ethical investments is influencing investment decisions, particularly in areas such as renewable energy and responsible technology. The rise of thematic investing is increasing investor focus on specific industry sectors.
Dominant Markets & Segments in Venture Capital Industry
The Americas (primarily the United States) currently represent the dominant market for Venture Capital investments. Several factors contribute to this dominance:
- Strong entrepreneurial ecosystem: A large number of startups, robust technological infrastructure, and experienced venture capitalists create a thriving investment environment.
- Abundant capital availability: Access to a wide range of investment options and a deep pool of capital from institutional investors, high net worth individuals, and pension funds.
- Supportive regulatory environment: The US regulatory framework generally fosters innovation and attracts foreign investment.
- Established exit routes: Liquid public markets and established M&A activities facilitate returns for investors.
Other regions, such as Europe and Asia, are experiencing significant growth, albeit at a slower pace compared to the Americas. Within the industry, the technology sector consistently attracts the lion’s share of VC investments, followed by healthcare, consumer goods, and other emerging sectors.
Venture Capital Industry Product Developments
Product development in the VC industry focuses on enhancing investment processes, portfolio management, and fund management. Technological advancements, particularly in data analytics and artificial intelligence (AI), are transforming how VCs identify, evaluate, and manage investments. This includes improved due diligence processes, better risk assessment methodologies, and more efficient portfolio monitoring. The focus is on creating scalable and efficient investment platforms that enhance deal flow, streamline investor communications, and improve overall return on investment. The competitive advantage lies in leveraging data-driven insights, fostering strong networks, and offering specialized expertise in specific industry sectors.
Report Scope & Segmentation Analysis
This report segments the Venture Capital industry by various parameters:
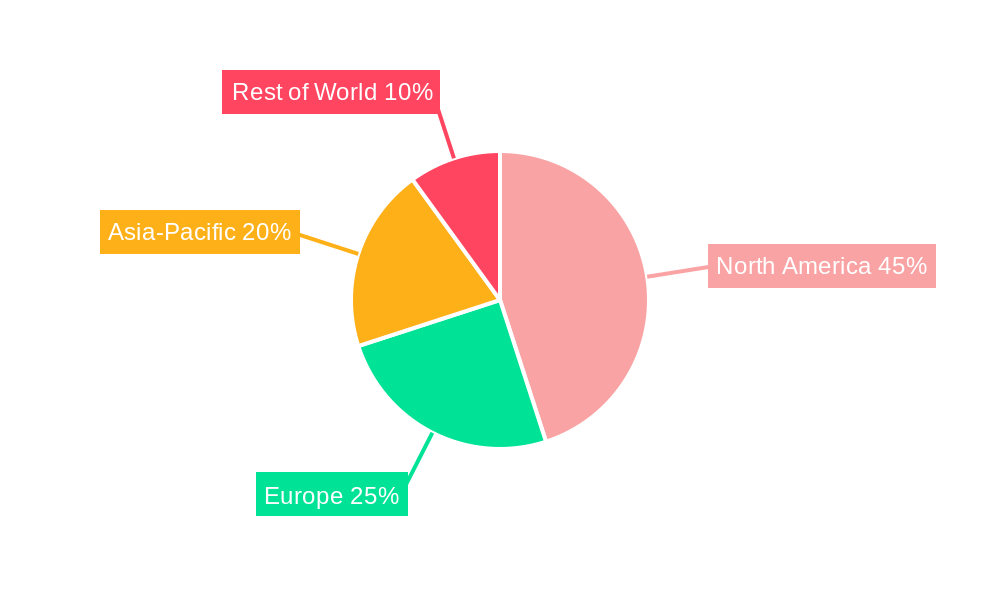
- Geography: North America, Europe, Asia-Pacific, Middle East & Africa, Latin America. Growth projections vary significantly across these regions, with North America maintaining a leading position throughout the forecast period. Competitive dynamics also differ across regions, influenced by local regulations and the presence of established players.
- Investment Stage: Seed, Series A, Series B, Series C, Late-stage. Market size and competitive intensity differ at each stage, with seed-stage investments typically involving higher risk and lower capital amounts compared to late-stage rounds.
- Industry Vertical: Technology (Software, Hardware, Fintech, Biotech, etc.), Healthcare, Consumer Goods, Energy, etc. This segmentation reveals investment trends towards specific industries and technological advancements.
- Investor Type: Corporate Venture Capital, Private Equity, Angel Investors, Government Funds. Each investor type displays different investment criteria and objectives.
Key Drivers of Venture Capital Industry Growth
Several factors drive the growth of the Venture Capital industry:
- Technological advancements: Continuous technological innovation creates new opportunities and investment possibilities in areas like AI, Blockchain, and biotech.
- Economic growth: A robust global economy stimulates entrepreneurial activity, leading to increased demand for funding.
- Favorable regulatory environment: Supportive government policies and regulations encourage investment and innovation.
- Increased liquidity: Strong public markets and active M&A activities create opportunities for exits and returns for VC investors.
Challenges in the Venture Capital Industry Sector
The Venture Capital industry faces certain challenges:
- Regulatory hurdles: Evolving regulations and compliance requirements can increase operational costs and complexity.
- High competition: Intense competition among VC firms necessitates a strategic approach to secure deals and outperform competitors.
- Market volatility: Economic downturns and market fluctuations pose risks to investments and returns. The estimated impact of market volatility on VC returns in 2023 was approximately a xx% reduction compared to 2022, representing a loss of approximately xx Million USD in potential returns for the industry.
Emerging Opportunities in Venture Capital Industry
Emerging opportunities include:
- Investing in sustainable technologies: Growing investor interest in climate-related investments and sustainable businesses presents opportunities in renewable energy, green technology, and sustainable agriculture.
- Expansion into emerging markets: Developing economies offer significant growth potential for VC investments.
- Focus on specific technological niches: Investing in highly specialized areas within the technology sector allows for capturing growth within rapidly evolving fields.
Leading Players in the Venture Capital Industry Market
Key Developments in Venture Capital Industry Industry
- 2020 Q4: The Americas accounted for USD 41 billion of VC investment across 2,725 deals. The United States accounted for USD 38.8 billion across 2,526 deals. Europe set a quarterly record with USD 14.3 billion raised across 1,192 deals.
- 2022: IDG Capital Vietnam confirms investment in METAIN, aiming to lead the NFT-empowered real estate trend in Vietnam, demonstrating the expansion of VC investment into innovative sectors and emerging markets.
Strategic Outlook for Venture Capital Industry Market
The Venture Capital industry is poised for continued growth, driven by technological innovation, increased capital availability, and favorable regulatory environments in many regions. The focus on data-driven investment decisions, diversification into emerging markets, and sustainable investments will shape the industry's future. The growing importance of ESG (Environmental, Social, and Governance) factors in investment decisions will further influence portfolio strategies. The industry is expected to continue adapting to changing market dynamics and capitalize on emerging opportunities to drive further expansion.
Venture Capital Industry Segmentation
-
1. Type
- 1.1. Local Investors
- 1.2. International Investors
-
2. Industry
- 2.1. Real Estate
- 2.2. Financial Services
- 2.3. Food & Beverages
- 2.4. Healthcare
- 2.5. Transport & Logistics
- 2.6. IT & ITeS
- 2.7. Education
- 2.8. Other Industries
Venture Capital Industry Segmentation By Geography
- 1. North America
- 2. Latin America
- 3. Europe
- 4. Asia Pacific
- 5. Middle East and Africa
Venture Capital Industry Regional Market Share
Geographic Coverage of Venture Capital Industry
Venture Capital Industry REPORT HIGHLIGHTS
| Aspects | Details |
|---|---|
| Study Period | 2020-2034 |
| Base Year | 2025 |
| Estimated Year | 2026 |
| Forecast Period | 2026-2034 |
| Historical Period | 2020-2025 |
| Growth Rate | CAGR of 16.68% from 2020-2034 |
| Segmentation |
|
Table of Contents
- 1. Introduction
- 1.1. Research Scope
- 1.2. Market Segmentation
- 1.3. Research Objective
- 1.4. Definitions and Assumptions
- 2. Executive Summary
- 2.1. Market Snapshot
- 3. Market Dynamics
- 3.1. Market Drivers
- 3.2. Market Restrains
- 3.3. Market Trends
- 3.4. Market Opportunities
- 4. Market Factor Analysis
- 4.1. Porters Five Forces
- 4.1.1. Bargaining Power of Suppliers
- 4.1.2. Bargaining Power of Buyers
- 4.1.3. Threat of New Entrants
- 4.1.4. Threat of Substitutes
- 4.1.5. Competitive Rivalry
- 4.2. PESTEL analysis
- 4.3. BCG Analysis
- 4.3.1. Stars (High Growth, High Market Share)
- 4.3.2. Cash Cows (Low Growth, High Market Share)
- 4.3.3. Question Mark (High Growth, Low Market Share)
- 4.3.4. Dogs (Low Growth, Low Market Share)
- 4.4. Ansoff Matrix Analysis
- 4.5. Supply Chain Analysis
- 4.6. Regulatory Landscape
- 4.7. Current Market Potential and Opportunity Assessment (TAM–SAM–SOM Framework)
- 4.8. RAX Analyst Note
- 4.1. Porters Five Forces
- 5. Market Analysis, Insights and Forecast 2021-2033
- 5.1. Market Analysis, Insights and Forecast - by Type
- 5.1.1. Local Investors
- 5.1.2. International Investors
- 5.2. Market Analysis, Insights and Forecast - by Industry
- 5.2.1. Real Estate
- 5.2.2. Financial Services
- 5.2.3. Food & Beverages
- 5.2.4. Healthcare
- 5.2.5. Transport & Logistics
- 5.2.6. IT & ITeS
- 5.2.7. Education
- 5.2.8. Other Industries
- 5.3. Market Analysis, Insights and Forecast - by Region
- 5.3.1. North America
- 5.3.2. Latin America
- 5.3.3. Europe
- 5.3.4. Asia Pacific
- 5.3.5. Middle East and Africa
- 5.1. Market Analysis, Insights and Forecast - by Type
- 6. Global Venture Capital Industry Analysis, Insights and Forecast, 2021-2033
- 6.1. Market Analysis, Insights and Forecast - by Type
- 6.1.1. Local Investors
- 6.1.2. International Investors
- 6.2. Market Analysis, Insights and Forecast - by Industry
- 6.2.1. Real Estate
- 6.2.2. Financial Services
- 6.2.3. Food & Beverages
- 6.2.4. Healthcare
- 6.2.5. Transport & Logistics
- 6.2.6. IT & ITeS
- 6.2.7. Education
- 6.2.8. Other Industries
- 6.1. Market Analysis, Insights and Forecast - by Type
- 7. North America Venture Capital Industry Analysis, Insights and Forecast, 2020-2032
- 7.1. Market Analysis, Insights and Forecast - by Type
- 7.1.1. Local Investors
- 7.1.2. International Investors
- 7.2. Market Analysis, Insights and Forecast - by Industry
- 7.2.1. Real Estate
- 7.2.2. Financial Services
- 7.2.3. Food & Beverages
- 7.2.4. Healthcare
- 7.2.5. Transport & Logistics
- 7.2.6. IT & ITeS
- 7.2.7. Education
- 7.2.8. Other Industries
- 7.1. Market Analysis, Insights and Forecast - by Type
- 8. Latin America Venture Capital Industry Analysis, Insights and Forecast, 2020-2032
- 8.1. Market Analysis, Insights and Forecast - by Type
- 8.1.1. Local Investors
- 8.1.2. International Investors
- 8.2. Market Analysis, Insights and Forecast - by Industry
- 8.2.1. Real Estate
- 8.2.2. Financial Services
- 8.2.3. Food & Beverages
- 8.2.4. Healthcare
- 8.2.5. Transport & Logistics
- 8.2.6. IT & ITeS
- 8.2.7. Education
- 8.2.8. Other Industries
- 8.1. Market Analysis, Insights and Forecast - by Type
- 9. Europe Venture Capital Industry Analysis, Insights and Forecast, 2020-2032
- 9.1. Market Analysis, Insights and Forecast - by Type
- 9.1.1. Local Investors
- 9.1.2. International Investors
- 9.2. Market Analysis, Insights and Forecast - by Industry
- 9.2.1. Real Estate
- 9.2.2. Financial Services
- 9.2.3. Food & Beverages
- 9.2.4. Healthcare
- 9.2.5. Transport & Logistics
- 9.2.6. IT & ITeS
- 9.2.7. Education
- 9.2.8. Other Industries
- 9.1. Market Analysis, Insights and Forecast - by Type
- 10. Asia Pacific Venture Capital Industry Analysis, Insights and Forecast, 2020-2032
- 10.1. Market Analysis, Insights and Forecast - by Type
- 10.1.1. Local Investors
- 10.1.2. International Investors
- 10.2. Market Analysis, Insights and Forecast - by Industry
- 10.2.1. Real Estate
- 10.2.2. Financial Services
- 10.2.3. Food & Beverages
- 10.2.4. Healthcare
- 10.2.5. Transport & Logistics
- 10.2.6. IT & ITeS
- 10.2.7. Education
- 10.2.8. Other Industries
- 10.1. Market Analysis, Insights and Forecast - by Type
- 11. Middle East and Africa Venture Capital Industry Analysis, Insights and Forecast, 2020-2032
- 11.1. Market Analysis, Insights and Forecast - by Type
- 11.1.1. Local Investors
- 11.1.2. International Investors
- 11.2. Market Analysis, Insights and Forecast - by Industry
- 11.2.1. Real Estate
- 11.2.2. Financial Services
- 11.2.3. Food & Beverages
- 11.2.4. Healthcare
- 11.2.5. Transport & Logistics
- 11.2.6. IT & ITeS
- 11.2.7. Education
- 11.2.8. Other Industries
- 11.1. Market Analysis, Insights and Forecast - by Type
- 12. Competitive Analysis
- 12.1. Company Profiles
- 12.1.1 Tiger Global Management
- 12.1.1.1. Company Overview
- 12.1.1.2. Products
- 12.1.1.3. Company Financials
- 12.1.1.4. SWOT Analysis
- 12.1.2 New Enterprises Associates
- 12.1.2.1. Company Overview
- 12.1.2.2. Products
- 12.1.2.3. Company Financials
- 12.1.2.4. SWOT Analysis
- 12.1.3 Sequoia Capital
- 12.1.3.1. Company Overview
- 12.1.3.2. Products
- 12.1.3.3. Company Financials
- 12.1.3.4. SWOT Analysis
- 12.1.4 DST Global
- 12.1.4.1. Company Overview
- 12.1.4.2. Products
- 12.1.4.3. Company Financials
- 12.1.4.4. SWOT Analysis
- 12.1.5 IDG Capital
- 12.1.5.1. Company Overview
- 12.1.5.2. Products
- 12.1.5.3. Company Financials
- 12.1.5.4. SWOT Analysis
- 12.1.6 Index Ventures
- 12.1.6.1. Company Overview
- 12.1.6.2. Products
- 12.1.6.3. Company Financials
- 12.1.6.4. SWOT Analysis
- 12.1.7 Healthcare Royalty Partners
- 12.1.7.1. Company Overview
- 12.1.7.2. Products
- 12.1.7.3. Company Financials
- 12.1.7.4. SWOT Analysis
- 12.1.8 GGV Capital
- 12.1.8.1. Company Overview
- 12.1.8.2. Products
- 12.1.8.3. Company Financials
- 12.1.8.4. SWOT Analysis
- 12.1.9 Nanjing Zijin Investment
- 12.1.9.1. Company Overview
- 12.1.9.2. Products
- 12.1.9.3. Company Financials
- 12.1.9.4. SWOT Analysis
- 12.1.10 Greylock Partners**List Not Exhaustive
- 12.1.10.1. Company Overview
- 12.1.10.2. Products
- 12.1.10.3. Company Financials
- 12.1.10.4. SWOT Analysis
- 12.1.1 Tiger Global Management
- 12.2. Market Entropy
- 12.2.1 Company's Key Areas Served
- 12.2.2 Recent Developments
- 12.3. Company Market Share Analysis 2025
- 12.3.1 Top 5 Companies Market Share Analysis
- 12.3.2 Top 3 Companies Market Share Analysis
- 12.4. List of Potential Customers
- 13. Research Methodology
List of Figures
- Figure 1: Global Venture Capital Industry Revenue Breakdown (billion, %) by Region 2025 & 2033
- Figure 2: North America Venture Capital Industry Revenue (billion), by Type 2025 & 2033
- Figure 3: North America Venture Capital Industry Revenue Share (%), by Type 2025 & 2033
- Figure 4: North America Venture Capital Industry Revenue (billion), by Industry 2025 & 2033
- Figure 5: North America Venture Capital Industry Revenue Share (%), by Industry 2025 & 2033
- Figure 6: North America Venture Capital Industry Revenue (billion), by Country 2025 & 2033
- Figure 7: North America Venture Capital Industry Revenue Share (%), by Country 2025 & 2033
- Figure 8: Latin America Venture Capital Industry Revenue (billion), by Type 2025 & 2033
- Figure 9: Latin America Venture Capital Industry Revenue Share (%), by Type 2025 & 2033
- Figure 10: Latin America Venture Capital Industry Revenue (billion), by Industry 2025 & 2033
- Figure 11: Latin America Venture Capital Industry Revenue Share (%), by Industry 2025 & 2033
- Figure 12: Latin America Venture Capital Industry Revenue (billion), by Country 2025 & 2033
- Figure 13: Latin America Venture Capital Industry Revenue Share (%), by Country 2025 & 2033
- Figure 14: Europe Venture Capital Industry Revenue (billion), by Type 2025 & 2033
- Figure 15: Europe Venture Capital Industry Revenue Share (%), by Type 2025 & 2033
- Figure 16: Europe Venture Capital Industry Revenue (billion), by Industry 2025 & 2033
- Figure 17: Europe Venture Capital Industry Revenue Share (%), by Industry 2025 & 2033
- Figure 18: Europe Venture Capital Industry Revenue (billion), by Country 2025 & 2033
- Figure 19: Europe Venture Capital Industry Revenue Share (%), by Country 2025 & 2033
- Figure 20: Asia Pacific Venture Capital Industry Revenue (billion), by Type 2025 & 2033
- Figure 21: Asia Pacific Venture Capital Industry Revenue Share (%), by Type 2025 & 2033
- Figure 22: Asia Pacific Venture Capital Industry Revenue (billion), by Industry 2025 & 2033
- Figure 23: Asia Pacific Venture Capital Industry Revenue Share (%), by Industry 2025 & 2033
- Figure 24: Asia Pacific Venture Capital Industry Revenue (billion), by Country 2025 & 2033
- Figure 25: Asia Pacific Venture Capital Industry Revenue Share (%), by Country 2025 & 2033
- Figure 26: Middle East and Africa Venture Capital Industry Revenue (billion), by Type 2025 & 2033
- Figure 27: Middle East and Africa Venture Capital Industry Revenue Share (%), by Type 2025 & 2033
- Figure 28: Middle East and Africa Venture Capital Industry Revenue (billion), by Industry 2025 & 2033
- Figure 29: Middle East and Africa Venture Capital Industry Revenue Share (%), by Industry 2025 & 2033
- Figure 30: Middle East and Africa Venture Capital Industry Revenue (billion), by Country 2025 & 2033
- Figure 31: Middle East and Africa Venture Capital Industry Revenue Share (%), by Country 2025 & 2033
List of Tables
- Table 1: Global Venture Capital Industry Revenue billion Forecast, by Type 2020 & 2033
- Table 2: Global Venture Capital Industry Revenue billion Forecast, by Industry 2020 & 2033
- Table 3: Global Venture Capital Industry Revenue billion Forecast, by Region 2020 & 2033
- Table 4: Global Venture Capital Industry Revenue billion Forecast, by Type 2020 & 2033
- Table 5: Global Venture Capital Industry Revenue billion Forecast, by Industry 2020 & 2033
- Table 6: Global Venture Capital Industry Revenue billion Forecast, by Country 2020 & 2033
- Table 7: Global Venture Capital Industry Revenue billion Forecast, by Type 2020 & 2033
- Table 8: Global Venture Capital Industry Revenue billion Forecast, by Industry 2020 & 2033
- Table 9: Global Venture Capital Industry Revenue billion Forecast, by Country 2020 & 2033
- Table 10: Global Venture Capital Industry Revenue billion Forecast, by Type 2020 & 2033
- Table 11: Global Venture Capital Industry Revenue billion Forecast, by Industry 2020 & 2033
- Table 12: Global Venture Capital Industry Revenue billion Forecast, by Country 2020 & 2033
- Table 13: Global Venture Capital Industry Revenue billion Forecast, by Type 2020 & 2033
- Table 14: Global Venture Capital Industry Revenue billion Forecast, by Industry 2020 & 2033
- Table 15: Global Venture Capital Industry Revenue billion Forecast, by Country 2020 & 2033
- Table 16: Global Venture Capital Industry Revenue billion Forecast, by Type 2020 & 2033
- Table 17: Global Venture Capital Industry Revenue billion Forecast, by Industry 2020 & 2033
- Table 18: Global Venture Capital Industry Revenue billion Forecast, by Country 2020 & 2033
Frequently Asked Questions
1. What is the projected Compound Annual Growth Rate (CAGR) of the Venture Capital Industry?
The projected CAGR is approximately 16.68%.
2. Which companies are prominent players in the Venture Capital Industry?
Key companies in the market include Tiger Global Management, New Enterprises Associates, Sequoia Capital, DST Global, IDG Capital, Index Ventures, Healthcare Royalty Partners, GGV Capital, Nanjing Zijin Investment, Greylock Partners**List Not Exhaustive.
3. What are the main segments of the Venture Capital Industry?
The market segments include Type, Industry.
4. Can you provide details about the market size?
The market size is estimated to be USD 396.7 billion as of 2022.
5. What are some drivers contributing to market growth?
N/A
6. What are the notable trends driving market growth?
Distribution of Start-Ups Witnessing Venture Capital Industry Globally.
7. Are there any restraints impacting market growth?
N/A
8. Can you provide examples of recent developments in the market?
In 2022, IDG Capital Vietnam Confirms Investment in METAIN to Lead NFT-Empowered Real Estate Trend in Vietnam. IDG Capital also shows its ambition to lead the NFT Real estate trend and reveals its plan to proactively engage with global investors to attract investment into the Vietnam real estate market. With the high security, instantaneous settlement, transparent, seamless transaction process, blockchain, smart contract, and NFT (Non-fungible token) technology is transforming the real estate industry and will become the key trend in the next decades.
9. What pricing options are available for accessing the report?
Pricing options include single-user, multi-user, and enterprise licenses priced at USD 4750, USD 5250, and USD 8750 respectively.
10. Is the market size provided in terms of value or volume?
The market size is provided in terms of value, measured in billion.
11. Are there any specific market keywords associated with the report?
Yes, the market keyword associated with the report is "Venture Capital Industry," which aids in identifying and referencing the specific market segment covered.
12. How do I determine which pricing option suits my needs best?
The pricing options vary based on user requirements and access needs. Individual users may opt for single-user licenses, while businesses requiring broader access may choose multi-user or enterprise licenses for cost-effective access to the report.
13. Are there any additional resources or data provided in the Venture Capital Industry report?
While the report offers comprehensive insights, it's advisable to review the specific contents or supplementary materials provided to ascertain if additional resources or data are available.
14. How can I stay updated on further developments or reports in the Venture Capital Industry?
To stay informed about further developments, trends, and reports in the Venture Capital Industry, consider subscribing to industry newsletters, following relevant companies and organizations, or regularly checking reputable industry news sources and publications.
Methodology
Step 1 - Identification of Relevant Samples Size from Population Database


Step 2 - Approaches for Defining Global Market Size (Value, Volume* & Price*)

Note*: In applicable scenarios
Step 3 - Data Sources
Primary Research
- Web Analytics
- Survey Reports
- Research Institute
- Latest Research Reports
- Opinion Leaders
Secondary Research
- Annual Reports
- White Paper
- Latest Press Release
- Industry Association
- Paid Database
- Investor Presentations

Step 4 - Data Triangulation
Involves using different sources of information in order to increase the validity of a study
These sources are likely to be stakeholders in a program - participants, other researchers, program staff, other community members, and so on.
Then we put all data in single framework & apply various statistical tools to find out the dynamic on the market.
During the analysis stage, feedback from the stakeholder groups would be compared to determine areas of agreement as well as areas of divergence