
Key Insights
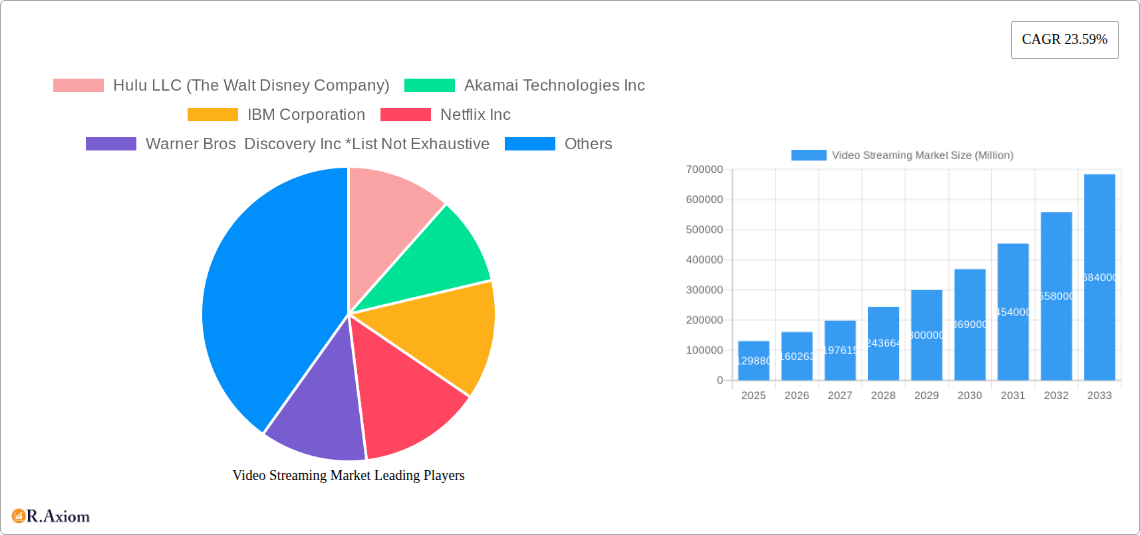
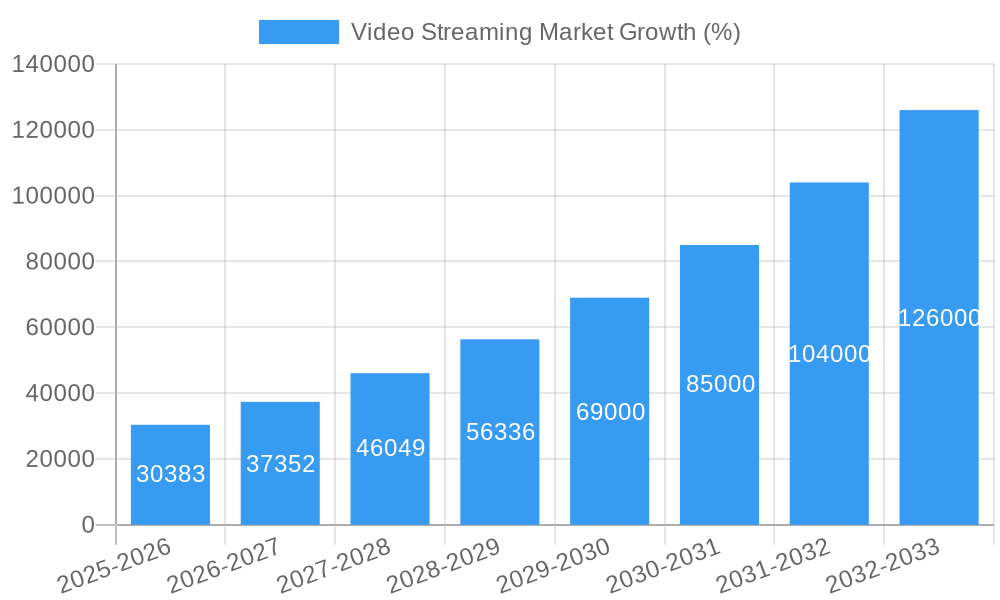
The global video streaming market is experiencing explosive growth, projected to reach a substantial size driven by several key factors. The market's Compound Annual Growth Rate (CAGR) of 23.59% from 2019 to 2024 indicates a significant upward trajectory. This robust expansion is fueled by the increasing adoption of high-speed internet, the proliferation of smart devices (smart TVs, smartphones, tablets), and the rising demand for on-demand and live streaming content. The shift in consumer preferences towards convenient and personalized entertainment experiences further contributes to market growth. Key segments driving this growth include over-the-top (OTT) platforms, subscription-based revenue models, and cloud deployment, reflecting the industry's focus on scalable and accessible streaming solutions. The diverse range of platforms, from gaming consoles to smart TVs, facilitates widespread accessibility. Competition among established players like Netflix, Amazon, and Disney, alongside emerging players, fosters innovation and enhances the overall user experience.
Despite the significant growth, certain challenges remain. Content licensing costs and the need for robust infrastructure investments pose ongoing obstacles. Furthermore, market saturation in mature regions, coupled with increasing competition, necessitates strategic initiatives for sustained growth. The market is likely to witness increased investment in 4K and even 8K streaming capabilities as well as advancements in video compression and delivery technologies to improve user experience and reduce bandwidth requirements. Geographic expansion, particularly in developing economies, remains a lucrative avenue for market players, with significant growth potential in Asia-Pacific and South America. The continued development of personalized content recommendations and improved user interfaces will be critical for success. The future of the video streaming market points towards continued expansion and innovation, propelled by evolving consumer demands and technological advancements.
This in-depth report provides a comprehensive analysis of the Video Streaming Market, encompassing market size, segmentation, key players, growth drivers, challenges, and future opportunities. The study period covers 2019-2033, with 2025 as the base and estimated year. The report offers actionable insights for industry stakeholders, investors, and businesses operating in this dynamic market.
Video Streaming Market Concentration & Innovation
The video streaming market exhibits a high degree of concentration, with a few dominant players controlling a significant market share. Netflix, Inc., Netflix, Amazon.com Inc., Amazon, and Disney (through Hulu) hold substantial positions, reflecting their extensive content libraries, robust technological infrastructure, and strong brand recognition. However, the market is characterized by continuous innovation, with emerging players and technological advancements challenging the established order. Market share fluctuations are frequent, driven by factors such as content acquisition strategies, technological disruptions, and consumer preferences. The market's competitive landscape is further shaped by strategic mergers and acquisitions (M&A), with deal values reaching billions of dollars in recent years. For example, the acquisition of smaller streaming platforms by major players has significantly consolidated the market. Regulatory frameworks, such as those related to data privacy and content regulation, also play a crucial role in shaping the market dynamics. The rise of alternative entertainment options, like gaming and social media platforms, presents a growing challenge, necessitating continuous product innovation and adaptation.
- Key Metrics:
- Netflix Market Share (2024): xx%
- Amazon Market Share (2024): xx%
- Disney (Hulu) Market Share (2024): xx%
- Average M&A Deal Value (2019-2024): $xx Million
- Number of M&A Deals (2019-2024): xx
Video Streaming Market Industry Trends & Insights
The video streaming market is experiencing robust growth, driven by several factors. The increasing penetration of high-speed internet, the affordability of smart devices, and the rising consumer demand for on-demand entertainment are key contributors. The market is witnessing a significant shift towards streaming services, propelled by the convenience and flexibility offered. The Compound Annual Growth Rate (CAGR) for the period 2025-2033 is estimated to be xx%, reflecting strong growth projections. Technological advancements, such as improved video compression techniques, 5G network expansion, and the development of immersive viewing experiences (VR/AR), are further accelerating market growth. Consumer preferences are also evolving, with a growing preference for personalized content recommendations and interactive features. The competitive landscape remains intensely competitive, with ongoing battles for content acquisition rights, technological leadership, and user acquisition. Market penetration of streaming services is increasing rapidly, with a substantial portion of households now subscribing to multiple platforms. The rise of ad-supported video-on-demand (AVOD) models is also reshaping the revenue landscape.
Dominant Markets & Segments in Video Streaming Market
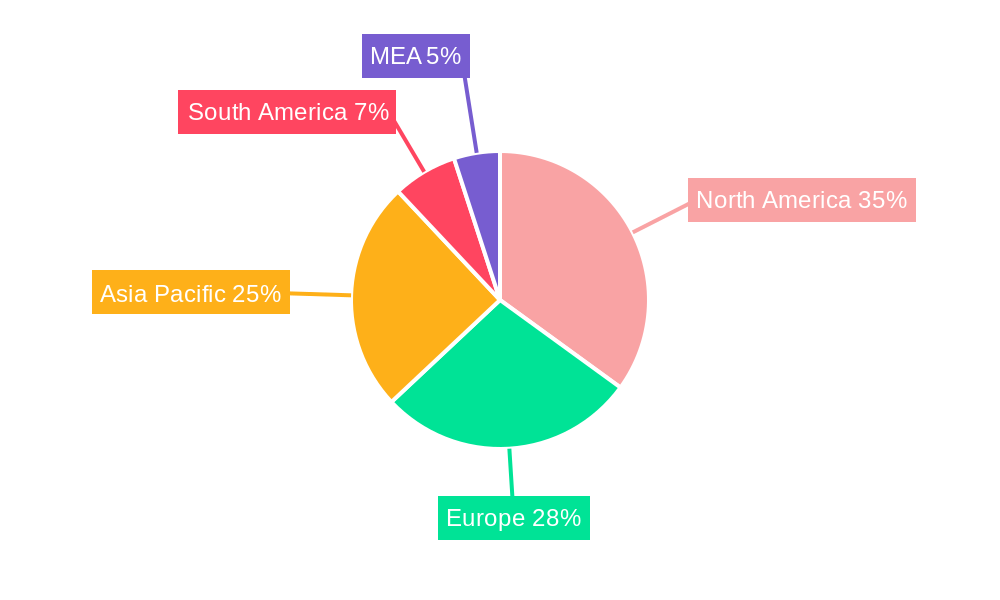
Leading Region: North America currently dominates the video streaming market, driven by high internet penetration, strong consumer spending power, and the presence of major streaming platforms. However, Asia-Pacific is emerging as a rapidly growing region, fuelled by a burgeoning middle class and increasing smartphone adoption.
Dominant Segments:
- By Streaming Type: Over-the-Top (OTT) holds the largest market share, driven by its flexibility and convenience.
- By Component: Services are a leading segment, catering to the growing demand for content delivery and platform management solutions.
- By Solution: OTT continues to dominate due to the factors mentioned above.
- By Platform: Smartphones and tablets represent the largest segment due to their wide accessibility.
- By Revenue Model: Subscription models continue to be the most dominant, although advertising-based models are also rapidly expanding.
- By Deployment Type: Cloud deployment is the preferred choice given its scalability and cost-effectiveness.
- By End User: The consumer segment dominates, although the enterprise segment is experiencing growth with businesses using streaming for internal communications and training.
Key Drivers (Examples):
- North America: High disposable incomes, high internet penetration, established streaming infrastructure.
- Asia-Pacific: Rapidly expanding middle class, increasing smartphone penetration, lower internet costs.
Video Streaming Market Product Developments
Recent advancements in video streaming technology have focused on enhancing user experience, personalization, and content delivery efficiency. Improvements in video compression algorithms, adaptive bitrate streaming, and low-latency streaming protocols are improving viewing quality and reducing bandwidth consumption. The integration of AI and machine learning is also enhancing content recommendation systems, personalized advertising, and fraud detection mechanisms. These advancements are creating new opportunities for enhanced user engagement and revenue generation.
Report Scope & Segmentation Analysis
This report segments the video streaming market across various parameters: Streaming Type (Live, Non-Linear), Component (Software, Services), Solution (IPTV, OTT, Cable TV, Pay-TV), Platform (Gaming Consoles, Laptops/Desktops, Smartphones/Tablets, Smart TV), Revenue Model (Advertising, Rental, Subscription), Deployment Type (Cloud, On-premises), and End User (Enterprise, Consumer). Each segment's growth trajectory, market size, and competitive dynamics are analyzed in detail. For example, the OTT segment is expected to demonstrate a high CAGR due to its accessibility, while the subscription revenue model is projected to retain dominance in the foreseeable future.
Key Drivers of Video Streaming Market Growth
Several factors are driving the growth of the video streaming market. The widespread adoption of high-speed internet and affordable smart devices has broadened access to streaming services, fostering rapid market expansion. Consumer preference for on-demand content and personalized experiences continues to fuel growth, while technological innovations in video compression and content delivery further enhance the viewing experience. Favorable regulatory environments in many regions are also encouraging market development.
Challenges in the Video Streaming Market Sector
The video streaming market faces challenges, including increasing content acquisition costs, intense competition among streaming platforms, and concerns regarding data privacy and security. Regulatory hurdles related to content licensing and data protection also pose significant obstacles. Supply chain disruptions can impact the availability of necessary infrastructure and equipment, causing delays and potential service disruptions.
Emerging Opportunities in Video Streaming Market
The market offers several emerging opportunities, including the expansion into new geographic markets with growing internet penetration. Technological advancements, such as virtual reality (VR) and augmented reality (AR), offer new avenues for immersive viewing experiences. The increasing popularity of live streaming for events and gaming provides exciting growth prospects. Personalized content experiences and interactive features are shaping the future of video streaming.
Leading Players in the Video Streaming Market
- Hulu LLC (The Walt Disney Company)
- Akamai Technologies Inc
- IBM Corporation
- Netflix Inc
- Warner Bros Discovery Inc
- Alphabet Inc
- Tencent Holdings Limited
- Haivision Systems Inc
- Roku Inc
- Amazon com Inc
- Brightcove Inc
- Apple Inc
Key Developments in Video Streaming Market Industry
- August 2022: TVCoins launched a white-label FAST platform with a built-in viewer reward scheme, enabling content owners to easily distribute their content.
- February 2023: MoEngage and Myco partnered to enhance audience and creator engagement in web-3 video streaming.
- May 2023: The International Boxing Association (IBA) partnered with OTTera to improve the viewing experience for boxing fans.
Strategic Outlook for Video Streaming Market
The video streaming market is poised for sustained growth, driven by continuous technological advancements, expanding consumer adoption, and evolving content consumption patterns. New opportunities exist in emerging markets and in leveraging innovative technologies like VR/AR to deliver immersive entertainment experiences. The focus on personalized content and improved user experiences will be central to future success. The market dynamics will remain highly competitive, necessitating continuous innovation and strategic adaptations from market participants.
Video Streaming Market Segmentation
-
1. Streaming Type
- 1.1. Live Video Streaming
- 1.2. Non-Linear Video Streaming
-
2. Component
- 2.1. Software
- 2.2. Services
-
3. Solutions
- 3.1. Internet Protocol TV
- 3.2. Over-the-Top (OTT)
- 3.3. Cable TV
- 3.4. Pay-TV
-
4. Platform
- 4.1. Gaming Consoles
- 4.2. Laptops & Desktops
- 4.3. Smartphones & Tablets
- 4.4. Smart TV
-
5. Revenue Model
- 5.1. Advertising
- 5.2. Rental
- 5.3. Subscription
-
6. Deployment Type
- 6.1. Cloud
- 6.2. On-Premises
-
7. End User
- 7.1. Enterprise
- 7.2. Consumer
Video Streaming Market Segmentation By Geography
- 1. North America
- 2. Europe
- 3. Asia
- 4. Australia and New Zealand
- 5. Latin America
- 6. Middle East and Africa
Video Streaming Market REPORT HIGHLIGHTS
| Aspects | Details |
|---|---|
| Study Period | 2019-2033 |
| Base Year | 2024 |
| Estimated Year | 2025 |
| Forecast Period | 2025-2033 |
| Historical Period | 2019-2024 |
| Growth Rate | CAGR of 23.59% from 2019-2033 |
| Segmentation |
|
Table of Contents
- 1. Introduction
- 1.1. Research Scope
- 1.2. Market Segmentation
- 1.3. Research Methodology
- 1.4. Definitions and Assumptions
- 2. Executive Summary
- 2.1. Introduction
- 3. Market Dynamics
- 3.1. Introduction
- 3.2. Market Drivers
- 3.2.1 Growing Availability of High-speed Internet Connections; Rising Popularity of Live Streaming Events
- 3.2.2 such as Sports
- 3.2.3 Concerts
- 3.2.4 and Gaming
- 3.3. Market Restrains
- 3.3.1. Content Piracy and Unauthorized Distribution of Copyrighted Material; High Costs of Content Licensing and Production
- 3.4. Market Trends
- 3.4.1. Growing Availability of High-speed Internet Connections
- 4. Market Factor Analysis
- 4.1. Porters Five Forces
- 4.2. Supply/Value Chain
- 4.3. PESTEL analysis
- 4.4. Market Entropy
- 4.5. Patent/Trademark Analysis
- 5. Global Video Streaming Market Analysis, Insights and Forecast, 2019-2031
- 5.1. Market Analysis, Insights and Forecast - by Streaming Type
- 5.1.1. Live Video Streaming
- 5.1.2. Non-Linear Video Streaming
- 5.2. Market Analysis, Insights and Forecast - by Component
- 5.2.1. Software
- 5.2.2. Services
- 5.3. Market Analysis, Insights and Forecast - by Solutions
- 5.3.1. Internet Protocol TV
- 5.3.2. Over-the-Top (OTT)
- 5.3.3. Cable TV
- 5.3.4. Pay-TV
- 5.4. Market Analysis, Insights and Forecast - by Platform
- 5.4.1. Gaming Consoles
- 5.4.2. Laptops & Desktops
- 5.4.3. Smartphones & Tablets
- 5.4.4. Smart TV
- 5.5. Market Analysis, Insights and Forecast - by Revenue Model
- 5.5.1. Advertising
- 5.5.2. Rental
- 5.5.3. Subscription
- 5.6. Market Analysis, Insights and Forecast - by Deployment Type
- 5.6.1. Cloud
- 5.6.2. On-Premises
- 5.7. Market Analysis, Insights and Forecast - by End User
- 5.7.1. Enterprise
- 5.7.2. Consumer
- 5.8. Market Analysis, Insights and Forecast - by Region
- 5.8.1. North America
- 5.8.2. Europe
- 5.8.3. Asia
- 5.8.4. Australia and New Zealand
- 5.8.5. Latin America
- 5.8.6. Middle East and Africa
- 5.1. Market Analysis, Insights and Forecast - by Streaming Type
- 6. North America Video Streaming Market Analysis, Insights and Forecast, 2019-2031
- 6.1. Market Analysis, Insights and Forecast - by Streaming Type
- 6.1.1. Live Video Streaming
- 6.1.2. Non-Linear Video Streaming
- 6.2. Market Analysis, Insights and Forecast - by Component
- 6.2.1. Software
- 6.2.2. Services
- 6.3. Market Analysis, Insights and Forecast - by Solutions
- 6.3.1. Internet Protocol TV
- 6.3.2. Over-the-Top (OTT)
- 6.3.3. Cable TV
- 6.3.4. Pay-TV
- 6.4. Market Analysis, Insights and Forecast - by Platform
- 6.4.1. Gaming Consoles
- 6.4.2. Laptops & Desktops
- 6.4.3. Smartphones & Tablets
- 6.4.4. Smart TV
- 6.5. Market Analysis, Insights and Forecast - by Revenue Model
- 6.5.1. Advertising
- 6.5.2. Rental
- 6.5.3. Subscription
- 6.6. Market Analysis, Insights and Forecast - by Deployment Type
- 6.6.1. Cloud
- 6.6.2. On-Premises
- 6.7. Market Analysis, Insights and Forecast - by End User
- 6.7.1. Enterprise
- 6.7.2. Consumer
- 6.1. Market Analysis, Insights and Forecast - by Streaming Type
- 7. Europe Video Streaming Market Analysis, Insights and Forecast, 2019-2031
- 7.1. Market Analysis, Insights and Forecast - by Streaming Type
- 7.1.1. Live Video Streaming
- 7.1.2. Non-Linear Video Streaming
- 7.2. Market Analysis, Insights and Forecast - by Component
- 7.2.1. Software
- 7.2.2. Services
- 7.3. Market Analysis, Insights and Forecast - by Solutions
- 7.3.1. Internet Protocol TV
- 7.3.2. Over-the-Top (OTT)
- 7.3.3. Cable TV
- 7.3.4. Pay-TV
- 7.4. Market Analysis, Insights and Forecast - by Platform
- 7.4.1. Gaming Consoles
- 7.4.2. Laptops & Desktops
- 7.4.3. Smartphones & Tablets
- 7.4.4. Smart TV
- 7.5. Market Analysis, Insights and Forecast - by Revenue Model
- 7.5.1. Advertising
- 7.5.2. Rental
- 7.5.3. Subscription
- 7.6. Market Analysis, Insights and Forecast - by Deployment Type
- 7.6.1. Cloud
- 7.6.2. On-Premises
- 7.7. Market Analysis, Insights and Forecast - by End User
- 7.7.1. Enterprise
- 7.7.2. Consumer
- 7.1. Market Analysis, Insights and Forecast - by Streaming Type
- 8. Asia Video Streaming Market Analysis, Insights and Forecast, 2019-2031
- 8.1. Market Analysis, Insights and Forecast - by Streaming Type
- 8.1.1. Live Video Streaming
- 8.1.2. Non-Linear Video Streaming
- 8.2. Market Analysis, Insights and Forecast - by Component
- 8.2.1. Software
- 8.2.2. Services
- 8.3. Market Analysis, Insights and Forecast - by Solutions
- 8.3.1. Internet Protocol TV
- 8.3.2. Over-the-Top (OTT)
- 8.3.3. Cable TV
- 8.3.4. Pay-TV
- 8.4. Market Analysis, Insights and Forecast - by Platform
- 8.4.1. Gaming Consoles
- 8.4.2. Laptops & Desktops
- 8.4.3. Smartphones & Tablets
- 8.4.4. Smart TV
- 8.5. Market Analysis, Insights and Forecast - by Revenue Model
- 8.5.1. Advertising
- 8.5.2. Rental
- 8.5.3. Subscription
- 8.6. Market Analysis, Insights and Forecast - by Deployment Type
- 8.6.1. Cloud
- 8.6.2. On-Premises
- 8.7. Market Analysis, Insights and Forecast - by End User
- 8.7.1. Enterprise
- 8.7.2. Consumer
- 8.1. Market Analysis, Insights and Forecast - by Streaming Type
- 9. Australia and New Zealand Video Streaming Market Analysis, Insights and Forecast, 2019-2031
- 9.1. Market Analysis, Insights and Forecast - by Streaming Type
- 9.1.1. Live Video Streaming
- 9.1.2. Non-Linear Video Streaming
- 9.2. Market Analysis, Insights and Forecast - by Component
- 9.2.1. Software
- 9.2.2. Services
- 9.3. Market Analysis, Insights and Forecast - by Solutions
- 9.3.1. Internet Protocol TV
- 9.3.2. Over-the-Top (OTT)
- 9.3.3. Cable TV
- 9.3.4. Pay-TV
- 9.4. Market Analysis, Insights and Forecast - by Platform
- 9.4.1. Gaming Consoles
- 9.4.2. Laptops & Desktops
- 9.4.3. Smartphones & Tablets
- 9.4.4. Smart TV
- 9.5. Market Analysis, Insights and Forecast - by Revenue Model
- 9.5.1. Advertising
- 9.5.2. Rental
- 9.5.3. Subscription
- 9.6. Market Analysis, Insights and Forecast - by Deployment Type
- 9.6.1. Cloud
- 9.6.2. On-Premises
- 9.7. Market Analysis, Insights and Forecast - by End User
- 9.7.1. Enterprise
- 9.7.2. Consumer
- 9.1. Market Analysis, Insights and Forecast - by Streaming Type
- 10. Latin America Video Streaming Market Analysis, Insights and Forecast, 2019-2031
- 10.1. Market Analysis, Insights and Forecast - by Streaming Type
- 10.1.1. Live Video Streaming
- 10.1.2. Non-Linear Video Streaming
- 10.2. Market Analysis, Insights and Forecast - by Component
- 10.2.1. Software
- 10.2.2. Services
- 10.3. Market Analysis, Insights and Forecast - by Solutions
- 10.3.1. Internet Protocol TV
- 10.3.2. Over-the-Top (OTT)
- 10.3.3. Cable TV
- 10.3.4. Pay-TV
- 10.4. Market Analysis, Insights and Forecast - by Platform
- 10.4.1. Gaming Consoles
- 10.4.2. Laptops & Desktops
- 10.4.3. Smartphones & Tablets
- 10.4.4. Smart TV
- 10.5. Market Analysis, Insights and Forecast - by Revenue Model
- 10.5.1. Advertising
- 10.5.2. Rental
- 10.5.3. Subscription
- 10.6. Market Analysis, Insights and Forecast - by Deployment Type
- 10.6.1. Cloud
- 10.6.2. On-Premises
- 10.7. Market Analysis, Insights and Forecast - by End User
- 10.7.1. Enterprise
- 10.7.2. Consumer
- 10.1. Market Analysis, Insights and Forecast - by Streaming Type
- 11. Middle East and Africa Video Streaming Market Analysis, Insights and Forecast, 2019-2031
- 11.1. Market Analysis, Insights and Forecast - by Streaming Type
- 11.1.1. Live Video Streaming
- 11.1.2. Non-Linear Video Streaming
- 11.2. Market Analysis, Insights and Forecast - by Component
- 11.2.1. Software
- 11.2.2. Services
- 11.3. Market Analysis, Insights and Forecast - by Solutions
- 11.3.1. Internet Protocol TV
- 11.3.2. Over-the-Top (OTT)
- 11.3.3. Cable TV
- 11.3.4. Pay-TV
- 11.4. Market Analysis, Insights and Forecast - by Platform
- 11.4.1. Gaming Consoles
- 11.4.2. Laptops & Desktops
- 11.4.3. Smartphones & Tablets
- 11.4.4. Smart TV
- 11.5. Market Analysis, Insights and Forecast - by Revenue Model
- 11.5.1. Advertising
- 11.5.2. Rental
- 11.5.3. Subscription
- 11.6. Market Analysis, Insights and Forecast - by Deployment Type
- 11.6.1. Cloud
- 11.6.2. On-Premises
- 11.7. Market Analysis, Insights and Forecast - by End User
- 11.7.1. Enterprise
- 11.7.2. Consumer
- 11.1. Market Analysis, Insights and Forecast - by Streaming Type
- 12. North America Video Streaming Market Analysis, Insights and Forecast, 2019-2031
- 12.1. Market Analysis, Insights and Forecast - By Country/Sub-region
- 12.1.1 United States
- 12.1.2 Canada
- 12.1.3 Mexico
- 13. Europe Video Streaming Market Analysis, Insights and Forecast, 2019-2031
- 13.1. Market Analysis, Insights and Forecast - By Country/Sub-region
- 13.1.1 Germany
- 13.1.2 United Kingdom
- 13.1.3 France
- 13.1.4 Spain
- 13.1.5 Italy
- 13.1.6 Spain
- 13.1.7 Belgium
- 13.1.8 Netherland
- 13.1.9 Nordics
- 13.1.10 Rest of Europe
- 14. Asia Pacific Video Streaming Market Analysis, Insights and Forecast, 2019-2031
- 14.1. Market Analysis, Insights and Forecast - By Country/Sub-region
- 14.1.1 China
- 14.1.2 Japan
- 14.1.3 India
- 14.1.4 South Korea
- 14.1.5 Southeast Asia
- 14.1.6 Australia
- 14.1.7 Indonesia
- 14.1.8 Phillipes
- 14.1.9 Singapore
- 14.1.10 Thailandc
- 14.1.11 Rest of Asia Pacific
- 15. South America Video Streaming Market Analysis, Insights and Forecast, 2019-2031
- 15.1. Market Analysis, Insights and Forecast - By Country/Sub-region
- 15.1.1 Brazil
- 15.1.2 Argentina
- 15.1.3 Peru
- 15.1.4 Chile
- 15.1.5 Colombia
- 15.1.6 Ecuador
- 15.1.7 Venezuela
- 15.1.8 Rest of South America
- 16. North America Video Streaming Market Analysis, Insights and Forecast, 2019-2031
- 16.1. Market Analysis, Insights and Forecast - By Country/Sub-region
- 16.1.1 United States
- 16.1.2 Canada
- 16.1.3 Mexico
- 17. MEA Video Streaming Market Analysis, Insights and Forecast, 2019-2031
- 17.1. Market Analysis, Insights and Forecast - By Country/Sub-region
- 17.1.1 United Arab Emirates
- 17.1.2 Saudi Arabia
- 17.1.3 South Africa
- 17.1.4 Rest of Middle East and Africa
- 18. Competitive Analysis
- 18.1. Global Market Share Analysis 2024
- 18.2. Company Profiles
- 18.2.1 Hulu LLC (The Walt Disney Company)
- 18.2.1.1. Overview
- 18.2.1.2. Products
- 18.2.1.3. SWOT Analysis
- 18.2.1.4. Recent Developments
- 18.2.1.5. Financials (Based on Availability)
- 18.2.2 Akamai Technologies Inc
- 18.2.2.1. Overview
- 18.2.2.2. Products
- 18.2.2.3. SWOT Analysis
- 18.2.2.4. Recent Developments
- 18.2.2.5. Financials (Based on Availability)
- 18.2.3 IBM Corporation
- 18.2.3.1. Overview
- 18.2.3.2. Products
- 18.2.3.3. SWOT Analysis
- 18.2.3.4. Recent Developments
- 18.2.3.5. Financials (Based on Availability)
- 18.2.4 Netflix Inc
- 18.2.4.1. Overview
- 18.2.4.2. Products
- 18.2.4.3. SWOT Analysis
- 18.2.4.4. Recent Developments
- 18.2.4.5. Financials (Based on Availability)
- 18.2.5 Warner Bros Discovery Inc *List Not Exhaustive
- 18.2.5.1. Overview
- 18.2.5.2. Products
- 18.2.5.3. SWOT Analysis
- 18.2.5.4. Recent Developments
- 18.2.5.5. Financials (Based on Availability)
- 18.2.6 Alphabet Inc
- 18.2.6.1. Overview
- 18.2.6.2. Products
- 18.2.6.3. SWOT Analysis
- 18.2.6.4. Recent Developments
- 18.2.6.5. Financials (Based on Availability)
- 18.2.7 Tencent Holdings Limited
- 18.2.7.1. Overview
- 18.2.7.2. Products
- 18.2.7.3. SWOT Analysis
- 18.2.7.4. Recent Developments
- 18.2.7.5. Financials (Based on Availability)
- 18.2.8 Haivision Systems Inc
- 18.2.8.1. Overview
- 18.2.8.2. Products
- 18.2.8.3. SWOT Analysis
- 18.2.8.4. Recent Developments
- 18.2.8.5. Financials (Based on Availability)
- 18.2.9 Roku Inc
- 18.2.9.1. Overview
- 18.2.9.2. Products
- 18.2.9.3. SWOT Analysis
- 18.2.9.4. Recent Developments
- 18.2.9.5. Financials (Based on Availability)
- 18.2.10 Amazon com Inc
- 18.2.10.1. Overview
- 18.2.10.2. Products
- 18.2.10.3. SWOT Analysis
- 18.2.10.4. Recent Developments
- 18.2.10.5. Financials (Based on Availability)
- 18.2.11 Brightcove Inc
- 18.2.11.1. Overview
- 18.2.11.2. Products
- 18.2.11.3. SWOT Analysis
- 18.2.11.4. Recent Developments
- 18.2.11.5. Financials (Based on Availability)
- 18.2.12 Apple Inc
- 18.2.12.1. Overview
- 18.2.12.2. Products
- 18.2.12.3. SWOT Analysis
- 18.2.12.4. Recent Developments
- 18.2.12.5. Financials (Based on Availability)
- 18.2.1 Hulu LLC (The Walt Disney Company)
List of Figures
- Figure 1: Global Video Streaming Market Revenue Breakdown (Million, %) by Region 2024 & 2032
- Figure 2: North America Video Streaming Market Revenue (Million), by Country 2024 & 2032
- Figure 3: North America Video Streaming Market Revenue Share (%), by Country 2024 & 2032
- Figure 4: Europe Video Streaming Market Revenue (Million), by Country 2024 & 2032
- Figure 5: Europe Video Streaming Market Revenue Share (%), by Country 2024 & 2032
- Figure 6: Asia Pacific Video Streaming Market Revenue (Million), by Country 2024 & 2032
- Figure 7: Asia Pacific Video Streaming Market Revenue Share (%), by Country 2024 & 2032
- Figure 8: South America Video Streaming Market Revenue (Million), by Country 2024 & 2032
- Figure 9: South America Video Streaming Market Revenue Share (%), by Country 2024 & 2032
- Figure 10: North America Video Streaming Market Revenue (Million), by Country 2024 & 2032
- Figure 11: North America Video Streaming Market Revenue Share (%), by Country 2024 & 2032
- Figure 12: MEA Video Streaming Market Revenue (Million), by Country 2024 & 2032
- Figure 13: MEA Video Streaming Market Revenue Share (%), by Country 2024 & 2032
- Figure 14: North America Video Streaming Market Revenue (Million), by Streaming Type 2024 & 2032
- Figure 15: North America Video Streaming Market Revenue Share (%), by Streaming Type 2024 & 2032
- Figure 16: North America Video Streaming Market Revenue (Million), by Component 2024 & 2032
- Figure 17: North America Video Streaming Market Revenue Share (%), by Component 2024 & 2032
- Figure 18: North America Video Streaming Market Revenue (Million), by Solutions 2024 & 2032
- Figure 19: North America Video Streaming Market Revenue Share (%), by Solutions 2024 & 2032
- Figure 20: North America Video Streaming Market Revenue (Million), by Platform 2024 & 2032
- Figure 21: North America Video Streaming Market Revenue Share (%), by Platform 2024 & 2032
- Figure 22: North America Video Streaming Market Revenue (Million), by Revenue Model 2024 & 2032
- Figure 23: North America Video Streaming Market Revenue Share (%), by Revenue Model 2024 & 2032
- Figure 24: North America Video Streaming Market Revenue (Million), by Deployment Type 2024 & 2032
- Figure 25: North America Video Streaming Market Revenue Share (%), by Deployment Type 2024 & 2032
- Figure 26: North America Video Streaming Market Revenue (Million), by End User 2024 & 2032
- Figure 27: North America Video Streaming Market Revenue Share (%), by End User 2024 & 2032
- Figure 28: North America Video Streaming Market Revenue (Million), by Country 2024 & 2032
- Figure 29: North America Video Streaming Market Revenue Share (%), by Country 2024 & 2032
- Figure 30: Europe Video Streaming Market Revenue (Million), by Streaming Type 2024 & 2032
- Figure 31: Europe Video Streaming Market Revenue Share (%), by Streaming Type 2024 & 2032
- Figure 32: Europe Video Streaming Market Revenue (Million), by Component 2024 & 2032
- Figure 33: Europe Video Streaming Market Revenue Share (%), by Component 2024 & 2032
- Figure 34: Europe Video Streaming Market Revenue (Million), by Solutions 2024 & 2032
- Figure 35: Europe Video Streaming Market Revenue Share (%), by Solutions 2024 & 2032
- Figure 36: Europe Video Streaming Market Revenue (Million), by Platform 2024 & 2032
- Figure 37: Europe Video Streaming Market Revenue Share (%), by Platform 2024 & 2032
- Figure 38: Europe Video Streaming Market Revenue (Million), by Revenue Model 2024 & 2032
- Figure 39: Europe Video Streaming Market Revenue Share (%), by Revenue Model 2024 & 2032
- Figure 40: Europe Video Streaming Market Revenue (Million), by Deployment Type 2024 & 2032
- Figure 41: Europe Video Streaming Market Revenue Share (%), by Deployment Type 2024 & 2032
- Figure 42: Europe Video Streaming Market Revenue (Million), by End User 2024 & 2032
- Figure 43: Europe Video Streaming Market Revenue Share (%), by End User 2024 & 2032
- Figure 44: Europe Video Streaming Market Revenue (Million), by Country 2024 & 2032
- Figure 45: Europe Video Streaming Market Revenue Share (%), by Country 2024 & 2032
- Figure 46: Asia Video Streaming Market Revenue (Million), by Streaming Type 2024 & 2032
- Figure 47: Asia Video Streaming Market Revenue Share (%), by Streaming Type 2024 & 2032
- Figure 48: Asia Video Streaming Market Revenue (Million), by Component 2024 & 2032
- Figure 49: Asia Video Streaming Market Revenue Share (%), by Component 2024 & 2032
- Figure 50: Asia Video Streaming Market Revenue (Million), by Solutions 2024 & 2032
- Figure 51: Asia Video Streaming Market Revenue Share (%), by Solutions 2024 & 2032
- Figure 52: Asia Video Streaming Market Revenue (Million), by Platform 2024 & 2032
- Figure 53: Asia Video Streaming Market Revenue Share (%), by Platform 2024 & 2032
- Figure 54: Asia Video Streaming Market Revenue (Million), by Revenue Model 2024 & 2032
- Figure 55: Asia Video Streaming Market Revenue Share (%), by Revenue Model 2024 & 2032
- Figure 56: Asia Video Streaming Market Revenue (Million), by Deployment Type 2024 & 2032
- Figure 57: Asia Video Streaming Market Revenue Share (%), by Deployment Type 2024 & 2032
- Figure 58: Asia Video Streaming Market Revenue (Million), by End User 2024 & 2032
- Figure 59: Asia Video Streaming Market Revenue Share (%), by End User 2024 & 2032
- Figure 60: Asia Video Streaming Market Revenue (Million), by Country 2024 & 2032
- Figure 61: Asia Video Streaming Market Revenue Share (%), by Country 2024 & 2032
- Figure 62: Australia and New Zealand Video Streaming Market Revenue (Million), by Streaming Type 2024 & 2032
- Figure 63: Australia and New Zealand Video Streaming Market Revenue Share (%), by Streaming Type 2024 & 2032
- Figure 64: Australia and New Zealand Video Streaming Market Revenue (Million), by Component 2024 & 2032
- Figure 65: Australia and New Zealand Video Streaming Market Revenue Share (%), by Component 2024 & 2032
- Figure 66: Australia and New Zealand Video Streaming Market Revenue (Million), by Solutions 2024 & 2032
- Figure 67: Australia and New Zealand Video Streaming Market Revenue Share (%), by Solutions 2024 & 2032
- Figure 68: Australia and New Zealand Video Streaming Market Revenue (Million), by Platform 2024 & 2032
- Figure 69: Australia and New Zealand Video Streaming Market Revenue Share (%), by Platform 2024 & 2032
- Figure 70: Australia and New Zealand Video Streaming Market Revenue (Million), by Revenue Model 2024 & 2032
- Figure 71: Australia and New Zealand Video Streaming Market Revenue Share (%), by Revenue Model 2024 & 2032
- Figure 72: Australia and New Zealand Video Streaming Market Revenue (Million), by Deployment Type 2024 & 2032
- Figure 73: Australia and New Zealand Video Streaming Market Revenue Share (%), by Deployment Type 2024 & 2032
- Figure 74: Australia and New Zealand Video Streaming Market Revenue (Million), by End User 2024 & 2032
- Figure 75: Australia and New Zealand Video Streaming Market Revenue Share (%), by End User 2024 & 2032
- Figure 76: Australia and New Zealand Video Streaming Market Revenue (Million), by Country 2024 & 2032
- Figure 77: Australia and New Zealand Video Streaming Market Revenue Share (%), by Country 2024 & 2032
- Figure 78: Latin America Video Streaming Market Revenue (Million), by Streaming Type 2024 & 2032
- Figure 79: Latin America Video Streaming Market Revenue Share (%), by Streaming Type 2024 & 2032
- Figure 80: Latin America Video Streaming Market Revenue (Million), by Component 2024 & 2032
- Figure 81: Latin America Video Streaming Market Revenue Share (%), by Component 2024 & 2032
- Figure 82: Latin America Video Streaming Market Revenue (Million), by Solutions 2024 & 2032
- Figure 83: Latin America Video Streaming Market Revenue Share (%), by Solutions 2024 & 2032
- Figure 84: Latin America Video Streaming Market Revenue (Million), by Platform 2024 & 2032
- Figure 85: Latin America Video Streaming Market Revenue Share (%), by Platform 2024 & 2032
- Figure 86: Latin America Video Streaming Market Revenue (Million), by Revenue Model 2024 & 2032
- Figure 87: Latin America Video Streaming Market Revenue Share (%), by Revenue Model 2024 & 2032
- Figure 88: Latin America Video Streaming Market Revenue (Million), by Deployment Type 2024 & 2032
- Figure 89: Latin America Video Streaming Market Revenue Share (%), by Deployment Type 2024 & 2032
- Figure 90: Latin America Video Streaming Market Revenue (Million), by End User 2024 & 2032
- Figure 91: Latin America Video Streaming Market Revenue Share (%), by End User 2024 & 2032
- Figure 92: Latin America Video Streaming Market Revenue (Million), by Country 2024 & 2032
- Figure 93: Latin America Video Streaming Market Revenue Share (%), by Country 2024 & 2032
- Figure 94: Middle East and Africa Video Streaming Market Revenue (Million), by Streaming Type 2024 & 2032
- Figure 95: Middle East and Africa Video Streaming Market Revenue Share (%), by Streaming Type 2024 & 2032
- Figure 96: Middle East and Africa Video Streaming Market Revenue (Million), by Component 2024 & 2032
- Figure 97: Middle East and Africa Video Streaming Market Revenue Share (%), by Component 2024 & 2032
- Figure 98: Middle East and Africa Video Streaming Market Revenue (Million), by Solutions 2024 & 2032
- Figure 99: Middle East and Africa Video Streaming Market Revenue Share (%), by Solutions 2024 & 2032
- Figure 100: Middle East and Africa Video Streaming Market Revenue (Million), by Platform 2024 & 2032
- Figure 101: Middle East and Africa Video Streaming Market Revenue Share (%), by Platform 2024 & 2032
- Figure 102: Middle East and Africa Video Streaming Market Revenue (Million), by Revenue Model 2024 & 2032
- Figure 103: Middle East and Africa Video Streaming Market Revenue Share (%), by Revenue Model 2024 & 2032
- Figure 104: Middle East and Africa Video Streaming Market Revenue (Million), by Deployment Type 2024 & 2032
- Figure 105: Middle East and Africa Video Streaming Market Revenue Share (%), by Deployment Type 2024 & 2032
- Figure 106: Middle East and Africa Video Streaming Market Revenue (Million), by End User 2024 & 2032
- Figure 107: Middle East and Africa Video Streaming Market Revenue Share (%), by End User 2024 & 2032
- Figure 108: Middle East and Africa Video Streaming Market Revenue (Million), by Country 2024 & 2032
- Figure 109: Middle East and Africa Video Streaming Market Revenue Share (%), by Country 2024 & 2032
List of Tables
- Table 1: Global Video Streaming Market Revenue Million Forecast, by Region 2019 & 2032
- Table 2: Global Video Streaming Market Revenue Million Forecast, by Streaming Type 2019 & 2032
- Table 3: Global Video Streaming Market Revenue Million Forecast, by Component 2019 & 2032
- Table 4: Global Video Streaming Market Revenue Million Forecast, by Solutions 2019 & 2032
- Table 5: Global Video Streaming Market Revenue Million Forecast, by Platform 2019 & 2032
- Table 6: Global Video Streaming Market Revenue Million Forecast, by Revenue Model 2019 & 2032
- Table 7: Global Video Streaming Market Revenue Million Forecast, by Deployment Type 2019 & 2032
- Table 8: Global Video Streaming Market Revenue Million Forecast, by End User 2019 & 2032
- Table 9: Global Video Streaming Market Revenue Million Forecast, by Region 2019 & 2032
- Table 10: Global Video Streaming Market Revenue Million Forecast, by Country 2019 & 2032
- Table 11: United States Video Streaming Market Revenue (Million) Forecast, by Application 2019 & 2032
- Table 12: Canada Video Streaming Market Revenue (Million) Forecast, by Application 2019 & 2032
- Table 13: Mexico Video Streaming Market Revenue (Million) Forecast, by Application 2019 & 2032
- Table 14: Global Video Streaming Market Revenue Million Forecast, by Country 2019 & 2032
- Table 15: Germany Video Streaming Market Revenue (Million) Forecast, by Application 2019 & 2032
- Table 16: United Kingdom Video Streaming Market Revenue (Million) Forecast, by Application 2019 & 2032
- Table 17: France Video Streaming Market Revenue (Million) Forecast, by Application 2019 & 2032
- Table 18: Spain Video Streaming Market Revenue (Million) Forecast, by Application 2019 & 2032
- Table 19: Italy Video Streaming Market Revenue (Million) Forecast, by Application 2019 & 2032
- Table 20: Spain Video Streaming Market Revenue (Million) Forecast, by Application 2019 & 2032
- Table 21: Belgium Video Streaming Market Revenue (Million) Forecast, by Application 2019 & 2032
- Table 22: Netherland Video Streaming Market Revenue (Million) Forecast, by Application 2019 & 2032
- Table 23: Nordics Video Streaming Market Revenue (Million) Forecast, by Application 2019 & 2032
- Table 24: Rest of Europe Video Streaming Market Revenue (Million) Forecast, by Application 2019 & 2032
- Table 25: Global Video Streaming Market Revenue Million Forecast, by Country 2019 & 2032
- Table 26: China Video Streaming Market Revenue (Million) Forecast, by Application 2019 & 2032
- Table 27: Japan Video Streaming Market Revenue (Million) Forecast, by Application 2019 & 2032
- Table 28: India Video Streaming Market Revenue (Million) Forecast, by Application 2019 & 2032
- Table 29: South Korea Video Streaming Market Revenue (Million) Forecast, by Application 2019 & 2032
- Table 30: Southeast Asia Video Streaming Market Revenue (Million) Forecast, by Application 2019 & 2032
- Table 31: Australia Video Streaming Market Revenue (Million) Forecast, by Application 2019 & 2032
- Table 32: Indonesia Video Streaming Market Revenue (Million) Forecast, by Application 2019 & 2032
- Table 33: Phillipes Video Streaming Market Revenue (Million) Forecast, by Application 2019 & 2032
- Table 34: Singapore Video Streaming Market Revenue (Million) Forecast, by Application 2019 & 2032
- Table 35: Thailandc Video Streaming Market Revenue (Million) Forecast, by Application 2019 & 2032
- Table 36: Rest of Asia Pacific Video Streaming Market Revenue (Million) Forecast, by Application 2019 & 2032
- Table 37: Global Video Streaming Market Revenue Million Forecast, by Country 2019 & 2032
- Table 38: Brazil Video Streaming Market Revenue (Million) Forecast, by Application 2019 & 2032
- Table 39: Argentina Video Streaming Market Revenue (Million) Forecast, by Application 2019 & 2032
- Table 40: Peru Video Streaming Market Revenue (Million) Forecast, by Application 2019 & 2032
- Table 41: Chile Video Streaming Market Revenue (Million) Forecast, by Application 2019 & 2032
- Table 42: Colombia Video Streaming Market Revenue (Million) Forecast, by Application 2019 & 2032
- Table 43: Ecuador Video Streaming Market Revenue (Million) Forecast, by Application 2019 & 2032
- Table 44: Venezuela Video Streaming Market Revenue (Million) Forecast, by Application 2019 & 2032
- Table 45: Rest of South America Video Streaming Market Revenue (Million) Forecast, by Application 2019 & 2032
- Table 46: Global Video Streaming Market Revenue Million Forecast, by Country 2019 & 2032
- Table 47: United States Video Streaming Market Revenue (Million) Forecast, by Application 2019 & 2032
- Table 48: Canada Video Streaming Market Revenue (Million) Forecast, by Application 2019 & 2032
- Table 49: Mexico Video Streaming Market Revenue (Million) Forecast, by Application 2019 & 2032
- Table 50: Global Video Streaming Market Revenue Million Forecast, by Country 2019 & 2032
- Table 51: United Arab Emirates Video Streaming Market Revenue (Million) Forecast, by Application 2019 & 2032
- Table 52: Saudi Arabia Video Streaming Market Revenue (Million) Forecast, by Application 2019 & 2032
- Table 53: South Africa Video Streaming Market Revenue (Million) Forecast, by Application 2019 & 2032
- Table 54: Rest of Middle East and Africa Video Streaming Market Revenue (Million) Forecast, by Application 2019 & 2032
- Table 55: Global Video Streaming Market Revenue Million Forecast, by Streaming Type 2019 & 2032
- Table 56: Global Video Streaming Market Revenue Million Forecast, by Component 2019 & 2032
- Table 57: Global Video Streaming Market Revenue Million Forecast, by Solutions 2019 & 2032
- Table 58: Global Video Streaming Market Revenue Million Forecast, by Platform 2019 & 2032
- Table 59: Global Video Streaming Market Revenue Million Forecast, by Revenue Model 2019 & 2032
- Table 60: Global Video Streaming Market Revenue Million Forecast, by Deployment Type 2019 & 2032
- Table 61: Global Video Streaming Market Revenue Million Forecast, by End User 2019 & 2032
- Table 62: Global Video Streaming Market Revenue Million Forecast, by Country 2019 & 2032
- Table 63: Global Video Streaming Market Revenue Million Forecast, by Streaming Type 2019 & 2032
- Table 64: Global Video Streaming Market Revenue Million Forecast, by Component 2019 & 2032
- Table 65: Global Video Streaming Market Revenue Million Forecast, by Solutions 2019 & 2032
- Table 66: Global Video Streaming Market Revenue Million Forecast, by Platform 2019 & 2032
- Table 67: Global Video Streaming Market Revenue Million Forecast, by Revenue Model 2019 & 2032
- Table 68: Global Video Streaming Market Revenue Million Forecast, by Deployment Type 2019 & 2032
- Table 69: Global Video Streaming Market Revenue Million Forecast, by End User 2019 & 2032
- Table 70: Global Video Streaming Market Revenue Million Forecast, by Country 2019 & 2032
- Table 71: Global Video Streaming Market Revenue Million Forecast, by Streaming Type 2019 & 2032
- Table 72: Global Video Streaming Market Revenue Million Forecast, by Component 2019 & 2032
- Table 73: Global Video Streaming Market Revenue Million Forecast, by Solutions 2019 & 2032
- Table 74: Global Video Streaming Market Revenue Million Forecast, by Platform 2019 & 2032
- Table 75: Global Video Streaming Market Revenue Million Forecast, by Revenue Model 2019 & 2032
- Table 76: Global Video Streaming Market Revenue Million Forecast, by Deployment Type 2019 & 2032
- Table 77: Global Video Streaming Market Revenue Million Forecast, by End User 2019 & 2032
- Table 78: Global Video Streaming Market Revenue Million Forecast, by Country 2019 & 2032
- Table 79: Global Video Streaming Market Revenue Million Forecast, by Streaming Type 2019 & 2032
- Table 80: Global Video Streaming Market Revenue Million Forecast, by Component 2019 & 2032
- Table 81: Global Video Streaming Market Revenue Million Forecast, by Solutions 2019 & 2032
- Table 82: Global Video Streaming Market Revenue Million Forecast, by Platform 2019 & 2032
- Table 83: Global Video Streaming Market Revenue Million Forecast, by Revenue Model 2019 & 2032
- Table 84: Global Video Streaming Market Revenue Million Forecast, by Deployment Type 2019 & 2032
- Table 85: Global Video Streaming Market Revenue Million Forecast, by End User 2019 & 2032
- Table 86: Global Video Streaming Market Revenue Million Forecast, by Country 2019 & 2032
- Table 87: Global Video Streaming Market Revenue Million Forecast, by Streaming Type 2019 & 2032
- Table 88: Global Video Streaming Market Revenue Million Forecast, by Component 2019 & 2032
- Table 89: Global Video Streaming Market Revenue Million Forecast, by Solutions 2019 & 2032
- Table 90: Global Video Streaming Market Revenue Million Forecast, by Platform 2019 & 2032
- Table 91: Global Video Streaming Market Revenue Million Forecast, by Revenue Model 2019 & 2032
- Table 92: Global Video Streaming Market Revenue Million Forecast, by Deployment Type 2019 & 2032
- Table 93: Global Video Streaming Market Revenue Million Forecast, by End User 2019 & 2032
- Table 94: Global Video Streaming Market Revenue Million Forecast, by Country 2019 & 2032
- Table 95: Global Video Streaming Market Revenue Million Forecast, by Streaming Type 2019 & 2032
- Table 96: Global Video Streaming Market Revenue Million Forecast, by Component 2019 & 2032
- Table 97: Global Video Streaming Market Revenue Million Forecast, by Solutions 2019 & 2032
- Table 98: Global Video Streaming Market Revenue Million Forecast, by Platform 2019 & 2032
- Table 99: Global Video Streaming Market Revenue Million Forecast, by Revenue Model 2019 & 2032
- Table 100: Global Video Streaming Market Revenue Million Forecast, by Deployment Type 2019 & 2032
- Table 101: Global Video Streaming Market Revenue Million Forecast, by End User 2019 & 2032
- Table 102: Global Video Streaming Market Revenue Million Forecast, by Country 2019 & 2032
Frequently Asked Questions
1. What is the projected Compound Annual Growth Rate (CAGR) of the Video Streaming Market?
The projected CAGR is approximately 23.59%.
2. Which companies are prominent players in the Video Streaming Market?
Key companies in the market include Hulu LLC (The Walt Disney Company), Akamai Technologies Inc, IBM Corporation, Netflix Inc, Warner Bros Discovery Inc *List Not Exhaustive, Alphabet Inc, Tencent Holdings Limited, Haivision Systems Inc, Roku Inc, Amazon com Inc, Brightcove Inc, Apple Inc.
3. What are the main segments of the Video Streaming Market?
The market segments include Streaming Type, Component, Solutions, Platform, Revenue Model, Deployment Type, End User.
4. Can you provide details about the market size?
The market size is estimated to be USD 129.88 Million as of 2022.
5. What are some drivers contributing to market growth?
Growing Availability of High-speed Internet Connections; Rising Popularity of Live Streaming Events. such as Sports. Concerts. and Gaming.
6. What are the notable trends driving market growth?
Growing Availability of High-speed Internet Connections.
7. Are there any restraints impacting market growth?
Content Piracy and Unauthorized Distribution of Copyrighted Material; High Costs of Content Licensing and Production.
8. Can you provide examples of recent developments in the market?
May 2023: The International Boxing Association (IBA) announced a strategic agreement with OTTera, a top white-label professional service specializing in individualized OTT solutions. The IBA Men's World Boxing Championships served as a backdrop for the agreement's conclusion in Tashkent. This agreement intends to give boxing fans a better watching experience and raise the sport's international visibility owing to the combined expertise of IBA and OTTera.
9. What pricing options are available for accessing the report?
Pricing options include single-user, multi-user, and enterprise licenses priced at USD 4750, USD 5250, and USD 8750 respectively.
10. Is the market size provided in terms of value or volume?
The market size is provided in terms of value, measured in Million.
11. Are there any specific market keywords associated with the report?
Yes, the market keyword associated with the report is "Video Streaming Market," which aids in identifying and referencing the specific market segment covered.
12. How do I determine which pricing option suits my needs best?
The pricing options vary based on user requirements and access needs. Individual users may opt for single-user licenses, while businesses requiring broader access may choose multi-user or enterprise licenses for cost-effective access to the report.
13. Are there any additional resources or data provided in the Video Streaming Market report?
While the report offers comprehensive insights, it's advisable to review the specific contents or supplementary materials provided to ascertain if additional resources or data are available.
14. How can I stay updated on further developments or reports in the Video Streaming Market?
To stay informed about further developments, trends, and reports in the Video Streaming Market, consider subscribing to industry newsletters, following relevant companies and organizations, or regularly checking reputable industry news sources and publications.
Methodology
Step 1 - Identification of Relevant Samples Size from Population Database


Step 2 - Approaches for Defining Global Market Size (Value, Volume* & Price*)

Note*: In applicable scenarios
Step 3 - Data Sources
Primary Research
- Web Analytics
- Survey Reports
- Research Institute
- Latest Research Reports
- Opinion Leaders
Secondary Research
- Annual Reports
- White Paper
- Latest Press Release
- Industry Association
- Paid Database
- Investor Presentations

Step 4 - Data Triangulation
Involves using different sources of information in order to increase the validity of a study
These sources are likely to be stakeholders in a program - participants, other researchers, program staff, other community members, and so on.
Then we put all data in single framework & apply various statistical tools to find out the dynamic on the market.
During the analysis stage, feedback from the stakeholder groups would be compared to determine areas of agreement as well as areas of divergence


