Key Insights
The global Vinyl Acetate market is projected for significant expansion, anticipated to reach approximately $1.97 billion by 2033. With a robust Compound Annual Growth Rate (CAGR) of 5.47%, market growth is fueled by escalating demand in Polyvinyl Acetate (PVA), Polyvinyl Alcohol (PVOH), and Ethylene Vinyl Acetate (EVA) applications. Key sectors driving this demand include automotive and building & construction, supported by increased infrastructure development, rising vehicle production, and a growing preference for sustainable materials. Innovations in EVA for solar panel encapsulation further underscore its versatility and environmental advantages. The Asia Pacific region, led by China and India, is expected to dominate market expansion due to rapid industrialization, burgeoning consumer markets, and supportive government initiatives.
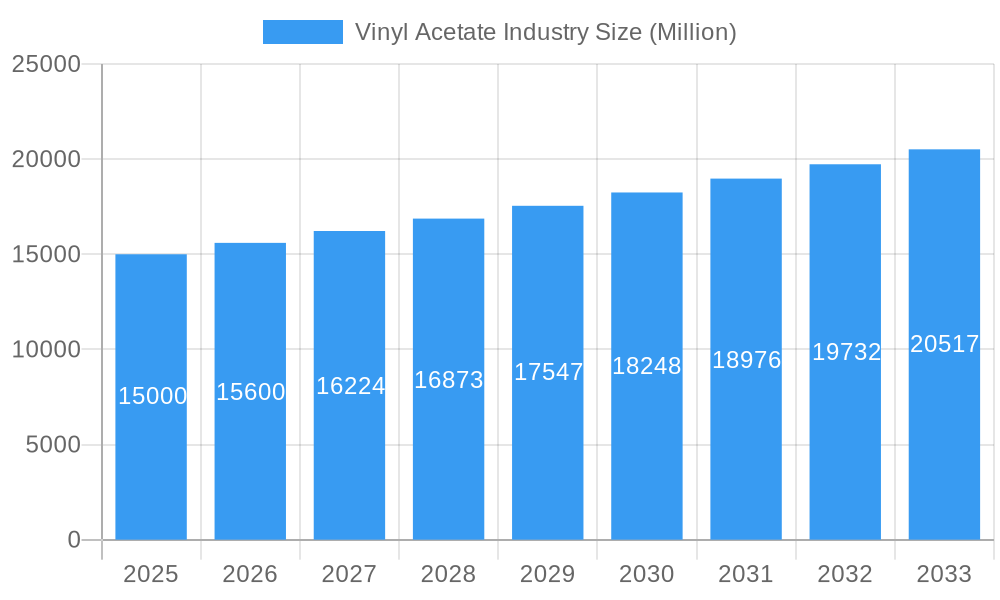
Vinyl Acetate Industry Market Size (In Billion)
Despite a positive market outlook, challenges such as raw material price volatility (ethylene, acetic acid) and stringent environmental regulations may impact profitability. The availability of substitutes in specific applications also presents a restraint. However, ongoing R&D for bio-based vinyl acetate and improved production efficiencies are poised to mitigate these concerns. Leading companies including Arkema, Exxon Mobil Corporation, and Wacker Chemie AG are investing in capacity and technology to secure a competitive edge.
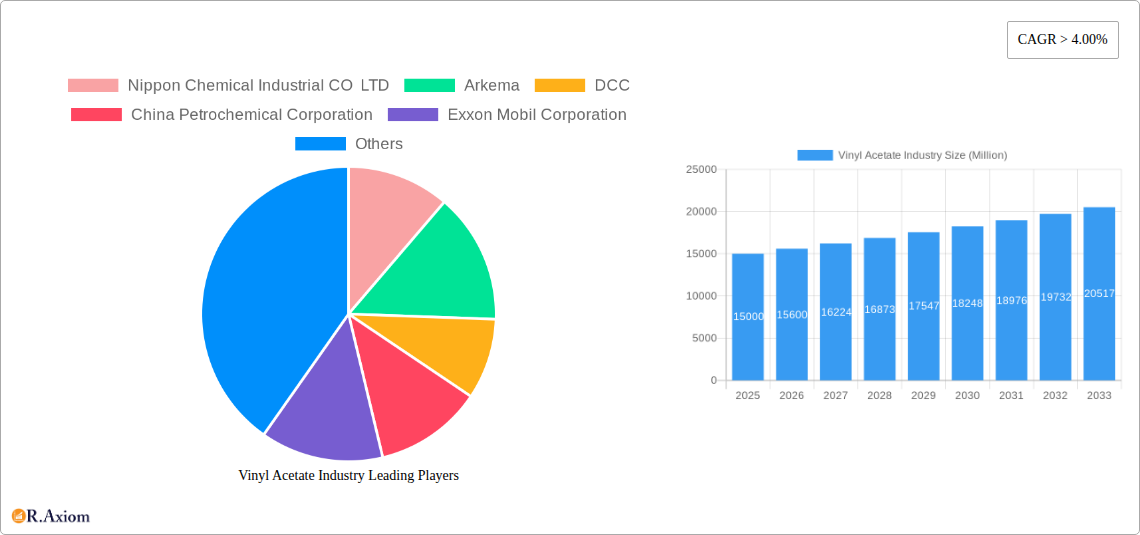
Vinyl Acetate Industry Company Market Share
This report offers a comprehensive analysis of the Vinyl Acetate market, covering market concentration, innovation drivers, industry trends, dominant segments, and strategic outlook. Based on historical data from 2019-2024, with a base year of 2025, and a forecast period extending to 2033, this research is crucial for stakeholders navigating the evolving vinyl acetate landscape. The report utilizes high-impact keywords such as vinyl acetate monomer (VAM), ethylene vinyl acetate (EVA), polyvinyl acetate (PVA), polyvinyl alcohol (PVOH), acetate esters, adhesives, coatings, textiles, solar panel encapsulation, and automotive components.
Vinyl Acetate Industry Market Concentration & Innovation
The global Vinyl Acetate Industry exhibits a moderate to high level of market concentration, with a few key players dominating production and innovation. Major companies like Celanese Corporation, Exxon Mobil Corporation, Arkema, and LyondellBasell Industries Holdings B.V. hold significant market shares, estimated in the range of 15-25% each. Innovation is a critical differentiator, driven by the demand for enhanced performance in downstream applications. Key innovation drivers include the development of higher-purity VAM for specialized polymers, the creation of VAM-based copolymers with tailored properties, and advancements in more sustainable and energy-efficient production processes. Regulatory frameworks, such as environmental protection mandates and REACH (Registration, Evaluation, Authorisation and Restriction of Chemicals) compliance, are shaping production methods and product development. While direct product substitutes for vinyl acetate itself are limited, alternative materials in end-use applications, like different adhesive formulations or polymer types in textiles, represent indirect competitive threats. End-user demand for eco-friendly and high-performance materials continues to influence R&D efforts. Merger and acquisition (M&A) activities, though infrequent in recent years, have historically been strategic for consolidating market presence and acquiring new technologies. A notable M&A deal in the broader chemical industry, involving a value of approximately 1,000 Million USD, highlights the strategic importance of inorganic growth.
Vinyl Acetate Industry Industry Trends & Insights
The Vinyl Acetate Industry is experiencing robust growth, primarily fueled by the expanding demand for its derivatives in diverse end-user sectors. The global market is projected to grow at a Compound Annual Growth Rate (CAGR) of approximately 4.5% from 2025 to 2033, reaching an estimated market size of 85,000 Million USD by 2033. This growth is underpinned by several key trends. Firstly, the increasing consumption of Polyvinyl Acetate (PVA) in paints, coatings, and adhesives is a significant market driver. PVA's excellent binding properties and water-based formulations align with the growing demand for low-VOC (Volatile Organic Compound) products in the building and construction sector. Secondly, the burgeoning solar energy industry is a major contributor, with Ethylene Vinyl Acetate (EVA) films being indispensable for encapsulating solar panels, offering superior UV resistance, adhesion, and durability. Market penetration of EVA in solar applications is estimated to be over 70%. Thirdly, Polyvinyl Alcohol (PVOH), a derivative of PVA, is witnessing increased demand in textile sizing, paper coatings, and as a water-soluble film for packaging, driven by its biodegradability and unique functional properties. Technological disruptions are centered around process optimization for VAM production, aiming to reduce energy consumption and environmental impact, alongside the development of novel VAM-based copolymers for specialized applications. Consumer preferences are shifting towards sustainable and bio-based alternatives, prompting research into bio-derived VAM and more environmentally friendly production methods. Competitive dynamics are characterized by intense competition among established global players, with a focus on cost efficiency, product quality, and supply chain reliability. Investments in capacity expansions and technological upgrades are crucial for maintaining market leadership.
Dominant Markets & Segments in Vinyl Acetate Industry
The Vinyl Acetate Industry exhibits a clear dominance in certain geographical regions and application segments, driven by specific economic and industrial factors.
Dominant Application Segment: Ethylene Vinyl Acetate (EVA) is projected to be the most dominant application segment, accounting for an estimated 35% of the total market share by 2025.
- Key Drivers for EVA Dominance:
- Solar Energy Boom: The insatiable demand for solar panels worldwide, particularly in Asia-Pacific and Europe, makes EVA films a critical component for their encapsulation. Government incentives for renewable energy further fuel this demand.
- Automotive Innovation: EVA's use in automotive components, such as impact absorbers, gaskets, and interior parts, is growing due to its flexibility, durability, and impact resistance. The shift towards lighter and safer vehicles supports this trend.
- Footwear and Sporting Goods: EVA's excellent cushioning properties make it a preferred material for midsoles in athletic shoes and protective gear.
- Key Drivers for EVA Dominance:
Dominant End-user Industry: The Building and Construction sector consistently represents the largest end-user industry for vinyl acetate derivatives, particularly Polyvinyl Acetate (PVA).
- Key Drivers for Building and Construction Dominance:
- Adhesives and Sealants: PVA is a primary ingredient in a vast array of adhesives and sealants used in woodworking, paper bonding, and general construction applications.
- Paints and Coatings: PVA-based emulsions are widely used in interior and exterior paints, offering excellent film formation, adhesion, and durability. The global construction market's steady growth, especially in emerging economies, directly translates to increased demand for these products.
- Infrastructure Development: Government investments in infrastructure projects worldwide, including residential and commercial buildings, roads, and bridges, significantly boost the consumption of construction materials that incorporate vinyl acetate derivatives.
- Key Drivers for Building and Construction Dominance:
Leading Region: Asia-Pacific is the leading region in the Vinyl Acetate Industry, driven by rapid industrialization, expanding manufacturing capabilities, and significant demand from key end-user industries.
- Detailed Dominance Analysis: China, in particular, plays a pivotal role due to its extensive chemical manufacturing infrastructure and its position as a global hub for electronics, textiles, and construction. The region's burgeoning renewable energy sector, with substantial solar panel production and installation, further solidifies its dominance in EVA applications. Economic growth, coupled with increasing disposable incomes, fuels demand for consumer goods, packaging, and construction materials, all of which are significant consumers of vinyl acetate products.
Vinyl Acetate Industry Product Developments
Recent product developments in the Vinyl Acetate Industry focus on enhancing performance, sustainability, and application diversity. Innovations include the development of low-VOC PVA emulsions for eco-friendly paints and coatings, high-performance EVA grades for advanced solar panel encapsulation with improved weather resistance, and specialized PVOH grades for niche applications like biodegradable films and advanced textile treatments. These advancements offer competitive advantages by addressing evolving market needs for efficiency, safety, and environmental responsibility.
Report Scope & Segmentation Analysis
This report provides a comprehensive segmentation of the Vinyl Acetate Industry, encompassing key applications and end-user industries.
- Polyvinyl Acetate (PVA): This segment is critical for adhesives, paints, and coatings. Projections indicate a steady market size of approximately 25,000 Million USD by 2025, with moderate growth driven by the construction and packaging sectors. Competitive dynamics are characterized by price sensitivity and product quality.
- Polyvinyl Alcohol (PVOH): This segment, utilized in textiles, paper, and films, is expected to reach a market size of around 10,000 Million USD by 2025. Growth is driven by increasing demand for water-soluble and biodegradable materials.
- Ethylene Vinyl Acetate (EVA): As a high-growth segment, EVA is vital for solar encapsulation and automotive applications. Its market size is estimated at 20,000 Million USD by 2025, with robust expansion fueled by renewable energy targets and automotive innovation.
- Other Applications: This segment includes various niche uses of vinyl acetate derivatives, contributing an estimated 5,000 Million USD to the market by 2025.
Key Drivers of Vinyl Acetate Industry Growth
The Vinyl Acetate Industry's growth is propelled by a confluence of technological, economic, and regulatory factors. The escalating global demand for renewable energy, particularly solar power, is a paramount driver, necessitating large-scale use of EVA for solar panel encapsulation. Concurrently, the robust expansion of the building and construction sector, fueled by urbanization and infrastructure development worldwide, significantly boosts the consumption of PVA in adhesives and coatings. Economic growth in emerging economies translates into increased demand for consumer goods, packaging, and automotive components, further supporting the market. Technological advancements in production processes, leading to greater efficiency and reduced environmental impact, also contribute to market expansion.
Challenges in the Vinyl Acetate Industry Sector
Despite its growth trajectory, the Vinyl Acetate Industry faces several challenges. Volatility in the prices of key raw materials, such as ethylene and acetic acid, can impact profitability and production costs. Stringent environmental regulations concerning emissions and chemical handling necessitate ongoing investments in compliance and sustainable practices. Supply chain disruptions, exacerbated by geopolitical events and logistics challenges, can affect product availability and lead times. Furthermore, intense price competition among major players can limit margins, especially in mature application segments.
Emerging Opportunities in Vinyl Acetate Industry
Emerging opportunities in the Vinyl Acetate Industry lie in the development of bio-based and sustainable VAM production methods, catering to the growing consumer and regulatory demand for eco-friendly materials. The expansion of electric vehicle (EV) production presents a significant opportunity for EVA in battery components and lightweight automotive parts. Furthermore, the increasing demand for advanced packaging solutions, including biodegradable and water-soluble films derived from PVOH, offers substantial market potential. Innovation in specialized VAM copolymers for high-performance applications in electronics and advanced materials also represents a promising avenue for growth.
Leading Players in the Vinyl Acetate Industry Market
- Nippon Chemical Industrial CO LTD
- Arkema
- DCC
- China Petrochemical Corporation
- Exxon Mobil Corporation
- INEOS
- Celanese Corporation
- Kemipex
- LyondellBasell Industries Holdings B V
- CLARIANT
- Sipchem Company
- Wacker Chemie AG
- Innospec
Key Developments in Vinyl Acetate Industry Industry
- February 2023: Celanese Corporation announced the completion of an ultra-low capital initiative to repurpose existing manufacturing and infrastructure assets to enable extra ethylene vinyl acetate (EVA) capacity at its Edmonton, Alberta site. The development will help the Acetyl Chain's downstream vinyl offering expand significantly.
- December 2022: Showa Denko K.K. announced to license its technology for producing vinyl acetate monomer (VAM) to Asian Paints Limited as part of a formal partnership deal between SDK and KBR, a global engineering and technology solutions company based in the United States. Furthermore, SDK will supply Asian Paints with catalysts for the company's VAM manufacturing.
Strategic Outlook for Vinyl Acetate Industry Market
The strategic outlook for the Vinyl Acetate Industry is highly positive, characterized by sustained growth driven by diversified applications and ongoing innovation. The industry's ability to adapt to evolving environmental regulations and embrace sustainable practices will be crucial for long-term success. Key growth catalysts include the continued expansion of the solar energy sector, the rising demand for advanced materials in the automotive industry, and the increasing adoption of eco-friendly adhesives and coatings in construction. Investments in capacity expansion, particularly in high-demand regions like Asia-Pacific, coupled with a focus on research and development for novel VAM-based products, will be essential for market players to capitalize on future opportunities and maintain a competitive edge.
Vinyl Acetate Industry Segmentation
-
1. Application
- 1.1. Polyvinyl Acetate
- 1.2. Polyvinyl Alcohol
- 1.3. Ethylene Vinyl Acetate (EVA)
- 1.4. Other Applications
-
2. End-user Industry
- 2.1. Solar
- 2.2. Automotive
- 2.3. Building and Construction
- 2.4. Packaging
- 2.5. Textile
- 2.6. Other End-user Industries
Vinyl Acetate Industry Segmentation By Geography
-
1. Asia Pacific
- 1.1. China
- 1.2. India
- 1.3. Japan
- 1.4. South Korea
- 1.5. Rest of Asia Pacific
-
2. North America
- 2.1. United States
- 2.2. Canada
- 2.3. Mexico
-
3. Europe
- 3.1. Germany
- 3.2. United Kingdom
- 3.3. Italy
- 3.4. Russia
- 3.5. France
- 3.6. Rest of Europe
-
4. South America
- 4.1. Brazil
- 4.2. Argentina
- 4.3. Rest of South America
-
5. Middle East and Africa
- 5.1. Saudi Arabia
- 5.2. South Africa
- 5.3. Rest of Middle East and Africa
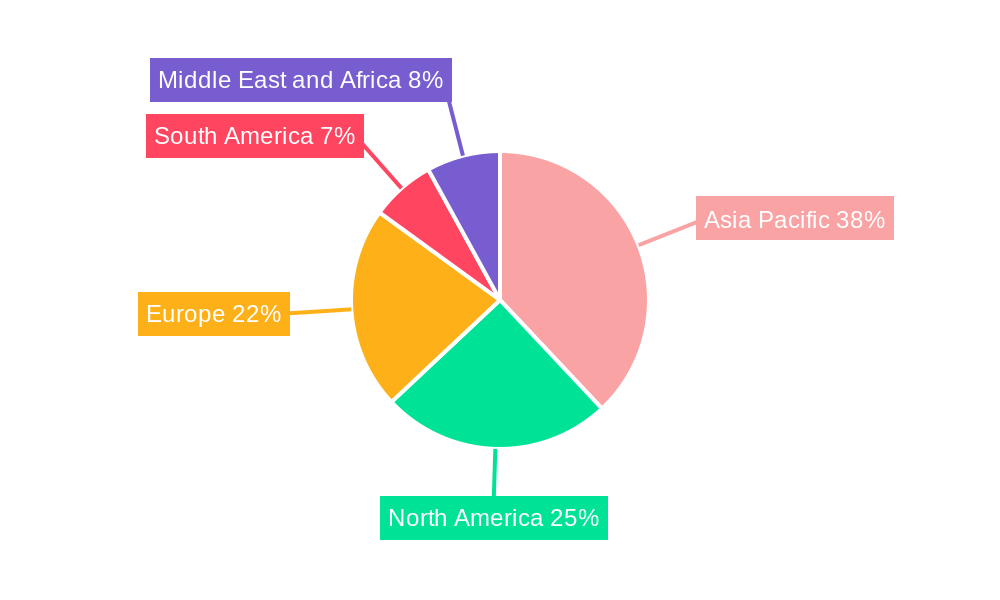
Vinyl Acetate Industry Regional Market Share
Geographic Coverage of Vinyl Acetate Industry
Vinyl Acetate Industry REPORT HIGHLIGHTS
| Aspects | Details |
|---|---|
| Study Period | 2020-2034 |
| Base Year | 2025 |
| Estimated Year | 2026 |
| Forecast Period | 2026-2034 |
| Historical Period | 2020-2025 |
| Growth Rate | CAGR of 5.47% from 2020-2034 |
| Segmentation |
|
Table of Contents
- 1. Introduction
- 1.1. Research Scope
- 1.2. Market Segmentation
- 1.3. Research Objective
- 1.4. Definitions and Assumptions
- 2. Executive Summary
- 2.1. Market Snapshot
- 3. Market Dynamics
- 3.1. Market Drivers
- 3.2. Market Restrains
- 3.3. Market Trends
- 3.4. Market Opportunities
- 4. Market Factor Analysis
- 4.1. Porters Five Forces
- 4.1.1. Bargaining Power of Suppliers
- 4.1.2. Bargaining Power of Buyers
- 4.1.3. Threat of New Entrants
- 4.1.4. Threat of Substitutes
- 4.1.5. Competitive Rivalry
- 4.2. PESTEL analysis
- 4.3. BCG Analysis
- 4.3.1. Stars (High Growth, High Market Share)
- 4.3.2. Cash Cows (Low Growth, High Market Share)
- 4.3.3. Question Mark (High Growth, Low Market Share)
- 4.3.4. Dogs (Low Growth, Low Market Share)
- 4.4. Ansoff Matrix Analysis
- 4.5. Supply Chain Analysis
- 4.6. Regulatory Landscape
- 4.7. Current Market Potential and Opportunity Assessment (TAM–SAM–SOM Framework)
- 4.8. RAX Analyst Note
- 4.1. Porters Five Forces
- 5. Market Analysis, Insights and Forecast 2021-2033
- 5.1. Market Analysis, Insights and Forecast - by Application
- 5.1.1. Polyvinyl Acetate
- 5.1.2. Polyvinyl Alcohol
- 5.1.3. Ethylene Vinyl Acetate (EVA)
- 5.1.4. Other Applications
- 5.2. Market Analysis, Insights and Forecast - by End-user Industry
- 5.2.1. Solar
- 5.2.2. Automotive
- 5.2.3. Building and Construction
- 5.2.4. Packaging
- 5.2.5. Textile
- 5.2.6. Other End-user Industries
- 5.3. Market Analysis, Insights and Forecast - by Region
- 5.3.1. Asia Pacific
- 5.3.2. North America
- 5.3.3. Europe
- 5.3.4. South America
- 5.3.5. Middle East and Africa
- 5.1. Market Analysis, Insights and Forecast - by Application
- 6. Global Vinyl Acetate Industry Analysis, Insights and Forecast, 2021-2033
- 6.1. Market Analysis, Insights and Forecast - by Application
- 6.1.1. Polyvinyl Acetate
- 6.1.2. Polyvinyl Alcohol
- 6.1.3. Ethylene Vinyl Acetate (EVA)
- 6.1.4. Other Applications
- 6.2. Market Analysis, Insights and Forecast - by End-user Industry
- 6.2.1. Solar
- 6.2.2. Automotive
- 6.2.3. Building and Construction
- 6.2.4. Packaging
- 6.2.5. Textile
- 6.2.6. Other End-user Industries
- 6.1. Market Analysis, Insights and Forecast - by Application
- 7. Asia Pacific Vinyl Acetate Industry Analysis, Insights and Forecast, 2020-2032
- 7.1. Market Analysis, Insights and Forecast - by Application
- 7.1.1. Polyvinyl Acetate
- 7.1.2. Polyvinyl Alcohol
- 7.1.3. Ethylene Vinyl Acetate (EVA)
- 7.1.4. Other Applications
- 7.2. Market Analysis, Insights and Forecast - by End-user Industry
- 7.2.1. Solar
- 7.2.2. Automotive
- 7.2.3. Building and Construction
- 7.2.4. Packaging
- 7.2.5. Textile
- 7.2.6. Other End-user Industries
- 7.1. Market Analysis, Insights and Forecast - by Application
- 8. North America Vinyl Acetate Industry Analysis, Insights and Forecast, 2020-2032
- 8.1. Market Analysis, Insights and Forecast - by Application
- 8.1.1. Polyvinyl Acetate
- 8.1.2. Polyvinyl Alcohol
- 8.1.3. Ethylene Vinyl Acetate (EVA)
- 8.1.4. Other Applications
- 8.2. Market Analysis, Insights and Forecast - by End-user Industry
- 8.2.1. Solar
- 8.2.2. Automotive
- 8.2.3. Building and Construction
- 8.2.4. Packaging
- 8.2.5. Textile
- 8.2.6. Other End-user Industries
- 8.1. Market Analysis, Insights and Forecast - by Application
- 9. Europe Vinyl Acetate Industry Analysis, Insights and Forecast, 2020-2032
- 9.1. Market Analysis, Insights and Forecast - by Application
- 9.1.1. Polyvinyl Acetate
- 9.1.2. Polyvinyl Alcohol
- 9.1.3. Ethylene Vinyl Acetate (EVA)
- 9.1.4. Other Applications
- 9.2. Market Analysis, Insights and Forecast - by End-user Industry
- 9.2.1. Solar
- 9.2.2. Automotive
- 9.2.3. Building and Construction
- 9.2.4. Packaging
- 9.2.5. Textile
- 9.2.6. Other End-user Industries
- 9.1. Market Analysis, Insights and Forecast - by Application
- 10. South America Vinyl Acetate Industry Analysis, Insights and Forecast, 2020-2032
- 10.1. Market Analysis, Insights and Forecast - by Application
- 10.1.1. Polyvinyl Acetate
- 10.1.2. Polyvinyl Alcohol
- 10.1.3. Ethylene Vinyl Acetate (EVA)
- 10.1.4. Other Applications
- 10.2. Market Analysis, Insights and Forecast - by End-user Industry
- 10.2.1. Solar
- 10.2.2. Automotive
- 10.2.3. Building and Construction
- 10.2.4. Packaging
- 10.2.5. Textile
- 10.2.6. Other End-user Industries
- 10.1. Market Analysis, Insights and Forecast - by Application
- 11. Middle East and Africa Vinyl Acetate Industry Analysis, Insights and Forecast, 2020-2032
- 11.1. Market Analysis, Insights and Forecast - by Application
- 11.1.1. Polyvinyl Acetate
- 11.1.2. Polyvinyl Alcohol
- 11.1.3. Ethylene Vinyl Acetate (EVA)
- 11.1.4. Other Applications
- 11.2. Market Analysis, Insights and Forecast - by End-user Industry
- 11.2.1. Solar
- 11.2.2. Automotive
- 11.2.3. Building and Construction
- 11.2.4. Packaging
- 11.2.5. Textile
- 11.2.6. Other End-user Industries
- 11.1. Market Analysis, Insights and Forecast - by Application
- 12. Competitive Analysis
- 12.1. Company Profiles
- 12.1.1 Nippon Chemical Industrial CO LTD
- 12.1.1.1. Company Overview
- 12.1.1.2. Products
- 12.1.1.3. Company Financials
- 12.1.1.4. SWOT Analysis
- 12.1.2 Arkema
- 12.1.2.1. Company Overview
- 12.1.2.2. Products
- 12.1.2.3. Company Financials
- 12.1.2.4. SWOT Analysis
- 12.1.3 DCC
- 12.1.3.1. Company Overview
- 12.1.3.2. Products
- 12.1.3.3. Company Financials
- 12.1.3.4. SWOT Analysis
- 12.1.4 China Petrochemical Corporation
- 12.1.4.1. Company Overview
- 12.1.4.2. Products
- 12.1.4.3. Company Financials
- 12.1.4.4. SWOT Analysis
- 12.1.5 Exxon Mobil Corporation
- 12.1.5.1. Company Overview
- 12.1.5.2. Products
- 12.1.5.3. Company Financials
- 12.1.5.4. SWOT Analysis
- 12.1.6 INEOS
- 12.1.6.1. Company Overview
- 12.1.6.2. Products
- 12.1.6.3. Company Financials
- 12.1.6.4. SWOT Analysis
- 12.1.7 Celanese Corporation
- 12.1.7.1. Company Overview
- 12.1.7.2. Products
- 12.1.7.3. Company Financials
- 12.1.7.4. SWOT Analysis
- 12.1.8 Kemipex
- 12.1.8.1. Company Overview
- 12.1.8.2. Products
- 12.1.8.3. Company Financials
- 12.1.8.4. SWOT Analysis
- 12.1.9 LyondellBasell Industries Holdings B V
- 12.1.9.1. Company Overview
- 12.1.9.2. Products
- 12.1.9.3. Company Financials
- 12.1.9.4. SWOT Analysis
- 12.1.10 CLARIANT
- 12.1.10.1. Company Overview
- 12.1.10.2. Products
- 12.1.10.3. Company Financials
- 12.1.10.4. SWOT Analysis
- 12.1.11 Sipchem Company
- 12.1.11.1. Company Overview
- 12.1.11.2. Products
- 12.1.11.3. Company Financials
- 12.1.11.4. SWOT Analysis
- 12.1.12 Wacker Chemie AG
- 12.1.12.1. Company Overview
- 12.1.12.2. Products
- 12.1.12.3. Company Financials
- 12.1.12.4. SWOT Analysis
- 12.1.13 Innospec
- 12.1.13.1. Company Overview
- 12.1.13.2. Products
- 12.1.13.3. Company Financials
- 12.1.13.4. SWOT Analysis
- 12.1.1 Nippon Chemical Industrial CO LTD
- 12.2. Market Entropy
- 12.2.1 Company's Key Areas Served
- 12.2.2 Recent Developments
- 12.3. Company Market Share Analysis 2025
- 12.3.1 Top 5 Companies Market Share Analysis
- 12.3.2 Top 3 Companies Market Share Analysis
- 12.4. List of Potential Customers
- 13. Research Methodology
List of Figures
- Figure 1: Global Vinyl Acetate Industry Revenue Breakdown (billion, %) by Region 2025 & 2033
- Figure 2: Global Vinyl Acetate Industry Volume Breakdown (K Tons, %) by Region 2025 & 2033
- Figure 3: Asia Pacific Vinyl Acetate Industry Revenue (billion), by Application 2025 & 2033
- Figure 4: Asia Pacific Vinyl Acetate Industry Volume (K Tons), by Application 2025 & 2033
- Figure 5: Asia Pacific Vinyl Acetate Industry Revenue Share (%), by Application 2025 & 2033
- Figure 6: Asia Pacific Vinyl Acetate Industry Volume Share (%), by Application 2025 & 2033
- Figure 7: Asia Pacific Vinyl Acetate Industry Revenue (billion), by End-user Industry 2025 & 2033
- Figure 8: Asia Pacific Vinyl Acetate Industry Volume (K Tons), by End-user Industry 2025 & 2033
- Figure 9: Asia Pacific Vinyl Acetate Industry Revenue Share (%), by End-user Industry 2025 & 2033
- Figure 10: Asia Pacific Vinyl Acetate Industry Volume Share (%), by End-user Industry 2025 & 2033
- Figure 11: Asia Pacific Vinyl Acetate Industry Revenue (billion), by Country 2025 & 2033
- Figure 12: Asia Pacific Vinyl Acetate Industry Volume (K Tons), by Country 2025 & 2033
- Figure 13: Asia Pacific Vinyl Acetate Industry Revenue Share (%), by Country 2025 & 2033
- Figure 14: Asia Pacific Vinyl Acetate Industry Volume Share (%), by Country 2025 & 2033
- Figure 15: North America Vinyl Acetate Industry Revenue (billion), by Application 2025 & 2033
- Figure 16: North America Vinyl Acetate Industry Volume (K Tons), by Application 2025 & 2033
- Figure 17: North America Vinyl Acetate Industry Revenue Share (%), by Application 2025 & 2033
- Figure 18: North America Vinyl Acetate Industry Volume Share (%), by Application 2025 & 2033
- Figure 19: North America Vinyl Acetate Industry Revenue (billion), by End-user Industry 2025 & 2033
- Figure 20: North America Vinyl Acetate Industry Volume (K Tons), by End-user Industry 2025 & 2033
- Figure 21: North America Vinyl Acetate Industry Revenue Share (%), by End-user Industry 2025 & 2033
- Figure 22: North America Vinyl Acetate Industry Volume Share (%), by End-user Industry 2025 & 2033
- Figure 23: North America Vinyl Acetate Industry Revenue (billion), by Country 2025 & 2033
- Figure 24: North America Vinyl Acetate Industry Volume (K Tons), by Country 2025 & 2033
- Figure 25: North America Vinyl Acetate Industry Revenue Share (%), by Country 2025 & 2033
- Figure 26: North America Vinyl Acetate Industry Volume Share (%), by Country 2025 & 2033
- Figure 27: Europe Vinyl Acetate Industry Revenue (billion), by Application 2025 & 2033
- Figure 28: Europe Vinyl Acetate Industry Volume (K Tons), by Application 2025 & 2033
- Figure 29: Europe Vinyl Acetate Industry Revenue Share (%), by Application 2025 & 2033
- Figure 30: Europe Vinyl Acetate Industry Volume Share (%), by Application 2025 & 2033
- Figure 31: Europe Vinyl Acetate Industry Revenue (billion), by End-user Industry 2025 & 2033
- Figure 32: Europe Vinyl Acetate Industry Volume (K Tons), by End-user Industry 2025 & 2033
- Figure 33: Europe Vinyl Acetate Industry Revenue Share (%), by End-user Industry 2025 & 2033
- Figure 34: Europe Vinyl Acetate Industry Volume Share (%), by End-user Industry 2025 & 2033
- Figure 35: Europe Vinyl Acetate Industry Revenue (billion), by Country 2025 & 2033
- Figure 36: Europe Vinyl Acetate Industry Volume (K Tons), by Country 2025 & 2033
- Figure 37: Europe Vinyl Acetate Industry Revenue Share (%), by Country 2025 & 2033
- Figure 38: Europe Vinyl Acetate Industry Volume Share (%), by Country 2025 & 2033
- Figure 39: South America Vinyl Acetate Industry Revenue (billion), by Application 2025 & 2033
- Figure 40: South America Vinyl Acetate Industry Volume (K Tons), by Application 2025 & 2033
- Figure 41: South America Vinyl Acetate Industry Revenue Share (%), by Application 2025 & 2033
- Figure 42: South America Vinyl Acetate Industry Volume Share (%), by Application 2025 & 2033
- Figure 43: South America Vinyl Acetate Industry Revenue (billion), by End-user Industry 2025 & 2033
- Figure 44: South America Vinyl Acetate Industry Volume (K Tons), by End-user Industry 2025 & 2033
- Figure 45: South America Vinyl Acetate Industry Revenue Share (%), by End-user Industry 2025 & 2033
- Figure 46: South America Vinyl Acetate Industry Volume Share (%), by End-user Industry 2025 & 2033
- Figure 47: South America Vinyl Acetate Industry Revenue (billion), by Country 2025 & 2033
- Figure 48: South America Vinyl Acetate Industry Volume (K Tons), by Country 2025 & 2033
- Figure 49: South America Vinyl Acetate Industry Revenue Share (%), by Country 2025 & 2033
- Figure 50: South America Vinyl Acetate Industry Volume Share (%), by Country 2025 & 2033
- Figure 51: Middle East and Africa Vinyl Acetate Industry Revenue (billion), by Application 2025 & 2033
- Figure 52: Middle East and Africa Vinyl Acetate Industry Volume (K Tons), by Application 2025 & 2033
- Figure 53: Middle East and Africa Vinyl Acetate Industry Revenue Share (%), by Application 2025 & 2033
- Figure 54: Middle East and Africa Vinyl Acetate Industry Volume Share (%), by Application 2025 & 2033
- Figure 55: Middle East and Africa Vinyl Acetate Industry Revenue (billion), by End-user Industry 2025 & 2033
- Figure 56: Middle East and Africa Vinyl Acetate Industry Volume (K Tons), by End-user Industry 2025 & 2033
- Figure 57: Middle East and Africa Vinyl Acetate Industry Revenue Share (%), by End-user Industry 2025 & 2033
- Figure 58: Middle East and Africa Vinyl Acetate Industry Volume Share (%), by End-user Industry 2025 & 2033
- Figure 59: Middle East and Africa Vinyl Acetate Industry Revenue (billion), by Country 2025 & 2033
- Figure 60: Middle East and Africa Vinyl Acetate Industry Volume (K Tons), by Country 2025 & 2033
- Figure 61: Middle East and Africa Vinyl Acetate Industry Revenue Share (%), by Country 2025 & 2033
- Figure 62: Middle East and Africa Vinyl Acetate Industry Volume Share (%), by Country 2025 & 2033
List of Tables
- Table 1: Global Vinyl Acetate Industry Revenue billion Forecast, by Application 2020 & 2033
- Table 2: Global Vinyl Acetate Industry Volume K Tons Forecast, by Application 2020 & 2033
- Table 3: Global Vinyl Acetate Industry Revenue billion Forecast, by End-user Industry 2020 & 2033
- Table 4: Global Vinyl Acetate Industry Volume K Tons Forecast, by End-user Industry 2020 & 2033
- Table 5: Global Vinyl Acetate Industry Revenue billion Forecast, by Region 2020 & 2033
- Table 6: Global Vinyl Acetate Industry Volume K Tons Forecast, by Region 2020 & 2033
- Table 7: Global Vinyl Acetate Industry Revenue billion Forecast, by Application 2020 & 2033
- Table 8: Global Vinyl Acetate Industry Volume K Tons Forecast, by Application 2020 & 2033
- Table 9: Global Vinyl Acetate Industry Revenue billion Forecast, by End-user Industry 2020 & 2033
- Table 10: Global Vinyl Acetate Industry Volume K Tons Forecast, by End-user Industry 2020 & 2033
- Table 11: Global Vinyl Acetate Industry Revenue billion Forecast, by Country 2020 & 2033
- Table 12: Global Vinyl Acetate Industry Volume K Tons Forecast, by Country 2020 & 2033
- Table 13: China Vinyl Acetate Industry Revenue (billion) Forecast, by Application 2020 & 2033
- Table 14: China Vinyl Acetate Industry Volume (K Tons) Forecast, by Application 2020 & 2033
- Table 15: India Vinyl Acetate Industry Revenue (billion) Forecast, by Application 2020 & 2033
- Table 16: India Vinyl Acetate Industry Volume (K Tons) Forecast, by Application 2020 & 2033
- Table 17: Japan Vinyl Acetate Industry Revenue (billion) Forecast, by Application 2020 & 2033
- Table 18: Japan Vinyl Acetate Industry Volume (K Tons) Forecast, by Application 2020 & 2033
- Table 19: South Korea Vinyl Acetate Industry Revenue (billion) Forecast, by Application 2020 & 2033
- Table 20: South Korea Vinyl Acetate Industry Volume (K Tons) Forecast, by Application 2020 & 2033
- Table 21: Rest of Asia Pacific Vinyl Acetate Industry Revenue (billion) Forecast, by Application 2020 & 2033
- Table 22: Rest of Asia Pacific Vinyl Acetate Industry Volume (K Tons) Forecast, by Application 2020 & 2033
- Table 23: Global Vinyl Acetate Industry Revenue billion Forecast, by Application 2020 & 2033
- Table 24: Global Vinyl Acetate Industry Volume K Tons Forecast, by Application 2020 & 2033
- Table 25: Global Vinyl Acetate Industry Revenue billion Forecast, by End-user Industry 2020 & 2033
- Table 26: Global Vinyl Acetate Industry Volume K Tons Forecast, by End-user Industry 2020 & 2033
- Table 27: Global Vinyl Acetate Industry Revenue billion Forecast, by Country 2020 & 2033
- Table 28: Global Vinyl Acetate Industry Volume K Tons Forecast, by Country 2020 & 2033
- Table 29: United States Vinyl Acetate Industry Revenue (billion) Forecast, by Application 2020 & 2033
- Table 30: United States Vinyl Acetate Industry Volume (K Tons) Forecast, by Application 2020 & 2033
- Table 31: Canada Vinyl Acetate Industry Revenue (billion) Forecast, by Application 2020 & 2033
- Table 32: Canada Vinyl Acetate Industry Volume (K Tons) Forecast, by Application 2020 & 2033
- Table 33: Mexico Vinyl Acetate Industry Revenue (billion) Forecast, by Application 2020 & 2033
- Table 34: Mexico Vinyl Acetate Industry Volume (K Tons) Forecast, by Application 2020 & 2033
- Table 35: Global Vinyl Acetate Industry Revenue billion Forecast, by Application 2020 & 2033
- Table 36: Global Vinyl Acetate Industry Volume K Tons Forecast, by Application 2020 & 2033
- Table 37: Global Vinyl Acetate Industry Revenue billion Forecast, by End-user Industry 2020 & 2033
- Table 38: Global Vinyl Acetate Industry Volume K Tons Forecast, by End-user Industry 2020 & 2033
- Table 39: Global Vinyl Acetate Industry Revenue billion Forecast, by Country 2020 & 2033
- Table 40: Global Vinyl Acetate Industry Volume K Tons Forecast, by Country 2020 & 2033
- Table 41: Germany Vinyl Acetate Industry Revenue (billion) Forecast, by Application 2020 & 2033
- Table 42: Germany Vinyl Acetate Industry Volume (K Tons) Forecast, by Application 2020 & 2033
- Table 43: United Kingdom Vinyl Acetate Industry Revenue (billion) Forecast, by Application 2020 & 2033
- Table 44: United Kingdom Vinyl Acetate Industry Volume (K Tons) Forecast, by Application 2020 & 2033
- Table 45: Italy Vinyl Acetate Industry Revenue (billion) Forecast, by Application 2020 & 2033
- Table 46: Italy Vinyl Acetate Industry Volume (K Tons) Forecast, by Application 2020 & 2033
- Table 47: Russia Vinyl Acetate Industry Revenue (billion) Forecast, by Application 2020 & 2033
- Table 48: Russia Vinyl Acetate Industry Volume (K Tons) Forecast, by Application 2020 & 2033
- Table 49: France Vinyl Acetate Industry Revenue (billion) Forecast, by Application 2020 & 2033
- Table 50: France Vinyl Acetate Industry Volume (K Tons) Forecast, by Application 2020 & 2033
- Table 51: Rest of Europe Vinyl Acetate Industry Revenue (billion) Forecast, by Application 2020 & 2033
- Table 52: Rest of Europe Vinyl Acetate Industry Volume (K Tons) Forecast, by Application 2020 & 2033
- Table 53: Global Vinyl Acetate Industry Revenue billion Forecast, by Application 2020 & 2033
- Table 54: Global Vinyl Acetate Industry Volume K Tons Forecast, by Application 2020 & 2033
- Table 55: Global Vinyl Acetate Industry Revenue billion Forecast, by End-user Industry 2020 & 2033
- Table 56: Global Vinyl Acetate Industry Volume K Tons Forecast, by End-user Industry 2020 & 2033
- Table 57: Global Vinyl Acetate Industry Revenue billion Forecast, by Country 2020 & 2033
- Table 58: Global Vinyl Acetate Industry Volume K Tons Forecast, by Country 2020 & 2033
- Table 59: Brazil Vinyl Acetate Industry Revenue (billion) Forecast, by Application 2020 & 2033
- Table 60: Brazil Vinyl Acetate Industry Volume (K Tons) Forecast, by Application 2020 & 2033
- Table 61: Argentina Vinyl Acetate Industry Revenue (billion) Forecast, by Application 2020 & 2033
- Table 62: Argentina Vinyl Acetate Industry Volume (K Tons) Forecast, by Application 2020 & 2033
- Table 63: Rest of South America Vinyl Acetate Industry Revenue (billion) Forecast, by Application 2020 & 2033
- Table 64: Rest of South America Vinyl Acetate Industry Volume (K Tons) Forecast, by Application 2020 & 2033
- Table 65: Global Vinyl Acetate Industry Revenue billion Forecast, by Application 2020 & 2033
- Table 66: Global Vinyl Acetate Industry Volume K Tons Forecast, by Application 2020 & 2033
- Table 67: Global Vinyl Acetate Industry Revenue billion Forecast, by End-user Industry 2020 & 2033
- Table 68: Global Vinyl Acetate Industry Volume K Tons Forecast, by End-user Industry 2020 & 2033
- Table 69: Global Vinyl Acetate Industry Revenue billion Forecast, by Country 2020 & 2033
- Table 70: Global Vinyl Acetate Industry Volume K Tons Forecast, by Country 2020 & 2033
- Table 71: Saudi Arabia Vinyl Acetate Industry Revenue (billion) Forecast, by Application 2020 & 2033
- Table 72: Saudi Arabia Vinyl Acetate Industry Volume (K Tons) Forecast, by Application 2020 & 2033
- Table 73: South Africa Vinyl Acetate Industry Revenue (billion) Forecast, by Application 2020 & 2033
- Table 74: South Africa Vinyl Acetate Industry Volume (K Tons) Forecast, by Application 2020 & 2033
- Table 75: Rest of Middle East and Africa Vinyl Acetate Industry Revenue (billion) Forecast, by Application 2020 & 2033
- Table 76: Rest of Middle East and Africa Vinyl Acetate Industry Volume (K Tons) Forecast, by Application 2020 & 2033
Frequently Asked Questions
1. What is the projected Compound Annual Growth Rate (CAGR) of the Vinyl Acetate Industry?
The projected CAGR is approximately 5.47%.
2. Which companies are prominent players in the Vinyl Acetate Industry?
Key companies in the market include Nippon Chemical Industrial CO LTD, Arkema, DCC, China Petrochemical Corporation, Exxon Mobil Corporation, INEOS, Celanese Corporation, Kemipex, LyondellBasell Industries Holdings B V, CLARIANT, Sipchem Company, Wacker Chemie AG, Innospec.
3. What are the main segments of the Vinyl Acetate Industry?
The market segments include Application, End-user Industry.
4. Can you provide details about the market size?
The market size is estimated to be USD 1.97 billion as of 2022.
5. What are some drivers contributing to market growth?
Increased Use of Adhesives in Food Packaging; Increasing Use in the Solar Power Generation Industry.
6. What are the notable trends driving market growth?
Increasing Demand from the Solar Industry.
7. Are there any restraints impacting market growth?
Stringent Health and Environmental Regulations; Other Restraints.
8. Can you provide examples of recent developments in the market?
February 2023: Celanese Corporation announced the completion of an ultra-low capital initiative to repurpose existing manufacturing and infrastructure assets to enable extra ethylene vinyl acetate (EVA) capacity at its Edmonton, Alberta site. The development will help the Acetyl Chain's downstream vinyl offering expand significantly.
9. What pricing options are available for accessing the report?
Pricing options include single-user, multi-user, and enterprise licenses priced at USD 4750, USD 5250, and USD 8750 respectively.
10. Is the market size provided in terms of value or volume?
The market size is provided in terms of value, measured in billion and volume, measured in K Tons.
11. Are there any specific market keywords associated with the report?
Yes, the market keyword associated with the report is "Vinyl Acetate Industry," which aids in identifying and referencing the specific market segment covered.
12. How do I determine which pricing option suits my needs best?
The pricing options vary based on user requirements and access needs. Individual users may opt for single-user licenses, while businesses requiring broader access may choose multi-user or enterprise licenses for cost-effective access to the report.
13. Are there any additional resources or data provided in the Vinyl Acetate Industry report?
While the report offers comprehensive insights, it's advisable to review the specific contents or supplementary materials provided to ascertain if additional resources or data are available.
14. How can I stay updated on further developments or reports in the Vinyl Acetate Industry?
To stay informed about further developments, trends, and reports in the Vinyl Acetate Industry, consider subscribing to industry newsletters, following relevant companies and organizations, or regularly checking reputable industry news sources and publications.
Methodology
Step 1 - Identification of Relevant Samples Size from Population Database


Step 2 - Approaches for Defining Global Market Size (Value, Volume* & Price*)

Note*: In applicable scenarios
Step 3 - Data Sources
Primary Research
- Web Analytics
- Survey Reports
- Research Institute
- Latest Research Reports
- Opinion Leaders
Secondary Research
- Annual Reports
- White Paper
- Latest Press Release
- Industry Association
- Paid Database
- Investor Presentations

Step 4 - Data Triangulation
Involves using different sources of information in order to increase the validity of a study
These sources are likely to be stakeholders in a program - participants, other researchers, program staff, other community members, and so on.
Then we put all data in single framework & apply various statistical tools to find out the dynamic on the market.
During the analysis stage, feedback from the stakeholder groups would be compared to determine areas of agreement as well as areas of divergence

