Virtual Cards Industry Industry Overview and Projections

Virtual Cards Industry by Product Type (B2B Virtual Cards, B2C Remote Payment Virtual Cards, B2C POS Virtual Cards), by End User (Consumer Use, Business Use), by North America (United States, Canada, Rest of North America), by South America (Brazil, Peru, Rest of South America), by Europe (United Kingdom, Germany, Rest of Europe), by Asia Pacific (India, Japan, Rest of Asia Pacific), by Middle East, by Saudi Arabia (United Arab Emirates, Rest of Middle East) Forecast 2025-2033

Jul 17 2025
Base Year: 2024

197 Pages
Main Logo

Virtual Cards Industry Industry Overview and Projections


Home
Industries
Financial Services and Investment Intelligence
sponsor image
sponsor image
sponsor image
sponsor image
sponsor image
sponsor image
sponsor image
sponsor image
sponsor image
sponsor image
sponsor image
sponsor image
sponsor image
sponsor image

Tailored for you

  • In-depth Analysis Tailored to Specified Regions or Segments
  • Company Profiles Customized to User Preferences
  • Comprehensive Insights Focused on Specific Segments or Regions
  • Customized Evaluation of Competitive Landscape to Meet Your Needs
  • Tailored Customization to Address Other Specific Requirements
Ask for customization


Key Insights

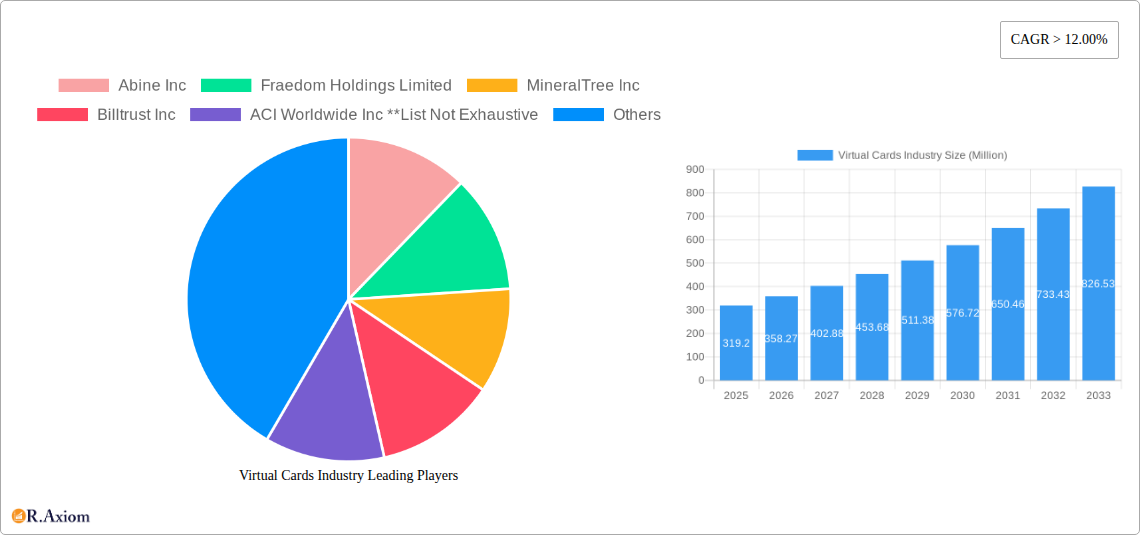
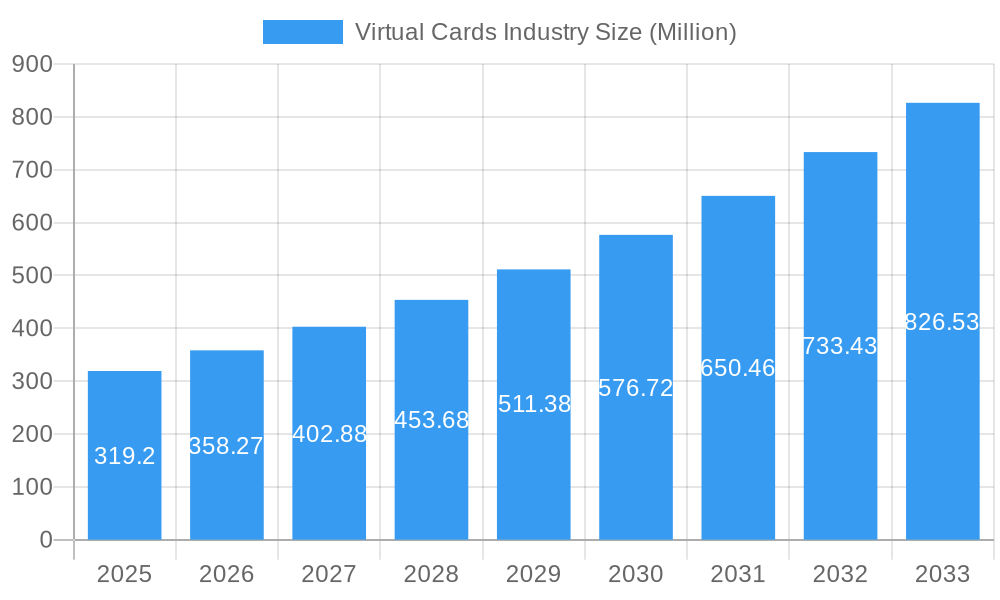
The global virtual cards market is experiencing robust growth, projected to reach $319.20 million in 2025 and maintain a Compound Annual Growth Rate (CAGR) exceeding 12% from 2025 to 2033. This expansion is fueled by several key factors. The increasing adoption of digital payment methods across both B2B and B2C segments is a significant driver. Businesses are leveraging B2B virtual cards for streamlined expense management and enhanced security, reducing reliance on traditional methods. Simultaneously, consumers are embracing the convenience and security offered by B2C virtual cards for online and in-person (POS) transactions. Furthermore, advancements in technology, such as improved fraud prevention mechanisms and enhanced integration with existing financial systems, are bolstering market growth. The rising prevalence of e-commerce and the growing need for secure online payment solutions are additional contributing factors. Geographic expansion, particularly in developing economies with increasing internet and smartphone penetration, presents significant untapped potential. Leading players like American Express, Mastercard, and JPMorgan Chase, alongside fintech innovators like Abine and Fraedom, are driving innovation and expanding market reach through strategic partnerships and product diversification.

The market segmentation reveals strong growth across various product types. B2B virtual cards are experiencing significant traction due to their efficiency in managing corporate spending, while the B2C segment, encompassing both online and POS virtual cards, is benefiting from heightened consumer preference for contactless and secure payment solutions. The business use segment is currently outpacing consumer use, driven by corporate adoption, but strong consumer growth is expected to narrow this gap in the coming years. Regionally, North America and Europe are currently leading the market, but the Asia-Pacific region is poised for substantial growth due to the rapid digitalization of its economies. The sustained CAGR signifies a positive outlook, indicating continued market expansion across all segments and geographic regions. However, regulatory challenges and security concerns remain potential headwinds.

This comprehensive report provides an in-depth analysis of the global virtual cards industry, covering market size, growth drivers, key players, and future trends from 2019 to 2033. The study period encompasses historical data (2019-2024), the base year (2025), and a forecast period (2025-2033). The report offers actionable insights for industry stakeholders, investors, and businesses seeking to navigate this rapidly evolving landscape. The total market value in 2025 is estimated at $xx Million.

Virtual Cards Industry Research Report - Market Size, Growth & Forecast

Virtual Cards Industry Market Concentration & Innovation

This section analyzes the competitive landscape of the virtual cards industry, examining market concentration, innovation drivers, regulatory frameworks, substitute products, end-user trends, and mergers & acquisitions (M&A) activities.

The industry exhibits a moderately concentrated structure, with key players like Mastercard Incorporated, American Express Company, and JPMorgan Chase & Co holding significant market share. However, the emergence of fintech companies and the increasing adoption of virtual cards are fostering a more competitive environment. The market share of the top 5 players in 2025 is estimated at xx%.

  • Innovation Drivers: Technological advancements such as mobile payment technologies, improved security protocols, and the increasing integration of virtual cards with other financial services are major innovation drivers.
  • Regulatory Frameworks: Government regulations concerning data privacy, security, and fraud prevention significantly influence the industry. Compliance costs and evolving regulations present challenges and opportunities for innovation.
  • Product Substitutes: Traditional physical cards and other digital payment methods, such as mobile wallets, are primary substitutes for virtual cards. However, the convenience and security features of virtual cards provide a competitive advantage.
  • End-User Trends: The increasing adoption of e-commerce and the preference for contactless payments are driving the growth of virtual card usage among both consumers and businesses.
  • M&A Activities: The virtual card industry has witnessed significant M&A activity in recent years, with deal values totaling $xx Million in 2024. These acquisitions aim to expand market reach, enhance technological capabilities, and improve service offerings. Examples include the partnership between Mastercard and OPay (May 2022).

Virtual Cards Industry Industry Trends & Insights

This section delves into the key trends and insights shaping the virtual cards industry, focusing on market growth, technological disruptions, consumer preferences, and competitive dynamics.

The global virtual cards market is experiencing robust growth, fueled by the rising adoption of digital payments, the expansion of e-commerce, and the increasing demand for secure and convenient payment solutions. The Compound Annual Growth Rate (CAGR) is projected to be xx% during the forecast period (2025-2033). Market penetration is expected to reach xx% by 2033. Key growth drivers include the increasing use of virtual cards in B2B transactions, the growing popularity of mobile payments, and the expansion of virtual cards into new markets and industries. Technological disruptions, such as the integration of blockchain technology and AI-powered fraud detection systems, are further transforming the industry. Consumer preferences are shifting towards secure, convenient, and flexible payment options, which are driving the demand for virtual cards. The competitive landscape is characterized by intense rivalry among established players and the emergence of new entrants.

Virtual Cards Industry Growth

Dominant Markets & Segments in Virtual Cards Industry

This section identifies the leading regions, countries, and segments within the virtual cards market.

  • Leading Region/Country: North America is projected to be the dominant region, owing to high internet and smartphone penetration, advanced technological infrastructure, and a strong e-commerce ecosystem.
  • Product Type:
    • B2B Virtual Cards: This segment is expected to dominate due to the increasing need for efficient and secure payment solutions in B2B transactions. The growth is driven by automation, enhanced security, and improved reconciliation processes.
    • B2C Remote Payment Virtual Cards: The growth of e-commerce and online shopping is fueling this segment's expansion. Convenience and security are major drivers.
    • B2C POS Virtual Cards: This segment is growing rapidly due to the increasing adoption of contactless payments and mobile wallets.
  • End User:
    • Business Use: This segment is expected to register substantial growth due to the benefits of virtual cards in managing corporate expenses, enhancing security, and streamlining payment processes.
    • Consumer Use: Consumer adoption is driven by ease of use, enhanced security, and the integration with mobile wallets and online platforms.

Key Drivers: Economic policies promoting digitalization, robust digital infrastructure (high internet and smartphone penetration), and government initiatives supporting cashless transactions are key drivers in North America.

Virtual Cards Industry Product Developments

Recent product innovations focus on enhanced security features, improved user interfaces, and greater integration with other financial services. The development of virtual cards with advanced fraud detection capabilities and biometric authentication is improving security and minimizing risk. Furthermore, the integration of virtual cards with loyalty programs and reward systems is enhancing customer engagement. This continuous innovation makes virtual cards a more attractive and efficient payment option, fostering market growth and competition.

Report Scope & Segmentation Analysis

This report segments the virtual cards market based on product type (B2B Virtual Cards, B2C Remote Payment Virtual Cards, B2C POS Virtual Cards) and end-user (Consumer Use, Business Use). Each segment's growth projections, market size, and competitive dynamics are analyzed. For instance, the B2B segment is expected to witness significant growth due to the increasing demand for efficient payment solutions in business transactions. The consumer segment is driven by the rising popularity of online shopping and contactless payments.

Key Drivers of Virtual Cards Industry Growth

The growth of the virtual cards industry is propelled by several factors. Technological advancements, such as improved security features and integration with mobile wallets, significantly enhance the user experience. The economic shift towards digital payments and the expansion of e-commerce create a strong demand for virtual cards. Finally, supportive regulatory frameworks and government initiatives promoting digital financial inclusion are vital catalysts for market expansion.

Challenges in the Virtual Cards Industry Sector

The industry faces challenges, including stringent regulatory compliance requirements impacting operational costs. Supply chain disruptions affecting card issuance and processing can also impact market growth. Furthermore, intense competition among established players and new entrants necessitates constant innovation and differentiation to maintain market share. These factors can collectively constrain the market growth by an estimated xx% in 2026.

Emerging Opportunities in Virtual Cards Industry

Emerging opportunities lie in expanding into new geographic markets with growing digital economies, developing specialized virtual cards for niche industries, and integrating virtual cards with emerging technologies like blockchain and AI for enhanced security and efficiency. The increasing demand for contactless payments and the growing popularity of mobile wallets present significant growth prospects.

Leading Players in the Virtual Cards Industry Market

  • Abine Inc
  • Fraedom Holdings Limited
  • MineralTree Inc
  • Billtrust Inc
  • ACI Worldwide Inc
  • American Express Company
  • Mastercard Incorporated
  • JPMorgan Chase & Co
  • Alipay com Co Ltd
  • Skrill USA Inc

Key Developments in Virtual Cards Industry Industry

  • December 2023: Conferma Pay and Mastercard expanded their partnership, enabling mobile virtual card payments for corporate customers of Mastercard's commercial bank clients. This significantly enhances the convenience and reach of virtual card payments.
  • May 2022: Mastercard and OPay partnered to expand digital commerce access across the Middle East and Africa, boosting financial inclusion.

Strategic Outlook for Virtual Cards Industry Market

The future of the virtual cards industry looks bright, with continued growth driven by technological advancements, expanding e-commerce, and increasing consumer adoption of digital payments. The strategic focus should be on enhancing security, improving user experience, and expanding into new markets and applications. The integration of virtual cards with emerging technologies and the development of tailored solutions for specific industries will be crucial for success in this dynamic market.

Virtual Cards Industry Segmentation

  • 1. Product Type
    • 1.1. B2B Virtual Cards
    • 1.2. B2C Remote Payment Virtual Cards
    • 1.3. B2C POS Virtual Cards
  • 2. End User
    • 2.1. Consumer Use
    • 2.2. Business Use

Virtual Cards Industry Segmentation By Geography

  • 1. North America
    • 1.1. United States
    • 1.2. Canada
    • 1.3. Rest of North America
  • 2. South America
    • 2.1. Brazil
    • 2.2. Peru
    • 2.3. Rest of South America
  • 3. Europe
    • 3.1. United Kingdom
    • 3.2. Germany
    • 3.3. Rest of Europe
  • 4. Asia Pacific
    • 4.1. India
    • 4.2. Japan
    • 4.3. Rest of Asia Pacific
  • 5. Middle East
  • 6. Saudi Arabia
    • 6.1. United Arab Emirates
    • 6.2. Rest of Middle East
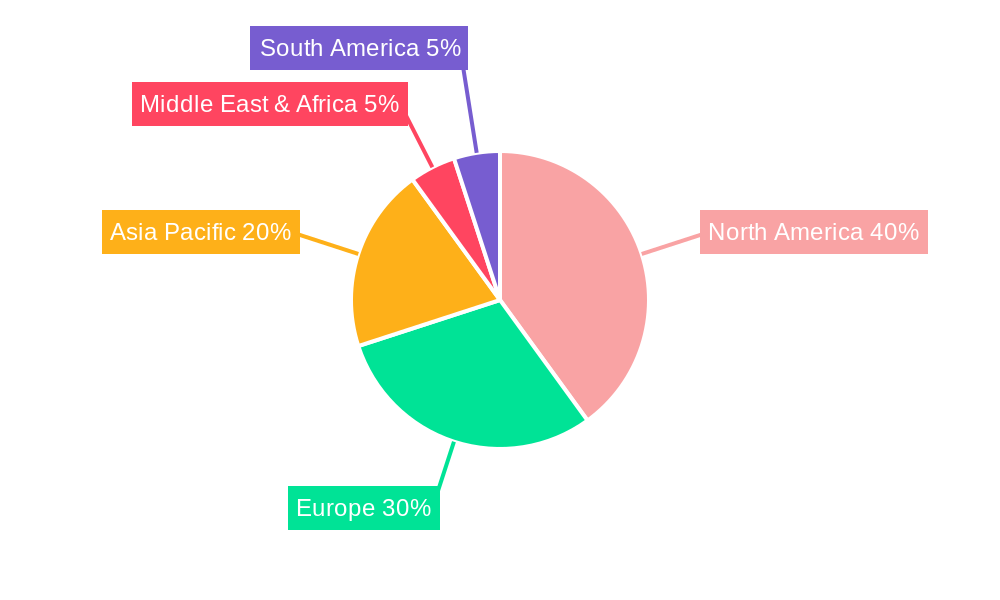
Virtual Cards Industry Regional Share


Virtual Cards Industry REPORT HIGHLIGHTS

AspectsDetails
Study Period 2019-2033
Base Year 2024
Estimated Year 2025
Forecast Period2025-2033
Historical Period2019-2024
Growth RateCAGR of > 12.00% from 2019-2033
Segmentation
    • By Product Type
      • B2B Virtual Cards
      • B2C Remote Payment Virtual Cards
      • B2C POS Virtual Cards
    • By End User
      • Consumer Use
      • Business Use
  • By Geography
    • North America
      • United States
      • Canada
      • Rest of North America
    • South America
      • Brazil
      • Peru
      • Rest of South America
    • Europe
      • United Kingdom
      • Germany
      • Rest of Europe
    • Asia Pacific
      • India
      • Japan
      • Rest of Asia Pacific
    • Middle East
    • Saudi Arabia
      • United Arab Emirates
      • Rest of Middle East


Table of Contents

  1. 1. Introduction
    • 1.1. Research Scope
    • 1.2. Market Segmentation
    • 1.3. Research Methodology
    • 1.4. Definitions and Assumptions
  2. 2. Executive Summary
    • 2.1. Introduction
  3. 3. Market Dynamics
    • 3.1. Introduction
      • 3.2. Market Drivers
        • 3.2.1. Digital Transformation is Driving the Market
      • 3.3. Market Restrains
        • 3.3.1. Connectivity and Technical Issues is Restraining the Market
      • 3.4. Market Trends
        • 3.4.1. Increasing Online Transactions is Augmenting the Virtual Cards Market in Asia-Pacific
  4. 4. Market Factor Analysis
    • 4.1. Porters Five Forces
    • 4.2. Supply/Value Chain
    • 4.3. PESTEL analysis
    • 4.4. Market Entropy
    • 4.5. Patent/Trademark Analysis
  5. 5. Virtual Cards Industry Analysis, Insights and Forecast, 2019-2031
    • 5.1. Market Analysis, Insights and Forecast - by Product Type
      • 5.1.1. B2B Virtual Cards
      • 5.1.2. B2C Remote Payment Virtual Cards
      • 5.1.3. B2C POS Virtual Cards
    • 5.2. Market Analysis, Insights and Forecast - by End User
      • 5.2.1. Consumer Use
      • 5.2.2. Business Use
    • 5.3. Market Analysis, Insights and Forecast - by Region
      • 5.3.1. North America
      • 5.3.2. South America
      • 5.3.3. Europe
      • 5.3.4. Asia Pacific
      • 5.3.5. Middle East
      • 5.3.6. Saudi Arabia
  6. 6. North America Virtual Cards Industry Analysis, Insights and Forecast, 2019-2031
    • 6.1. Market Analysis, Insights and Forecast - by Product Type
      • 6.1.1. B2B Virtual Cards
      • 6.1.2. B2C Remote Payment Virtual Cards
      • 6.1.3. B2C POS Virtual Cards
    • 6.2. Market Analysis, Insights and Forecast - by End User
      • 6.2.1. Consumer Use
      • 6.2.2. Business Use
  7. 7. South America Virtual Cards Industry Analysis, Insights and Forecast, 2019-2031
    • 7.1. Market Analysis, Insights and Forecast - by Product Type
      • 7.1.1. B2B Virtual Cards
      • 7.1.2. B2C Remote Payment Virtual Cards
      • 7.1.3. B2C POS Virtual Cards
    • 7.2. Market Analysis, Insights and Forecast - by End User
      • 7.2.1. Consumer Use
      • 7.2.2. Business Use
  8. 8. Europe Virtual Cards Industry Analysis, Insights and Forecast, 2019-2031
    • 8.1. Market Analysis, Insights and Forecast - by Product Type
      • 8.1.1. B2B Virtual Cards
      • 8.1.2. B2C Remote Payment Virtual Cards
      • 8.1.3. B2C POS Virtual Cards
    • 8.2. Market Analysis, Insights and Forecast - by End User
      • 8.2.1. Consumer Use
      • 8.2.2. Business Use
  9. 9. Asia Pacific Virtual Cards Industry Analysis, Insights and Forecast, 2019-2031
    • 9.1. Market Analysis, Insights and Forecast - by Product Type
      • 9.1.1. B2B Virtual Cards
      • 9.1.2. B2C Remote Payment Virtual Cards
      • 9.1.3. B2C POS Virtual Cards
    • 9.2. Market Analysis, Insights and Forecast - by End User
      • 9.2.1. Consumer Use
      • 9.2.2. Business Use
  10. 10. Middle East Virtual Cards Industry Analysis, Insights and Forecast, 2019-2031
    • 10.1. Market Analysis, Insights and Forecast - by Product Type
      • 10.1.1. B2B Virtual Cards
      • 10.1.2. B2C Remote Payment Virtual Cards
      • 10.1.3. B2C POS Virtual Cards
    • 10.2. Market Analysis, Insights and Forecast - by End User
      • 10.2.1. Consumer Use
      • 10.2.2. Business Use
  11. 11. Saudi Arabia Virtual Cards Industry Analysis, Insights and Forecast, 2019-2031
    • 11.1. Market Analysis, Insights and Forecast - by Product Type
      • 11.1.1. B2B Virtual Cards
      • 11.1.2. B2C Remote Payment Virtual Cards
      • 11.1.3. B2C POS Virtual Cards
    • 11.2. Market Analysis, Insights and Forecast - by End User
      • 11.2.1. Consumer Use
      • 11.2.2. Business Use
  12. 12. North America Virtual Cards Industry Analysis, Insights and Forecast, 2019-2031
      • 12.1. Market Analysis, Insights and Forecast - By Country/Sub-region
        • 12.1.1 United States
        • 12.1.2 Canada
        • 12.1.3 Rest of North America
  13. 13. South America Virtual Cards Industry Analysis, Insights and Forecast, 2019-2031
      • 13.1. Market Analysis, Insights and Forecast - By Country/Sub-region
        • 13.1.1 Brazil
        • 13.1.2 Peru
        • 13.1.3 Rest of South America
  14. 14. Europe Virtual Cards Industry Analysis, Insights and Forecast, 2019-2031
      • 14.1. Market Analysis, Insights and Forecast - By Country/Sub-region
        • 14.1.1 United Kingdom
        • 14.1.2 Germany
        • 14.1.3 Rest of Europe
  15. 15. Asia Pacific Virtual Cards Industry Analysis, Insights and Forecast, 2019-2031
      • 15.1. Market Analysis, Insights and Forecast - By Country/Sub-region
        • 15.1.1 India
        • 15.1.2 Japan
        • 15.1.3 Rest of Asia Pacific
  16. 16. Middle East & Africa Virtual Cards Industry Analysis, Insights and Forecast, 2019-2031
      • 16.1. Market Analysis, Insights and Forecast - By Country/Sub-region
        • 16.1.1 UAE
        • 16.1.2 South Africa
        • 16.1.3 Saudi Arabia
        • 16.1.4 Rest of MEA
  17. 17. Competitive Analysis
    • 17.1. Market Share Analysis 2024
      • 17.2. Company Profiles
        • 17.2.1 Abine Inc
          • 17.2.1.1. Overview
          • 17.2.1.2. Products
          • 17.2.1.3. SWOT Analysis
          • 17.2.1.4. Recent Developments
          • 17.2.1.5. Financials (Based on Availability)
        • 17.2.2 Fraedom Holdings Limited
          • 17.2.2.1. Overview
          • 17.2.2.2. Products
          • 17.2.2.3. SWOT Analysis
          • 17.2.2.4. Recent Developments
          • 17.2.2.5. Financials (Based on Availability)
        • 17.2.3 MineralTree Inc
          • 17.2.3.1. Overview
          • 17.2.3.2. Products
          • 17.2.3.3. SWOT Analysis
          • 17.2.3.4. Recent Developments
          • 17.2.3.5. Financials (Based on Availability)
        • 17.2.4 Billtrust Inc
          • 17.2.4.1. Overview
          • 17.2.4.2. Products
          • 17.2.4.3. SWOT Analysis
          • 17.2.4.4. Recent Developments
          • 17.2.4.5. Financials (Based on Availability)
        • 17.2.5 ACI Worldwide Inc **List Not Exhaustive
          • 17.2.5.1. Overview
          • 17.2.5.2. Products
          • 17.2.5.3. SWOT Analysis
          • 17.2.5.4. Recent Developments
          • 17.2.5.5. Financials (Based on Availability)
        • 17.2.6 American Express Company
          • 17.2.6.1. Overview
          • 17.2.6.2. Products
          • 17.2.6.3. SWOT Analysis
          • 17.2.6.4. Recent Developments
          • 17.2.6.5. Financials (Based on Availability)
        • 17.2.7 Mastercard Incorporated
          • 17.2.7.1. Overview
          • 17.2.7.2. Products
          • 17.2.7.3. SWOT Analysis
          • 17.2.7.4. Recent Developments
          • 17.2.7.5. Financials (Based on Availability)
        • 17.2.8 JPMorgan Chase & Co
          • 17.2.8.1. Overview
          • 17.2.8.2. Products
          • 17.2.8.3. SWOT Analysis
          • 17.2.8.4. Recent Developments
          • 17.2.8.5. Financials (Based on Availability)
        • 17.2.9 Alipay com Co Ltd
          • 17.2.9.1. Overview
          • 17.2.9.2. Products
          • 17.2.9.3. SWOT Analysis
          • 17.2.9.4. Recent Developments
          • 17.2.9.5. Financials (Based on Availability)
        • 17.2.10 Skrill USA Inc
          • 17.2.10.1. Overview
          • 17.2.10.2. Products
          • 17.2.10.3. SWOT Analysis
          • 17.2.10.4. Recent Developments
          • 17.2.10.5. Financials (Based on Availability)

List of Figures

  1. Figure 1: Virtual Cards Industry Revenue Breakdown (Million, %) by Product 2024 & 2032
  2. Figure 2: Virtual Cards Industry Share (%) by Company 2024

List of Tables

  1. Table 1: Virtual Cards Industry Revenue Million Forecast, by Region 2019 & 2032
  2. Table 2: Virtual Cards Industry Revenue Million Forecast, by Product Type 2019 & 2032
  3. Table 3: Virtual Cards Industry Revenue Million Forecast, by End User 2019 & 2032
  4. Table 4: Virtual Cards Industry Revenue Million Forecast, by Region 2019 & 2032
  5. Table 5: Virtual Cards Industry Revenue Million Forecast, by Country 2019 & 2032
  6. Table 6: United States Virtual Cards Industry Revenue (Million) Forecast, by Application 2019 & 2032
  7. Table 7: Canada Virtual Cards Industry Revenue (Million) Forecast, by Application 2019 & 2032
  8. Table 8: Rest of North America Virtual Cards Industry Revenue (Million) Forecast, by Application 2019 & 2032
  9. Table 9: Virtual Cards Industry Revenue Million Forecast, by Country 2019 & 2032
  10. Table 10: Brazil Virtual Cards Industry Revenue (Million) Forecast, by Application 2019 & 2032
  11. Table 11: Peru Virtual Cards Industry Revenue (Million) Forecast, by Application 2019 & 2032
  12. Table 12: Rest of South America Virtual Cards Industry Revenue (Million) Forecast, by Application 2019 & 2032
  13. Table 13: Virtual Cards Industry Revenue Million Forecast, by Country 2019 & 2032
  14. Table 14: United Kingdom Virtual Cards Industry Revenue (Million) Forecast, by Application 2019 & 2032
  15. Table 15: Germany Virtual Cards Industry Revenue (Million) Forecast, by Application 2019 & 2032
  16. Table 16: Rest of Europe Virtual Cards Industry Revenue (Million) Forecast, by Application 2019 & 2032
  17. Table 17: Virtual Cards Industry Revenue Million Forecast, by Country 2019 & 2032
  18. Table 18: India Virtual Cards Industry Revenue (Million) Forecast, by Application 2019 & 2032
  19. Table 19: Japan Virtual Cards Industry Revenue (Million) Forecast, by Application 2019 & 2032
  20. Table 20: Rest of Asia Pacific Virtual Cards Industry Revenue (Million) Forecast, by Application 2019 & 2032
  21. Table 21: Virtual Cards Industry Revenue Million Forecast, by Country 2019 & 2032
  22. Table 22: UAE Virtual Cards Industry Revenue (Million) Forecast, by Application 2019 & 2032
  23. Table 23: South Africa Virtual Cards Industry Revenue (Million) Forecast, by Application 2019 & 2032
  24. Table 24: Saudi Arabia Virtual Cards Industry Revenue (Million) Forecast, by Application 2019 & 2032
  25. Table 25: Rest of MEA Virtual Cards Industry Revenue (Million) Forecast, by Application 2019 & 2032
  26. Table 26: Virtual Cards Industry Revenue Million Forecast, by Product Type 2019 & 2032
  27. Table 27: Virtual Cards Industry Revenue Million Forecast, by End User 2019 & 2032
  28. Table 28: Virtual Cards Industry Revenue Million Forecast, by Country 2019 & 2032
  29. Table 29: United States Virtual Cards Industry Revenue (Million) Forecast, by Application 2019 & 2032
  30. Table 30: Canada Virtual Cards Industry Revenue (Million) Forecast, by Application 2019 & 2032
  31. Table 31: Rest of North America Virtual Cards Industry Revenue (Million) Forecast, by Application 2019 & 2032
  32. Table 32: Virtual Cards Industry Revenue Million Forecast, by Product Type 2019 & 2032
  33. Table 33: Virtual Cards Industry Revenue Million Forecast, by End User 2019 & 2032
  34. Table 34: Virtual Cards Industry Revenue Million Forecast, by Country 2019 & 2032
  35. Table 35: Brazil Virtual Cards Industry Revenue (Million) Forecast, by Application 2019 & 2032
  36. Table 36: Peru Virtual Cards Industry Revenue (Million) Forecast, by Application 2019 & 2032
  37. Table 37: Rest of South America Virtual Cards Industry Revenue (Million) Forecast, by Application 2019 & 2032
  38. Table 38: Virtual Cards Industry Revenue Million Forecast, by Product Type 2019 & 2032
  39. Table 39: Virtual Cards Industry Revenue Million Forecast, by End User 2019 & 2032
  40. Table 40: Virtual Cards Industry Revenue Million Forecast, by Country 2019 & 2032
  41. Table 41: United Kingdom Virtual Cards Industry Revenue (Million) Forecast, by Application 2019 & 2032
  42. Table 42: Germany Virtual Cards Industry Revenue (Million) Forecast, by Application 2019 & 2032
  43. Table 43: Rest of Europe Virtual Cards Industry Revenue (Million) Forecast, by Application 2019 & 2032
  44. Table 44: Virtual Cards Industry Revenue Million Forecast, by Product Type 2019 & 2032
  45. Table 45: Virtual Cards Industry Revenue Million Forecast, by End User 2019 & 2032
  46. Table 46: Virtual Cards Industry Revenue Million Forecast, by Country 2019 & 2032
  47. Table 47: India Virtual Cards Industry Revenue (Million) Forecast, by Application 2019 & 2032
  48. Table 48: Japan Virtual Cards Industry Revenue (Million) Forecast, by Application 2019 & 2032
  49. Table 49: Rest of Asia Pacific Virtual Cards Industry Revenue (Million) Forecast, by Application 2019 & 2032
  50. Table 50: Virtual Cards Industry Revenue Million Forecast, by Product Type 2019 & 2032
  51. Table 51: Virtual Cards Industry Revenue Million Forecast, by End User 2019 & 2032
  52. Table 52: Virtual Cards Industry Revenue Million Forecast, by Country 2019 & 2032
  53. Table 53: Virtual Cards Industry Revenue Million Forecast, by Product Type 2019 & 2032
  54. Table 54: Virtual Cards Industry Revenue Million Forecast, by End User 2019 & 2032
  55. Table 55: Virtual Cards Industry Revenue Million Forecast, by Country 2019 & 2032
  56. Table 56: United Arab Emirates Virtual Cards Industry Revenue (Million) Forecast, by Application 2019 & 2032
  57. Table 57: Rest of Middle East Virtual Cards Industry Revenue (Million) Forecast, by Application 2019 & 2032


Frequently Asked Questions

1. What is the projected Compound Annual Growth Rate (CAGR) of the Virtual Cards Industry?

The projected CAGR is approximately > 12.00%.

2. Which companies are prominent players in the Virtual Cards Industry?

Key companies in the market include Abine Inc, Fraedom Holdings Limited, MineralTree Inc, Billtrust Inc, ACI Worldwide Inc **List Not Exhaustive, American Express Company, Mastercard Incorporated, JPMorgan Chase & Co, Alipay com Co Ltd, Skrill USA Inc.

3. What are the main segments of the Virtual Cards Industry?

The market segments include Product Type, End User.

4. Can you provide details about the market size?

The market size is estimated to be USD 319.20 Million as of 2022.

5. What are some drivers contributing to market growth?

Digital Transformation is Driving the Market.

6. What are the notable trends driving market growth?

Increasing Online Transactions is Augmenting the Virtual Cards Market in Asia-Pacific.

7. Are there any restraints impacting market growth?

Connectivity and Technical Issues is Restraining the Market.

8. Can you provide examples of recent developments in the market?

December 2023: Conferma Pay and Mastercard expanded their partnership to enable mobile virtual card payments. Mastercard’s commercial bank clients were expected to be able to offer the convenience of contactless virtual card payments to their corporate customers using Conferma Pay.

9. What pricing options are available for accessing the report?

Pricing options include single-user, multi-user, and enterprise licenses priced at USD 3800, USD 4500, and USD 5800 respectively.

10. Is the market size provided in terms of value or volume?

The market size is provided in terms of value, measured in Million.

11. Are there any specific market keywords associated with the report?

Yes, the market keyword associated with the report is "Virtual Cards Industry," which aids in identifying and referencing the specific market segment covered.

12. How do I determine which pricing option suits my needs best?

The pricing options vary based on user requirements and access needs. Individual users may opt for single-user licenses, while businesses requiring broader access may choose multi-user or enterprise licenses for cost-effective access to the report.

13. Are there any additional resources or data provided in the Virtual Cards Industry report?

While the report offers comprehensive insights, it's advisable to review the specific contents or supplementary materials provided to ascertain if additional resources or data are available.

14. How can I stay updated on further developments or reports in the Virtual Cards Industry?

To stay informed about further developments, trends, and reports in the Virtual Cards Industry, consider subscribing to industry newsletters, following relevant companies and organizations, or regularly checking reputable industry news sources and publications.


Methodology

Step 1 - Identification of Relevant Samples Size from Population Database

Step Chart
Bar Chart
Method Chart

Step 2 - Approaches for Defining Global Market Size (Value, Volume* & Price*)

Approach Chart
Top-down and bottom-up approaches are used to validate the global market size and estimate the market size for manufactures, regional segments, product, and application.

Note*: In applicable scenarios

Step 3 - Data Sources

Primary Research

  • Web Analytics
  • Survey Reports
  • Research Institute
  • Latest Research Reports
  • Opinion Leaders

Secondary Research

  • Annual Reports
  • White Paper
  • Latest Press Release
  • Industry Association
  • Paid Database
  • Investor Presentations
Analyst Chart

Step 4 - Data Triangulation

Involves using different sources of information in order to increase the validity of a study

These sources are likely to be stakeholders in a program - participants, other researchers, program staff, other community members, and so on.

Then we put all data in single framework & apply various statistical tools to find out the dynamic on the market.

During the analysis stage, feedback from the stakeholder groups would be compared to determine areas of agreement as well as areas of divergence

Additionally, after gathering mixed and scattered data from a wide range of sources, data is triangulated and correlated to come up with estimated figures which are further validated through primary mediums or industry experts, opinion leaders.

About Research Axiom

Research Axiom delivers in-depth market research, industry analysis, and consulting for pharmaceuticals, automotive, IT, and consumer goods. Our reports provide the clarity you need to make informed decisions and drive innovation.

Our team combines primary research, advanced analytics, and sector expertise to deliver actionable intelligence. We offer syndicated reports, custom research, and consulting services tailored to your business needs.

At Research Axiom, we are committed to quality, transparency, and client satisfaction. Every report is rigorously validated to ensure accuracy and relevance. Our global perspective and local expertise help you understand both the big picture and the finer details of your market.

Stay informed with Research Axiom. Subscribe to our newsletter for the latest updates and research highlights, and follow us on social media for real-time insights. Research Axiom – Turning Data into Business Advantage.

artwork spiralartwork spiralRelated Reports
artwork underline

US Anti Money Laundering Solution Market Industry Overview and Projections

Explore the booming U.S. Anti-Money Laundering (AML) solutions market, projected to reach $8.5 billion by 2025 with a 13% CAGR. Discover key drivers like stringent regulations, KYC systems, transaction monitoring, and leading companies.

September 2025
Base Year: 2024
No Of Pages: 197
Price: $3800

Growth Roadmap for French Property Insurance Market Market 2025-2033

Explore the French Property Insurance Market's significant growth, driven by evolving needs and innovative distribution. Get insights into market size, CAGR, key drivers, trends, and forecasts.

September 2025
Base Year: 2024
No Of Pages: 197
Price: $3800

Asia-Pacific Neo Banking Market Planning for the Future: Key Trends 2025-2033

Explore the dynamic Asia-Pacific neo banking market, projected to reach $150 billion by 2025 with an 8.00% CAGR. Discover key drivers, trends, restraints, and leading players in this rapidly evolving fintech landscape.

September 2025
Base Year: 2024
No Of Pages: 234
Price: $4750

North America Fintech Industry Soars to XXX Million, witnessing a CAGR of XX during the forecast period 2025-2033

The North American Fintech market is booming, projected to reach [estimated 2033 value] by 2033, with a CAGR of 17.5%. This in-depth analysis explores market drivers, trends, and key players like SoFi, Stripe, and Square, covering segments like digital lending, payments, and investments. Discover the future of finance in North America.

August 2025
Base Year: 2024
No Of Pages: 210
Price: $4750

Wealth Management Industry in Europe Market Expansion: Growth Outlook 2025-2033

Discover the latest insights into Europe's booming wealth management market. Our analysis reveals a €43.02 billion market in 2025, projected to grow at a 4.41% CAGR through 2033. Explore key drivers, trends, and challenges shaping this dynamic industry, including HNWIs, digital wealth management, and ESG investing. Get your competitive edge today!

August 2025
Base Year: 2024
No Of Pages: 197
Price: $3800

Strategic Growth Drivers for US Electronic Gadgets Insurance Market Market

The US Electronic Gadgets Insurance Market is booming, projected to reach $19.58B in 2025, with an 11.54% CAGR. Learn about market drivers, trends, restraints, key players (AIG, Progressive, Allianz), and regional insights. Discover growth opportunities in this expanding sector.

August 2025
Base Year: 2024
No Of Pages: 197
Price: $3800

Asia-Pacific Islamic Finance Market Market Demand Dynamics: Insights 2025-2033

Discover the booming Asia-Pacific Islamic finance market! This comprehensive analysis reveals a CAGR exceeding 3.50%, driven by rising demand for Sharia-compliant products and supportive government policies. Explore key trends, leading players (Maybank Islamic, CIMB Islamic Bank, etc.), and future growth projections.

August 2025
Base Year: 2024
No Of Pages: 234
Price: $4750

Motor Insurance Market Market’s Consumer Preferences: Trends and Analysis 2025-2033

The global motor insurance market is booming, projected to reach $XX million by 2033 with a 5.03% CAGR. Discover key trends, drivers, and restraints shaping this dynamic industry, including insights on regional growth, leading companies, and insurance product segments. Learn more about the future of motor insurance.

August 2025
Base Year: 2024
No Of Pages: 234
Price: $4750

Exploring Consumer Shifts in China Auto Loan Market Market 2025-2033

Discover the booming China auto loan market – a $150 billion industry projected to grow at over 8% CAGR through 2033. Analyze market trends, key players (China Merchant Bank, Volkswagen Finance, etc.), and regional breakdowns in this in-depth market analysis. Learn about the drivers and restraints shaping this dynamic sector.

August 2025
Base Year: 2024
No Of Pages: 197
Price: $3800

Understanding Growth Trends in Teeth Insurance Market in UK Market

Discover the booming UK teeth insurance market! Learn about its £500 million valuation, 5% CAGR, key players (Simplyhealth, Bupa, Cigna), and projected growth to 2033. Explore market drivers, trends, and regional insights in our comprehensive analysis.

August 2025
Base Year: 2024
No Of Pages: 197
Price: $3800

India Dental Insurance Market Unlocking Growth Potential: Analysis and Forecasts 2025-2033

Discover the booming Indian dental insurance market! Learn about its 18% CAGR, key drivers like rising dental awareness and aging population, and the leading players like Aetna & AXA. Explore market segmentation, regional analysis, and future growth projections in our comprehensive report.

August 2025
Base Year: 2024
No Of Pages: 197
Price: $3800

Unveiling South America ETF industry Industry Trends

Discover the booming South American ETF market! This in-depth analysis reveals a $9.24B market (2025) growing at a CAGR >5%, driven by rising middle classes and foreign investment. Learn about key players like iShares, Banco do Brasil, and market trends impacting this dynamic sector through 2033.

August 2025
Base Year: 2024
No Of Pages: 210
Price: $4750

Consumer Behavior and Japan Trade Finance Market Trends

Discover the booming Japan Trade Finance Market projected to reach \$16 billion in 2025. Explore market trends, key drivers (like digitalization & sustainable finance), and top players (Wells Fargo, Morgan Stanley, Sumitomo Mitsui). This in-depth analysis forecasts growth to 2033.

August 2025
Base Year: 2024
No Of Pages: 197
Price: $3800

Demand Patterns in Europe InsurTech Market Market: Projections to 2033

The European InsurTech market is booming, with a CAGR exceeding 15%! Discover key trends, leading companies (Wefox, Clark, Coya), and growth projections for 2025-2033. Learn about the challenges and opportunities shaping this dynamic sector.

August 2025
Base Year: 2024
No Of Pages: 234
Price: $4750

Indian Health Insurance Market Market’s Consumer Landscape: Insights and Trends 2025-2033

Discover the booming Indian health insurance market! This comprehensive analysis reveals a projected CAGR of 10.60% from 2025-2033, driven by rising healthcare costs and increased awareness. Explore market size, key players (Star Health, Aditya Birla, ICICI Lombard, and more), and future trends.

August 2025
Base Year: 2024
No Of Pages: 197
Price: $3800

Canada Asset Management Market Strategic Insights: Analysis 2025 and Forecasts 2033

Discover the booming Canadian asset management market! This in-depth analysis reveals key trends, growth drivers, leading companies (RBC, TD, BlackRock, etc.), and regional market shares from 2019-2033. Learn about the opportunities and challenges shaping this dynamic sector.

August 2025
Base Year: 2024
No Of Pages: 197
Price: $3800

India Car Insurance Market Analysis 2025-2033: Unlocking Competitive Opportunities

Discover the booming India car insurance market! Our analysis reveals a $3.37 billion market in 2025, projected to grow at a 6.56% CAGR until 2033. Explore key drivers, trends, and leading players shaping this dynamic sector. Get insights into market segmentation, regional analysis, and future growth potential.

August 2025
Base Year: 2024
No Of Pages: 197
Price: $3800

Japan Auto Loan Market Market’s Consumer Preferences: Trends and Analysis 2025-2033

Discover the booming Japan auto loan market! This in-depth analysis reveals key trends, growth drivers, and challenges from 2019-2033, highlighting major players like Mitsubishi UFJ Financial Group and Toyota Financial Services. Learn about market segmentation, regional variations, and future projections for this dynamic sector.

August 2025
Base Year: 2024
No Of Pages: 197
Price: $3800

Venture Capital Industry Market Expansion: Growth Outlook 2025-2033

Venture Capital market analysis reveals a booming $3 trillion industry (2025) with a CAGR exceeding 5%. Discover key drivers, trends, and restraints influencing this dynamic sector, including prominent investors like Sequoia Capital and Tiger Global. Explore regional market shares and forecast data (2025-2033).

August 2025
Base Year: 2024
No Of Pages: 234
Price: $4750

UK Pension Fund Market Market Analysis and Forecasts

Discover the latest insights into the booming UK Pension Fund Market. Projected to reach [Estimate final value from chart_data] by 2033, this report analyzes market size, growth drivers, and key players like USS, NatWest, and more. Explore market trends and investment strategies within the UK pension landscape.

August 2025
Base Year: 2024
No Of Pages: 197
Price: $3800

Strategic Vision for India Home Mortgage Finance Market Market Expansion

Discover the booming India Home Mortgage Finance Market! Our in-depth analysis reveals a CAGR exceeding 7% through 2033, driven by economic growth and government initiatives. Explore key players, market trends, and future projections.

August 2025
Base Year: 2024
No Of Pages: 197
Price: $3800

India Gift Card And Incentive Card Market Market’s Growth Blueprint

The India Gift Card & Incentive Card Market is booming, projected to reach \$11.88 billion by 2025, with a CAGR of 17.67%. Discover key drivers, trends, and top players shaping this rapidly growing sector. Explore market analysis, forecasts to 2033, and regional breakdowns.

August 2025
Base Year: 2024
No Of Pages: 197
Price: $3800

Saudi Arabia Gift Card and Incentive Card Market 2025-2033 Trends: Unveiling Growth Opportunities and Competitor Dynamics

Discover the booming Saudi Arabia gift card & incentive card market! Our in-depth analysis reveals a CAGR exceeding 7%, driven by e-commerce, corporate incentives, and digital gifting trends. Explore market size, segmentation, key players (Amazon, Givingli, etc.), and future projections to 2033.

July 2025
Base Year: 2024
No Of Pages: 197
Price: $3800

Uruguay Life & Non-Life Insurance Market Strategic Market Opportunities: Trends 2025-2033

Discover the booming Uruguay Life & Non-Life Insurance Market! Explore its 11% CAGR, key drivers, top players (Banco de Seguros del Estado, Mapfre, etc.), and future projections to 2033. Get insights into market segmentation and regional growth opportunities.

July 2025
Base Year: 2024
No Of Pages: 197
Price: $3800

Emerging Growth Patterns in North America Fixed Income Assets Market Market

Discover the latest insights into the North American fixed income assets market. This comprehensive analysis reveals a steady growth trajectory, driven by institutional investment and retirement savings, yet facing challenges from interest rate fluctuations and regulatory changes. Learn about key players, market trends, and future projections for 2025-2033.

July 2025
Base Year: 2024
No Of Pages: 197
Price: $3800

Consumer Behavior and North America Sports Team And Clubs Market Trends

Discover the booming North American sports team & clubs market! This analysis reveals a 6.20% CAGR, driven by media rights, fan engagement, and sponsorship. Explore market size, trends, and key players including ESPN, Dallas Cowboys, and more. Get the insights you need to succeed in this dynamic industry.

July 2025
Base Year: 2024
No Of Pages: 210
Price: $4750

Navigating Agriculture Equipment Finance Market Market Growth 2025-2033

The Agriculture Equipment Finance Market is booming, projected to reach [estimated 2033 value] by 2033, with a CAGR of 4.23%. This in-depth analysis explores market drivers, trends, restraints, and key players like Deere & Co and AGCO Corp, across regions including North America, Europe, and Asia-Pacific. Discover the latest insights on financing options like leases and loans for tractors, harvesters, and other agricultural equipment.

July 2025
Base Year: 2024
No Of Pages: 234
Price: $4750

Australia Gift Card & Incentive Card Industry Future-Proofing Growth: Strategic Insights and Analysis 2025-2033

Discover the booming Australian gift card & incentive card market! This in-depth analysis reveals a market size exceeding $2.5 billion AUD in 2025, driven by e-commerce, corporate incentives, and evolving consumer preferences. Learn about key players, market trends, and future growth projections to 2033.

July 2025
Base Year: 2024
No Of Pages: 197
Price: $3800

Exploring Innovations in E-Brokerage Market In The United Kingdom: Market Dynamics 2025-2033

Discover the booming UK e-brokerage market! Our analysis reveals a £693.77 million market in 2025, projected to grow steadily at a 2.83% CAGR until 2033. Learn about key drivers, trends, and top players like eToro and IG Group. Invest smartly with our insights.

July 2025
Base Year: 2024
No Of Pages: 197
Price: $3800

Investment Banking Industry Industry Growth Trends and Analysis

Investment Banking Market 2025-2033: Explore the industry's projected growth (CAGR 2.10%), key players (Goldman Sachs, JP Morgan Chase), regional trends, and future outlook. Discover market size estimates and significant drivers influencing this dynamic sector. Learn how regulatory changes and technological innovations are shaping the future.

July 2025
Base Year: 2024
No Of Pages: 234
Price: $4750

Decoding Market Trends in Asia-Pacific Livestock Insurance Market: 2025-2033 Analysis

The Asia-Pacific livestock insurance market is booming, projected to reach [insert final year market size from chart data] by 2033 with a CAGR of 7.76%. This report analyzes market drivers, trends, restraints, and key players like AXA XL and The New India Assurance, offering valuable insights for investors and industry stakeholders. Discover the growth potential in livestock insurance across key regions.

July 2025
Base Year: 2024
No Of Pages: 197
Price: $3800

Digital Banking Market in MEA Strategic Market Roadmap: Analysis and Forecasts 2025-2033

Discover the booming MEA digital banking market! This analysis reveals key trends, drivers, and restraints shaping the industry's growth (CAGR >3.5%) from 2025-2033. Learn about major players and regional insights.

July 2025
Base Year: 2024
No Of Pages: 210
Price: $4750

Emerging Markets for United Kingdom Motor Insurance Market Industry

Discover the latest insights on the booming UK motor insurance market, projected to reach £32.38 billion by 2033. Explore market size, CAGR, key players (Aviva, Allianz, AXA), and emerging trends like telematics and usage-based insurance. Learn how technological advancements, competition, and economic factors are shaping this dynamic sector.

July 2025
Base Year: 2024
No Of Pages: 197
Price: $3800

Strategic Roadmap for US Gift Card and Incentive Card Market Industry

Discover the booming US gift card & incentive card market! Explore key trends, leading companies (Visa, American Express, Blackhawk Network), and projected growth to 2033. Learn how digital transformation and evolving consumer preferences are shaping this multi-billion dollar industry.

July 2025
Base Year: 2024
No Of Pages: 197
Price: $3800

US Mortgage Lending Market Market Report: Strategic Insights

Discover the latest insights on the booming US mortgage lending market. This analysis reveals key growth drivers, market trends, and major players like Bank of America and Chase, projecting significant expansion through 2033. Explore regional breakdowns and competitive dynamics in this comprehensive report.

July 2025
Base Year: 2024
No Of Pages: 197
Price: $3800

Strategic Insights into UK Electronic Gadgets Insurance Market Market Trends

The UK electronic gadgets insurance market is booming, with a CAGR exceeding 10%! Learn about market trends, key players (AXA, Aviva, Assurant), and growth drivers in this comprehensive analysis covering the period 2019-2033. Discover the market size, segmentation, and future outlook for this rapidly expanding sector.

July 2025
Base Year: 2024
No Of Pages: 197
Price: $3800

India Car Loan Market Innovations Shaping Market Growth 2025-2033

India's booming car loan market is projected to reach \$48.47 Billion by 2033, growing at an impressive CAGR of 8.67%. This report analyzes market drivers, trends, and key players like SBI, Kotak Mahindra Prime, and Axis Bank, providing insights into this dynamic sector.

July 2025
Base Year: 2024
No Of Pages: 197
Price: $3800

Microinsurance Market Future-Proofing Growth: Strategic Insights and Analysis 2025-2033

Discover the booming microinsurance market! This comprehensive analysis reveals a $70.1B market (2025) growing at a 6.53% CAGR, driven by fintech, financial inclusion, and increasing risk awareness. Explore key players, regional trends, and future projections to 2033.

July 2025
Base Year: 2024
No Of Pages: 234
Price: $4750

UAE Life & Non-Life Insurance Market Future-proof Strategies: Trends, Competitor Dynamics, and Opportunities 2025-2033

Discover the booming UAE Life & Non-Life Insurance market, projected to exceed a substantial value by 2033, driven by economic growth and rising insurance awareness. Explore market trends, key players (Orient Insurance, MetLife, AIG), and future growth opportunities in this comprehensive analysis.

July 2025
Base Year: 2024
No Of Pages: 197
Price: $3800

Auto Loan Market Growth Opportunities: Market Size Forecast to 2033

Explore the booming auto loan market, projected to exceed a 5% CAGR through 2033. This in-depth analysis covers market size, key drivers (affordability, financing options), trends (online applications, used car loans), restraints, and regional breakdowns (North America, Europe, Asia-Pacific). Discover insights into leading companies, segmentations, and future growth potential.

July 2025
Base Year: 2024
No Of Pages: 197
Price: $3800

Decoding UK Sports Promoters Market Consumer Preferences 2025-2033

Discover the booming UK Sports Promoters Market! Explore its £800m valuation, 7%+ CAGR, key drivers, leading companies (Matchroom Sports, Queensberry Promotions, Premier League), and future trends in this dynamic sector. Get insights into regional market share and growth projections until 2033.

July 2025
Base Year: 2024
No Of Pages: 197
Price: $3800

Exploring Insurance Brokerage Market Market Evolution 2025-2033

The global insurance brokerage market, valued at $320.55 million in 2025, is poised for significant growth with a projected CAGR of 3.56% through 2033. Discover key market trends, drivers, and challenges impacting major players like Marsh & McLennan and Aon. Explore regional insights and forecast data for strategic planning.

July 2025
Base Year: 2024
No Of Pages: 197
Price: $3800

Australia Fintech Market Market’s Role in Emerging Tech: Insights and Projections 2025-2033

The Australian Fintech market is booming, projected to reach $9 billion by 2033 with a CAGR of 10.32%. This in-depth analysis explores market drivers, trends, restraints, key players (Afterpay, Stripe, Wise), and regional breakdowns. Discover the future of finance in Australia.

July 2025
Base Year: 2024
No Of Pages: 197
Price: $3800

ESG Finance Market Report: Trends and Forecasts 2025-2033

The ESG finance market is booming, projected to reach \$7.02 billion by 2025 and grow at a CAGR of 10.04% through 2033. Learn about key drivers, trends, and top players in this rapidly evolving sector. Explore the impact of ESG investing, sustainable finance, and responsible business practices.

July 2025
Base Year: 2024
No Of Pages: 197
Price: $3800

Virtual Cards Industry Industry Overview and Projections

The virtual cards market is booming, projected to reach $319.20 million in 2025 and grow at a CAGR exceeding 12% through 2033. Discover key trends, drivers, and top companies shaping this dynamic industry, including B2B and B2C applications. Explore regional market share and future projections for this rapidly expanding sector.

July 2025
Base Year: 2024
No Of Pages: 197
Price: $3800

Consumer Trends Driving Australia Buy Now Pay Later Services Market Market Growth

Discover the booming Australian Buy Now Pay Later (BNPL) market! This in-depth analysis reveals key trends, growth drivers, leading companies (Afterpay, Zip, Openpay, etc.), and future projections through 2033. Learn about the market size, CAGR, and regulatory landscape impacting this rapidly evolving sector.

July 2025
Base Year: 2024
No Of Pages: 197
Price: $3800

Performance Bank Guarantee Market Strategic Roadmap: Analysis and Forecasts 2025-2033

Discover the booming Performance Bank Guarantee market! Projected to reach [estimate based on CAGR, e.g., $37.68 Billion] by 2033, this market is driven by global project growth and regulatory compliance. Learn about key players, trends, and regional insights in this comprehensive analysis.

July 2025
Base Year: 2024
No Of Pages: 234
Price: $4750

Strategic Insights for Finland Cyber (Liability) Insurance Market Market Expansion

The Finland cyber liability insurance market is experiencing steady growth (CAGR 2.00%), driven by increasing cyber threats and digitalization. Learn about market trends, key players (OP Insurance, AIG, Aon, AXA), and the potential for growth through 2033 in this comprehensive market analysis.

July 2025
Base Year: 2024
No Of Pages: 197
Price: $3800

Vehicle Insurance Market in Bangladesh Market Outlook and Strategic Insights

Discover the booming Bangladesh vehicle insurance market! This comprehensive analysis reveals a CAGR exceeding 5%, driven by rising vehicle ownership and urbanization. Learn about key players, market trends, and growth opportunities in this dynamic sector (2019-2033).

July 2025
Base Year: 2024
No Of Pages: 197
Price: $3800

Strategic Roadmap for Cryptocurrency Market Industry

Discover the explosive growth of the cryptocurrency market, projected to reach [estimated 2033 value] by 2033 with a CAGR of 7.77%. This in-depth analysis covers market drivers, trends, restraints, key players (Coinbase, Binance, etc.), and regional breakdowns. Explore the future of Bitcoin, Ethereum, and other cryptocurrencies.

July 2025
Base Year: 2024
No Of Pages: 234
Price: $4750
  • Home
  • About Us
  • Industries
    • Aerospace & Defense
    • Agriculture
    • Animal Nutrition & Wellness
    • Automotive
    • Chemicals & Materials
    • Consumer Goods and Services
    • Energy & Power
    • Financial Services and Investment Intelligence
    • Food & Beverage
    • Home and Property Improvement
    • Hospitality and Tourism
    • Logistics
    • Manufacturing Products and Services
    • Packaging
    • Professional and Commercial Services
    • Real Estate and Construction
    • Retail
    • Technology, Media and Telecom
    • Healthcare
  • Services
  • Contact
Main Logo
  • Home
  • About Us
  • Industries
    • Aerospace & Defense
    • Agriculture
    • Animal Nutrition & Wellness
    • Automotive
    • Chemicals & Materials
    • Consumer Goods and Services
    • Energy & Power
    • Financial Services and Investment Intelligence
    • Food & Beverage
    • Home and Property Improvement
    • Hospitality and Tourism
    • Logistics
    • Manufacturing Products and Services
    • Packaging
    • Professional and Commercial Services
    • Real Estate and Construction
    • Retail
    • Technology, Media and Telecom
    • Healthcare
  • Services
  • Contact
+17162654855
[email protected]

+17162654855

[email protected]

Business Address

Head Office

Ansec House 3 rd floor Tank Road, Yerwada, Pune, Maharashtra 411014

Contact Information

Craig Francis

Business Development Head

+17162654855

[email protected]

Secure Payment Partners

payment image
RetailLogisticsPackagingAutomotiveHealthcareAgricultureEnergy & PowerFood & BeverageAerospace & DefenseChemicals & MaterialsHospitality and TourismAnimal Nutrition & WellnessConsumer Goods and ServicesReal Estate and ConstructionHome and Property ImprovementTechnology, Media and TelecomManufacturing Products and ServicesFinancial Services and Investment Intelligence

© 2025 PRDUA Research & Media Private Limited, All rights reserved

Privacy Policy
Terms and Conditions
FAQ