Key Insights
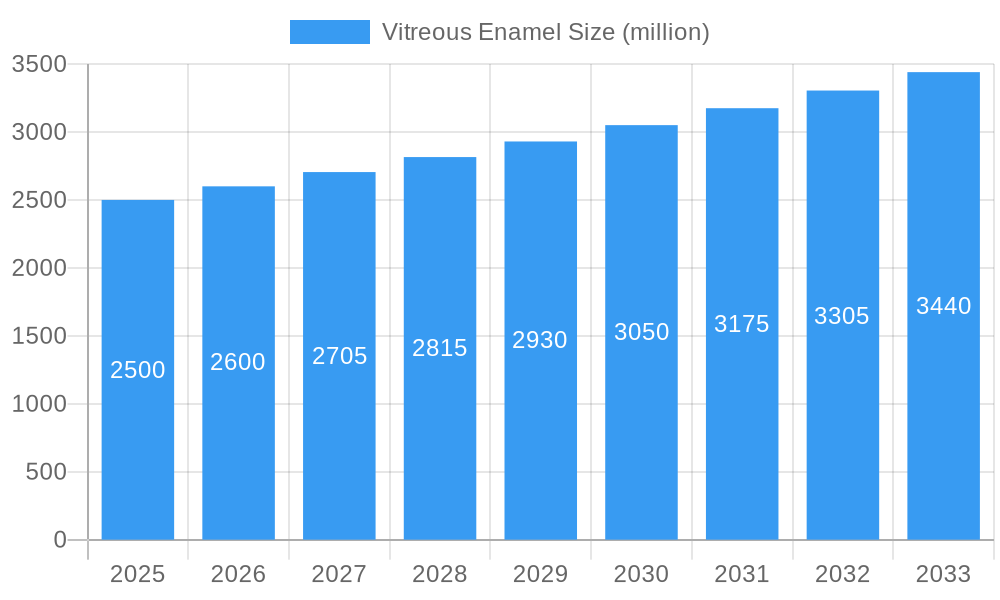
The vitreous enamel market is projected for robust expansion, fueled by escalating demand from key sectors including appliances, construction, and automotive. Current market size is estimated at $6.7 billion in the base year 2025, with a significant compound annual growth rate (CAGR) of 15.91% anticipated over the forecast period. This growth is underpinned by increasing adoption in sustainable building materials and advancements in enamel formulations for enhanced durability and aesthetics. Key market drivers include a growing emphasis on eco-friendly enamel compositions and the integration of smart technologies in applications such as self-cleaning appliances. Emerging challenges include price volatility of raw materials and the rise of alternative coating technologies. Leading companies like Vibrantz Technologies, Capron Manufacturing, and AkCoat are actively investing in research and development to innovate product features and expand market reach.
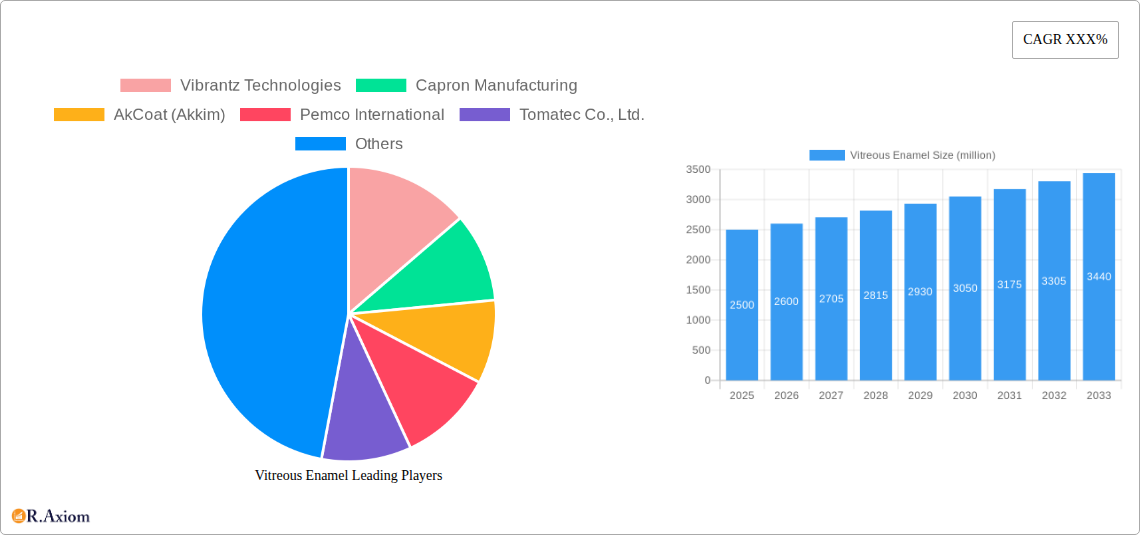
Vitreous Enamel Market Size (In Billion)
The competitive landscape features a blend of established global manufacturers and agile regional players. Strategic approaches for market participants include offering tailored solutions, prioritizing sustainable and high-performance products, and cultivating robust supply chain partnerships. Mergers and acquisitions are expected to influence the industry's future trajectory. Continuous adaptation to evolving consumer preferences and technological breakthroughs is crucial for maintaining a competitive edge. Significant growth opportunities are emerging in developing economies, driven by infrastructure development and a rising demand for long-lasting and aesthetically pleasing products. The market is expected to mature, with a progressive shift towards advanced enamel formulations and customized solutions for specific applications.
Vitreous Enamel Company Market Share
This report delivers an in-depth analysis of the global vitreous enamel market, providing critical insights for stakeholders, investors, and researchers. Covering the period 2019-2033, with a focus on 2025, this study details market trends, competitive dynamics, and future growth projections. It thoroughly examines market concentration, innovation pipelines, key players, and emerging opportunities, empowering strategic decision-making.
Vitreous Enamel Market Concentration & Innovation
The vitreous enamel market exhibits a moderately concentrated structure, with several key players holding significant market share. Vibrantz Technologies, Capron Manufacturing, and AkCoat (Akkim) are among the leading companies, each commanding a substantial portion of the market (exact figures available in the full report). Innovation in vitreous enamel is driven by the demand for enhanced durability, aesthetic appeal, and sustainable manufacturing processes. Recent developments include advancements in color technology, improved chemical resistance, and the exploration of eco-friendly enamel formulations.
- Market Share: Vibrantz Technologies holds an estimated xx% market share in 2025, followed by Capron Manufacturing at xx% and AkCoat (Akkim) at xx%.
- M&A Activity: The past five years have witnessed several significant mergers and acquisitions, with total deal values exceeding $XX million. The full report details these transactions and their impact on market dynamics.
- Regulatory Landscape: Stringent environmental regulations are influencing the development of sustainable vitreous enamel products, pushing manufacturers towards eco-friendly solutions.
- Product Substitutes: Competition comes from alternative materials such as powder coatings and paints; however, vitreous enamel maintains a strong position due to its superior durability and aesthetic qualities.
- End-User Trends: The increasing demand for energy-efficient appliances and sustainable building materials is driving growth in the vitreous enamel market.
Vitreous Enamel Industry Trends & Insights
The global vitreous enamel market is experiencing robust growth, driven by several key factors. The increasing demand for durable and aesthetically pleasing surfaces across various applications, such as appliances, architectural elements, and industrial components, fuels market expansion. Technological advancements in enamel formulation and application processes are further enhancing product performance and expanding market reach. Consumer preferences are shifting towards eco-friendly and sustainable products, influencing the adoption of environmentally conscious manufacturing practices within the industry. The competitive landscape is characterized by both established players and emerging companies, fostering innovation and driving down costs. The CAGR for the forecast period (2025-2033) is projected at xx%, with market penetration expected to reach xx% by 2033.
Dominant Markets & Segments in Vitreous Enamel
The report identifies [Leading Region/Country] as the dominant market for vitreous enamel, accounting for a significant share of global consumption. This dominance is attributed to several key factors:
- Strong Economic Growth: Consistent economic growth and rising disposable incomes fuel demand for durable goods and infrastructure projects that utilize vitreous enamel.
- Robust Construction Sector: A thriving construction industry drives demand for vitreous enamel-coated building materials.
- Government Initiatives: Supportive government policies promoting sustainable building practices and energy efficiency further boost market growth.
[Detailed analysis of dominance will be provided in the full report, including regional breakdown and specific market drivers for each region.]
Vitreous Enamel Product Developments
Recent product innovations focus on enhancing durability, scratch resistance, and aesthetic appeal. New enamel formulations offer improved chemical resistance and thermal shock resistance, expanding the application possibilities of vitreous enamel in diverse industries. The integration of nanotechnology and advanced materials is also leading to the development of high-performance enamels with exceptional properties. These advancements cater to the growing demand for sustainable and aesthetically pleasing products across diverse sectors.
Report Scope & Segmentation Analysis
This report segments the vitreous enamel market based on several factors including product type (e.g., cast iron enamel, steel enamel), application (e.g., appliances, architectural, industrial), and region (e.g., North America, Europe, Asia Pacific). Each segment's growth trajectory, market size, and competitive dynamics are meticulously analyzed to offer a granular understanding of the market. Growth projections for each segment are detailed within the report, providing valuable insight into the evolving market landscape.
Key Drivers of Vitreous Enamel Growth
Several key factors propel the growth of the vitreous enamel market. Technological advancements in enamel formulations, leading to improved durability and aesthetics, are a primary driver. The rising demand for sustainable and eco-friendly products pushes manufacturers to develop environmentally conscious enamel solutions. Furthermore, robust growth in the construction and appliance industries fuels the demand for vitreous enamel-coated products.
Challenges in the Vitreous Enamel Sector
The vitreous enamel industry faces several challenges. Fluctuating raw material prices and supply chain disruptions can impact production costs and profitability. Stringent environmental regulations necessitate the adoption of sustainable manufacturing practices, adding to operational expenses. Competition from alternative coating technologies also presents a challenge to market growth. The report quantifies the impact of these challenges on the market.
Emerging Opportunities in Vitreous Enamel
Several emerging opportunities exist within the vitreous enamel market. The increasing demand for energy-efficient appliances presents a significant growth opportunity. Advancements in nanotechnology and other emerging technologies can further enhance the properties of vitreous enamel, opening up new applications. Expansion into new and developing markets represents another avenue for growth.
Leading Players in the Vitreous Enamel Market
- Vibrantz Technologies
- Capron Manufacturing
- AkCoat (Akkim)
- Pemco International
- Tomatec Co., Ltd.
- Nolifrit
- Colorobbia Group
- A.O. Smith Corporation
- Archer Wire
- Cherokee Porcelain
- Roesch Inc.
- RIESS-KELOmat
- Capricorn
- AJ Wells
- Hunan Xinnuo Technology
Key Developments in Vitreous Enamel Industry
- 2022-Q4: Vibrantz Technologies launched a new line of eco-friendly vitreous enamels.
- 2023-Q1: AkCoat (Akkim) acquired a smaller enamel producer, expanding its market share.
- 2023-Q3: Pemco International invested in R&D to improve the durability of its enamel products.
- [Further details on key developments will be available in the full report.]
Strategic Outlook for Vitreous Enamel Market
The vitreous enamel market is poised for continued growth, driven by technological advancements, increasing demand across various sectors, and the adoption of sustainable manufacturing practices. The market’s future success hinges on innovation, strategic partnerships, and a focus on sustainability. Companies that embrace technological advancements and cater to evolving consumer preferences are expected to thrive in this dynamic market.
Vitreous Enamel Segmentation
-
1. Application
- 1.1. Pot, Pan, Baking Dish and Other Utensils
- 1.2. Stove, Oven & Cooker
- 1.3. Sanitaryware and Plumbing
- 1.4. Water Heater
- 1.5. Room Heater
- 1.6. Others
-
2. Type
- 2.1. Powder
- 2.2. Liquid
Vitreous Enamel Segmentation By Geography
-
1. North America
- 1.1. United States
- 1.2. Canada
- 1.3. Mexico
-
2. South America
- 2.1. Brazil
- 2.2. Argentina
- 2.3. Rest of South America
-
3. Europe
- 3.1. United Kingdom
- 3.2. Germany
- 3.3. France
- 3.4. Italy
- 3.5. Spain
- 3.6. Russia
- 3.7. Benelux
- 3.8. Nordics
- 3.9. Rest of Europe
-
4. Middle East & Africa
- 4.1. Turkey
- 4.2. Israel
- 4.3. GCC
- 4.4. North Africa
- 4.5. South Africa
- 4.6. Rest of Middle East & Africa
-
5. Asia Pacific
- 5.1. China
- 5.2. India
- 5.3. Japan
- 5.4. South Korea
- 5.5. ASEAN
- 5.6. Oceania
- 5.7. Rest of Asia Pacific

Vitreous Enamel Regional Market Share
Geographic Coverage of Vitreous Enamel
Vitreous Enamel REPORT HIGHLIGHTS
| Aspects | Details |
|---|---|
| Study Period | 2020-2034 |
| Base Year | 2025 |
| Estimated Year | 2026 |
| Forecast Period | 2026-2034 |
| Historical Period | 2020-2025 |
| Growth Rate | CAGR of 15.91% from 2020-2034 |
| Segmentation |
|
Table of Contents
- 1. Introduction
- 1.1. Research Scope
- 1.2. Market Segmentation
- 1.3. Research Objective
- 1.4. Definitions and Assumptions
- 2. Executive Summary
- 2.1. Market Snapshot
- 3. Market Dynamics
- 3.1. Market Drivers
- 3.2. Market Restrains
- 3.3. Market Trends
- 3.4. Market Opportunities
- 4. Market Factor Analysis
- 4.1. Porters Five Forces
- 4.1.1. Bargaining Power of Suppliers
- 4.1.2. Bargaining Power of Buyers
- 4.1.3. Threat of New Entrants
- 4.1.4. Threat of Substitutes
- 4.1.5. Competitive Rivalry
- 4.2. PESTEL analysis
- 4.3. BCG Analysis
- 4.3.1. Stars (High Growth, High Market Share)
- 4.3.2. Cash Cows (Low Growth, High Market Share)
- 4.3.3. Question Mark (High Growth, Low Market Share)
- 4.3.4. Dogs (Low Growth, Low Market Share)
- 4.4. Ansoff Matrix Analysis
- 4.5. Supply Chain Analysis
- 4.6. Regulatory Landscape
- 4.7. Current Market Potential and Opportunity Assessment (TAM–SAM–SOM Framework)
- 4.8. RAX Analyst Note
- 4.1. Porters Five Forces
- 5. Market Analysis, Insights and Forecast 2021-2033
- 5.1. Market Analysis, Insights and Forecast - by Application
- 5.1.1. Pot, Pan, Baking Dish and Other Utensils
- 5.1.2. Stove, Oven & Cooker
- 5.1.3. Sanitaryware and Plumbing
- 5.1.4. Water Heater
- 5.1.5. Room Heater
- 5.1.6. Others
- 5.2. Market Analysis, Insights and Forecast - by Type
- 5.2.1. Powder
- 5.2.2. Liquid
- 5.3. Market Analysis, Insights and Forecast - by Region
- 5.3.1. North America
- 5.3.2. South America
- 5.3.3. Europe
- 5.3.4. Middle East & Africa
- 5.3.5. Asia Pacific
- 5.1. Market Analysis, Insights and Forecast - by Application
- 6. Global Vitreous Enamel Analysis, Insights and Forecast, 2021-2033
- 6.1. Market Analysis, Insights and Forecast - by Application
- 6.1.1. Pot, Pan, Baking Dish and Other Utensils
- 6.1.2. Stove, Oven & Cooker
- 6.1.3. Sanitaryware and Plumbing
- 6.1.4. Water Heater
- 6.1.5. Room Heater
- 6.1.6. Others
- 6.2. Market Analysis, Insights and Forecast - by Type
- 6.2.1. Powder
- 6.2.2. Liquid
- 6.1. Market Analysis, Insights and Forecast - by Application
- 7. North America Vitreous Enamel Analysis, Insights and Forecast, 2020-2032
- 7.1. Market Analysis, Insights and Forecast - by Application
- 7.1.1. Pot, Pan, Baking Dish and Other Utensils
- 7.1.2. Stove, Oven & Cooker
- 7.1.3. Sanitaryware and Plumbing
- 7.1.4. Water Heater
- 7.1.5. Room Heater
- 7.1.6. Others
- 7.2. Market Analysis, Insights and Forecast - by Type
- 7.2.1. Powder
- 7.2.2. Liquid
- 7.1. Market Analysis, Insights and Forecast - by Application
- 8. South America Vitreous Enamel Analysis, Insights and Forecast, 2020-2032
- 8.1. Market Analysis, Insights and Forecast - by Application
- 8.1.1. Pot, Pan, Baking Dish and Other Utensils
- 8.1.2. Stove, Oven & Cooker
- 8.1.3. Sanitaryware and Plumbing
- 8.1.4. Water Heater
- 8.1.5. Room Heater
- 8.1.6. Others
- 8.2. Market Analysis, Insights and Forecast - by Type
- 8.2.1. Powder
- 8.2.2. Liquid
- 8.1. Market Analysis, Insights and Forecast - by Application
- 9. Europe Vitreous Enamel Analysis, Insights and Forecast, 2020-2032
- 9.1. Market Analysis, Insights and Forecast - by Application
- 9.1.1. Pot, Pan, Baking Dish and Other Utensils
- 9.1.2. Stove, Oven & Cooker
- 9.1.3. Sanitaryware and Plumbing
- 9.1.4. Water Heater
- 9.1.5. Room Heater
- 9.1.6. Others
- 9.2. Market Analysis, Insights and Forecast - by Type
- 9.2.1. Powder
- 9.2.2. Liquid
- 9.1. Market Analysis, Insights and Forecast - by Application
- 10. Middle East & Africa Vitreous Enamel Analysis, Insights and Forecast, 2020-2032
- 10.1. Market Analysis, Insights and Forecast - by Application
- 10.1.1. Pot, Pan, Baking Dish and Other Utensils
- 10.1.2. Stove, Oven & Cooker
- 10.1.3. Sanitaryware and Plumbing
- 10.1.4. Water Heater
- 10.1.5. Room Heater
- 10.1.6. Others
- 10.2. Market Analysis, Insights and Forecast - by Type
- 10.2.1. Powder
- 10.2.2. Liquid
- 10.1. Market Analysis, Insights and Forecast - by Application
- 11. Asia Pacific Vitreous Enamel Analysis, Insights and Forecast, 2020-2032
- 11.1. Market Analysis, Insights and Forecast - by Application
- 11.1.1. Pot, Pan, Baking Dish and Other Utensils
- 11.1.2. Stove, Oven & Cooker
- 11.1.3. Sanitaryware and Plumbing
- 11.1.4. Water Heater
- 11.1.5. Room Heater
- 11.1.6. Others
- 11.2. Market Analysis, Insights and Forecast - by Type
- 11.2.1. Powder
- 11.2.2. Liquid
- 11.1. Market Analysis, Insights and Forecast - by Application
- 12. Competitive Analysis
- 12.1. Company Profiles
- 12.1.1 Vibrantz Technologies
- 12.1.1.1. Company Overview
- 12.1.1.2. Products
- 12.1.1.3. Company Financials
- 12.1.1.4. SWOT Analysis
- 12.1.2 Capron Manufacturing
- 12.1.2.1. Company Overview
- 12.1.2.2. Products
- 12.1.2.3. Company Financials
- 12.1.2.4. SWOT Analysis
- 12.1.3 AkCoat (Akkim)
- 12.1.3.1. Company Overview
- 12.1.3.2. Products
- 12.1.3.3. Company Financials
- 12.1.3.4. SWOT Analysis
- 12.1.4 Pemco International
- 12.1.4.1. Company Overview
- 12.1.4.2. Products
- 12.1.4.3. Company Financials
- 12.1.4.4. SWOT Analysis
- 12.1.5 Tomatec Co. Ltd.
- 12.1.5.1. Company Overview
- 12.1.5.2. Products
- 12.1.5.3. Company Financials
- 12.1.5.4. SWOT Analysis
- 12.1.6 Nolifrit
- 12.1.6.1. Company Overview
- 12.1.6.2. Products
- 12.1.6.3. Company Financials
- 12.1.6.4. SWOT Analysis
- 12.1.7 Colorobbia Group
- 12.1.7.1. Company Overview
- 12.1.7.2. Products
- 12.1.7.3. Company Financials
- 12.1.7.4. SWOT Analysis
- 12.1.8 A.O. Smith Corporation
- 12.1.8.1. Company Overview
- 12.1.8.2. Products
- 12.1.8.3. Company Financials
- 12.1.8.4. SWOT Analysis
- 12.1.9 Archer Wire
- 12.1.9.1. Company Overview
- 12.1.9.2. Products
- 12.1.9.3. Company Financials
- 12.1.9.4. SWOT Analysis
- 12.1.10 Cherokee Porcelain
- 12.1.10.1. Company Overview
- 12.1.10.2. Products
- 12.1.10.3. Company Financials
- 12.1.10.4. SWOT Analysis
- 12.1.11 Roesch Inc.
- 12.1.11.1. Company Overview
- 12.1.11.2. Products
- 12.1.11.3. Company Financials
- 12.1.11.4. SWOT Analysis
- 12.1.12 RIESS-KELOmat
- 12.1.12.1. Company Overview
- 12.1.12.2. Products
- 12.1.12.3. Company Financials
- 12.1.12.4. SWOT Analysis
- 12.1.13 Capricorn
- 12.1.13.1. Company Overview
- 12.1.13.2. Products
- 12.1.13.3. Company Financials
- 12.1.13.4. SWOT Analysis
- 12.1.14 AJ Wells
- 12.1.14.1. Company Overview
- 12.1.14.2. Products
- 12.1.14.3. Company Financials
- 12.1.14.4. SWOT Analysis
- 12.1.15 Hunan Xinnuo Technology
- 12.1.15.1. Company Overview
- 12.1.15.2. Products
- 12.1.15.3. Company Financials
- 12.1.15.4. SWOT Analysis
- 12.1.1 Vibrantz Technologies
- 12.2. Market Entropy
- 12.2.1 Company's Key Areas Served
- 12.2.2 Recent Developments
- 12.3. Company Market Share Analysis 2025
- 12.3.1 Top 5 Companies Market Share Analysis
- 12.3.2 Top 3 Companies Market Share Analysis
- 12.4. List of Potential Customers
- 13. Research Methodology
List of Figures
- Figure 1: Global Vitreous Enamel Revenue Breakdown (billion, %) by Region 2025 & 2033
- Figure 2: Global Vitreous Enamel Volume Breakdown (K, %) by Region 2025 & 2033
- Figure 3: North America Vitreous Enamel Revenue (billion), by Application 2025 & 2033
- Figure 4: North America Vitreous Enamel Volume (K), by Application 2025 & 2033
- Figure 5: North America Vitreous Enamel Revenue Share (%), by Application 2025 & 2033
- Figure 6: North America Vitreous Enamel Volume Share (%), by Application 2025 & 2033
- Figure 7: North America Vitreous Enamel Revenue (billion), by Type 2025 & 2033
- Figure 8: North America Vitreous Enamel Volume (K), by Type 2025 & 2033
- Figure 9: North America Vitreous Enamel Revenue Share (%), by Type 2025 & 2033
- Figure 10: North America Vitreous Enamel Volume Share (%), by Type 2025 & 2033
- Figure 11: North America Vitreous Enamel Revenue (billion), by Country 2025 & 2033
- Figure 12: North America Vitreous Enamel Volume (K), by Country 2025 & 2033
- Figure 13: North America Vitreous Enamel Revenue Share (%), by Country 2025 & 2033
- Figure 14: North America Vitreous Enamel Volume Share (%), by Country 2025 & 2033
- Figure 15: South America Vitreous Enamel Revenue (billion), by Application 2025 & 2033
- Figure 16: South America Vitreous Enamel Volume (K), by Application 2025 & 2033
- Figure 17: South America Vitreous Enamel Revenue Share (%), by Application 2025 & 2033
- Figure 18: South America Vitreous Enamel Volume Share (%), by Application 2025 & 2033
- Figure 19: South America Vitreous Enamel Revenue (billion), by Type 2025 & 2033
- Figure 20: South America Vitreous Enamel Volume (K), by Type 2025 & 2033
- Figure 21: South America Vitreous Enamel Revenue Share (%), by Type 2025 & 2033
- Figure 22: South America Vitreous Enamel Volume Share (%), by Type 2025 & 2033
- Figure 23: South America Vitreous Enamel Revenue (billion), by Country 2025 & 2033
- Figure 24: South America Vitreous Enamel Volume (K), by Country 2025 & 2033
- Figure 25: South America Vitreous Enamel Revenue Share (%), by Country 2025 & 2033
- Figure 26: South America Vitreous Enamel Volume Share (%), by Country 2025 & 2033
- Figure 27: Europe Vitreous Enamel Revenue (billion), by Application 2025 & 2033
- Figure 28: Europe Vitreous Enamel Volume (K), by Application 2025 & 2033
- Figure 29: Europe Vitreous Enamel Revenue Share (%), by Application 2025 & 2033
- Figure 30: Europe Vitreous Enamel Volume Share (%), by Application 2025 & 2033
- Figure 31: Europe Vitreous Enamel Revenue (billion), by Type 2025 & 2033
- Figure 32: Europe Vitreous Enamel Volume (K), by Type 2025 & 2033
- Figure 33: Europe Vitreous Enamel Revenue Share (%), by Type 2025 & 2033
- Figure 34: Europe Vitreous Enamel Volume Share (%), by Type 2025 & 2033
- Figure 35: Europe Vitreous Enamel Revenue (billion), by Country 2025 & 2033
- Figure 36: Europe Vitreous Enamel Volume (K), by Country 2025 & 2033
- Figure 37: Europe Vitreous Enamel Revenue Share (%), by Country 2025 & 2033
- Figure 38: Europe Vitreous Enamel Volume Share (%), by Country 2025 & 2033
- Figure 39: Middle East & Africa Vitreous Enamel Revenue (billion), by Application 2025 & 2033
- Figure 40: Middle East & Africa Vitreous Enamel Volume (K), by Application 2025 & 2033
- Figure 41: Middle East & Africa Vitreous Enamel Revenue Share (%), by Application 2025 & 2033
- Figure 42: Middle East & Africa Vitreous Enamel Volume Share (%), by Application 2025 & 2033
- Figure 43: Middle East & Africa Vitreous Enamel Revenue (billion), by Type 2025 & 2033
- Figure 44: Middle East & Africa Vitreous Enamel Volume (K), by Type 2025 & 2033
- Figure 45: Middle East & Africa Vitreous Enamel Revenue Share (%), by Type 2025 & 2033
- Figure 46: Middle East & Africa Vitreous Enamel Volume Share (%), by Type 2025 & 2033
- Figure 47: Middle East & Africa Vitreous Enamel Revenue (billion), by Country 2025 & 2033
- Figure 48: Middle East & Africa Vitreous Enamel Volume (K), by Country 2025 & 2033
- Figure 49: Middle East & Africa Vitreous Enamel Revenue Share (%), by Country 2025 & 2033
- Figure 50: Middle East & Africa Vitreous Enamel Volume Share (%), by Country 2025 & 2033
- Figure 51: Asia Pacific Vitreous Enamel Revenue (billion), by Application 2025 & 2033
- Figure 52: Asia Pacific Vitreous Enamel Volume (K), by Application 2025 & 2033
- Figure 53: Asia Pacific Vitreous Enamel Revenue Share (%), by Application 2025 & 2033
- Figure 54: Asia Pacific Vitreous Enamel Volume Share (%), by Application 2025 & 2033
- Figure 55: Asia Pacific Vitreous Enamel Revenue (billion), by Type 2025 & 2033
- Figure 56: Asia Pacific Vitreous Enamel Volume (K), by Type 2025 & 2033
- Figure 57: Asia Pacific Vitreous Enamel Revenue Share (%), by Type 2025 & 2033
- Figure 58: Asia Pacific Vitreous Enamel Volume Share (%), by Type 2025 & 2033
- Figure 59: Asia Pacific Vitreous Enamel Revenue (billion), by Country 2025 & 2033
- Figure 60: Asia Pacific Vitreous Enamel Volume (K), by Country 2025 & 2033
- Figure 61: Asia Pacific Vitreous Enamel Revenue Share (%), by Country 2025 & 2033
- Figure 62: Asia Pacific Vitreous Enamel Volume Share (%), by Country 2025 & 2033
List of Tables
- Table 1: Global Vitreous Enamel Revenue billion Forecast, by Application 2020 & 2033
- Table 2: Global Vitreous Enamel Volume K Forecast, by Application 2020 & 2033
- Table 3: Global Vitreous Enamel Revenue billion Forecast, by Type 2020 & 2033
- Table 4: Global Vitreous Enamel Volume K Forecast, by Type 2020 & 2033
- Table 5: Global Vitreous Enamel Revenue billion Forecast, by Region 2020 & 2033
- Table 6: Global Vitreous Enamel Volume K Forecast, by Region 2020 & 2033
- Table 7: Global Vitreous Enamel Revenue billion Forecast, by Application 2020 & 2033
- Table 8: Global Vitreous Enamel Volume K Forecast, by Application 2020 & 2033
- Table 9: Global Vitreous Enamel Revenue billion Forecast, by Type 2020 & 2033
- Table 10: Global Vitreous Enamel Volume K Forecast, by Type 2020 & 2033
- Table 11: Global Vitreous Enamel Revenue billion Forecast, by Country 2020 & 2033
- Table 12: Global Vitreous Enamel Volume K Forecast, by Country 2020 & 2033
- Table 13: United States Vitreous Enamel Revenue (billion) Forecast, by Application 2020 & 2033
- Table 14: United States Vitreous Enamel Volume (K) Forecast, by Application 2020 & 2033
- Table 15: Canada Vitreous Enamel Revenue (billion) Forecast, by Application 2020 & 2033
- Table 16: Canada Vitreous Enamel Volume (K) Forecast, by Application 2020 & 2033
- Table 17: Mexico Vitreous Enamel Revenue (billion) Forecast, by Application 2020 & 2033
- Table 18: Mexico Vitreous Enamel Volume (K) Forecast, by Application 2020 & 2033
- Table 19: Global Vitreous Enamel Revenue billion Forecast, by Application 2020 & 2033
- Table 20: Global Vitreous Enamel Volume K Forecast, by Application 2020 & 2033
- Table 21: Global Vitreous Enamel Revenue billion Forecast, by Type 2020 & 2033
- Table 22: Global Vitreous Enamel Volume K Forecast, by Type 2020 & 2033
- Table 23: Global Vitreous Enamel Revenue billion Forecast, by Country 2020 & 2033
- Table 24: Global Vitreous Enamel Volume K Forecast, by Country 2020 & 2033
- Table 25: Brazil Vitreous Enamel Revenue (billion) Forecast, by Application 2020 & 2033
- Table 26: Brazil Vitreous Enamel Volume (K) Forecast, by Application 2020 & 2033
- Table 27: Argentina Vitreous Enamel Revenue (billion) Forecast, by Application 2020 & 2033
- Table 28: Argentina Vitreous Enamel Volume (K) Forecast, by Application 2020 & 2033
- Table 29: Rest of South America Vitreous Enamel Revenue (billion) Forecast, by Application 2020 & 2033
- Table 30: Rest of South America Vitreous Enamel Volume (K) Forecast, by Application 2020 & 2033
- Table 31: Global Vitreous Enamel Revenue billion Forecast, by Application 2020 & 2033
- Table 32: Global Vitreous Enamel Volume K Forecast, by Application 2020 & 2033
- Table 33: Global Vitreous Enamel Revenue billion Forecast, by Type 2020 & 2033
- Table 34: Global Vitreous Enamel Volume K Forecast, by Type 2020 & 2033
- Table 35: Global Vitreous Enamel Revenue billion Forecast, by Country 2020 & 2033
- Table 36: Global Vitreous Enamel Volume K Forecast, by Country 2020 & 2033
- Table 37: United Kingdom Vitreous Enamel Revenue (billion) Forecast, by Application 2020 & 2033
- Table 38: United Kingdom Vitreous Enamel Volume (K) Forecast, by Application 2020 & 2033
- Table 39: Germany Vitreous Enamel Revenue (billion) Forecast, by Application 2020 & 2033
- Table 40: Germany Vitreous Enamel Volume (K) Forecast, by Application 2020 & 2033
- Table 41: France Vitreous Enamel Revenue (billion) Forecast, by Application 2020 & 2033
- Table 42: France Vitreous Enamel Volume (K) Forecast, by Application 2020 & 2033
- Table 43: Italy Vitreous Enamel Revenue (billion) Forecast, by Application 2020 & 2033
- Table 44: Italy Vitreous Enamel Volume (K) Forecast, by Application 2020 & 2033
- Table 45: Spain Vitreous Enamel Revenue (billion) Forecast, by Application 2020 & 2033
- Table 46: Spain Vitreous Enamel Volume (K) Forecast, by Application 2020 & 2033
- Table 47: Russia Vitreous Enamel Revenue (billion) Forecast, by Application 2020 & 2033
- Table 48: Russia Vitreous Enamel Volume (K) Forecast, by Application 2020 & 2033
- Table 49: Benelux Vitreous Enamel Revenue (billion) Forecast, by Application 2020 & 2033
- Table 50: Benelux Vitreous Enamel Volume (K) Forecast, by Application 2020 & 2033
- Table 51: Nordics Vitreous Enamel Revenue (billion) Forecast, by Application 2020 & 2033
- Table 52: Nordics Vitreous Enamel Volume (K) Forecast, by Application 2020 & 2033
- Table 53: Rest of Europe Vitreous Enamel Revenue (billion) Forecast, by Application 2020 & 2033
- Table 54: Rest of Europe Vitreous Enamel Volume (K) Forecast, by Application 2020 & 2033
- Table 55: Global Vitreous Enamel Revenue billion Forecast, by Application 2020 & 2033
- Table 56: Global Vitreous Enamel Volume K Forecast, by Application 2020 & 2033
- Table 57: Global Vitreous Enamel Revenue billion Forecast, by Type 2020 & 2033
- Table 58: Global Vitreous Enamel Volume K Forecast, by Type 2020 & 2033
- Table 59: Global Vitreous Enamel Revenue billion Forecast, by Country 2020 & 2033
- Table 60: Global Vitreous Enamel Volume K Forecast, by Country 2020 & 2033
- Table 61: Turkey Vitreous Enamel Revenue (billion) Forecast, by Application 2020 & 2033
- Table 62: Turkey Vitreous Enamel Volume (K) Forecast, by Application 2020 & 2033
- Table 63: Israel Vitreous Enamel Revenue (billion) Forecast, by Application 2020 & 2033
- Table 64: Israel Vitreous Enamel Volume (K) Forecast, by Application 2020 & 2033
- Table 65: GCC Vitreous Enamel Revenue (billion) Forecast, by Application 2020 & 2033
- Table 66: GCC Vitreous Enamel Volume (K) Forecast, by Application 2020 & 2033
- Table 67: North Africa Vitreous Enamel Revenue (billion) Forecast, by Application 2020 & 2033
- Table 68: North Africa Vitreous Enamel Volume (K) Forecast, by Application 2020 & 2033
- Table 69: South Africa Vitreous Enamel Revenue (billion) Forecast, by Application 2020 & 2033
- Table 70: South Africa Vitreous Enamel Volume (K) Forecast, by Application 2020 & 2033
- Table 71: Rest of Middle East & Africa Vitreous Enamel Revenue (billion) Forecast, by Application 2020 & 2033
- Table 72: Rest of Middle East & Africa Vitreous Enamel Volume (K) Forecast, by Application 2020 & 2033
- Table 73: Global Vitreous Enamel Revenue billion Forecast, by Application 2020 & 2033
- Table 74: Global Vitreous Enamel Volume K Forecast, by Application 2020 & 2033
- Table 75: Global Vitreous Enamel Revenue billion Forecast, by Type 2020 & 2033
- Table 76: Global Vitreous Enamel Volume K Forecast, by Type 2020 & 2033
- Table 77: Global Vitreous Enamel Revenue billion Forecast, by Country 2020 & 2033
- Table 78: Global Vitreous Enamel Volume K Forecast, by Country 2020 & 2033
- Table 79: China Vitreous Enamel Revenue (billion) Forecast, by Application 2020 & 2033
- Table 80: China Vitreous Enamel Volume (K) Forecast, by Application 2020 & 2033
- Table 81: India Vitreous Enamel Revenue (billion) Forecast, by Application 2020 & 2033
- Table 82: India Vitreous Enamel Volume (K) Forecast, by Application 2020 & 2033
- Table 83: Japan Vitreous Enamel Revenue (billion) Forecast, by Application 2020 & 2033
- Table 84: Japan Vitreous Enamel Volume (K) Forecast, by Application 2020 & 2033
- Table 85: South Korea Vitreous Enamel Revenue (billion) Forecast, by Application 2020 & 2033
- Table 86: South Korea Vitreous Enamel Volume (K) Forecast, by Application 2020 & 2033
- Table 87: ASEAN Vitreous Enamel Revenue (billion) Forecast, by Application 2020 & 2033
- Table 88: ASEAN Vitreous Enamel Volume (K) Forecast, by Application 2020 & 2033
- Table 89: Oceania Vitreous Enamel Revenue (billion) Forecast, by Application 2020 & 2033
- Table 90: Oceania Vitreous Enamel Volume (K) Forecast, by Application 2020 & 2033
- Table 91: Rest of Asia Pacific Vitreous Enamel Revenue (billion) Forecast, by Application 2020 & 2033
- Table 92: Rest of Asia Pacific Vitreous Enamel Volume (K) Forecast, by Application 2020 & 2033
Frequently Asked Questions
1. What is the projected Compound Annual Growth Rate (CAGR) of the Vitreous Enamel?
The projected CAGR is approximately 15.91%.
2. Which companies are prominent players in the Vitreous Enamel?
Key companies in the market include Vibrantz Technologies, Capron Manufacturing, AkCoat (Akkim), Pemco International, Tomatec Co., Ltd., Nolifrit, Colorobbia Group, A.O. Smith Corporation, Archer Wire, Cherokee Porcelain, Roesch Inc., RIESS-KELOmat, Capricorn, AJ Wells, Hunan Xinnuo Technology.
3. What are the main segments of the Vitreous Enamel?
The market segments include Application, Type.
4. Can you provide details about the market size?
The market size is estimated to be USD 6.7 billion as of 2022.
5. What are some drivers contributing to market growth?
N/A
6. What are the notable trends driving market growth?
N/A
7. Are there any restraints impacting market growth?
N/A
8. Can you provide examples of recent developments in the market?
N/A
9. What pricing options are available for accessing the report?
Pricing options include single-user, multi-user, and enterprise licenses priced at USD 3950.00, USD 5925.00, and USD 7900.00 respectively.
10. Is the market size provided in terms of value or volume?
The market size is provided in terms of value, measured in billion and volume, measured in K.
11. Are there any specific market keywords associated with the report?
Yes, the market keyword associated with the report is "Vitreous Enamel," which aids in identifying and referencing the specific market segment covered.
12. How do I determine which pricing option suits my needs best?
The pricing options vary based on user requirements and access needs. Individual users may opt for single-user licenses, while businesses requiring broader access may choose multi-user or enterprise licenses for cost-effective access to the report.
13. Are there any additional resources or data provided in the Vitreous Enamel report?
While the report offers comprehensive insights, it's advisable to review the specific contents or supplementary materials provided to ascertain if additional resources or data are available.
14. How can I stay updated on further developments or reports in the Vitreous Enamel?
To stay informed about further developments, trends, and reports in the Vitreous Enamel, consider subscribing to industry newsletters, following relevant companies and organizations, or regularly checking reputable industry news sources and publications.
Methodology
Step 1 - Identification of Relevant Samples Size from Population Database


Step 2 - Approaches for Defining Global Market Size (Value, Volume* & Price*)

Note*: In applicable scenarios
Step 3 - Data Sources
Primary Research
- Web Analytics
- Survey Reports
- Research Institute
- Latest Research Reports
- Opinion Leaders
Secondary Research
- Annual Reports
- White Paper
- Latest Press Release
- Industry Association
- Paid Database
- Investor Presentations

Step 4 - Data Triangulation
Involves using different sources of information in order to increase the validity of a study
These sources are likely to be stakeholders in a program - participants, other researchers, program staff, other community members, and so on.
Then we put all data in single framework & apply various statistical tools to find out the dynamic on the market.
During the analysis stage, feedback from the stakeholder groups would be compared to determine areas of agreement as well as areas of divergence

