
Key Insights
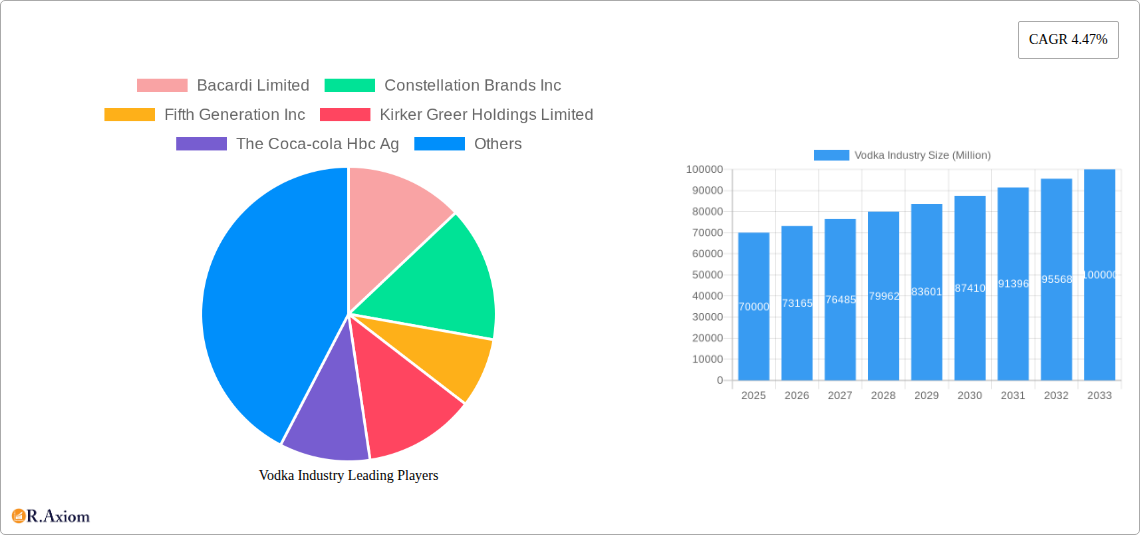
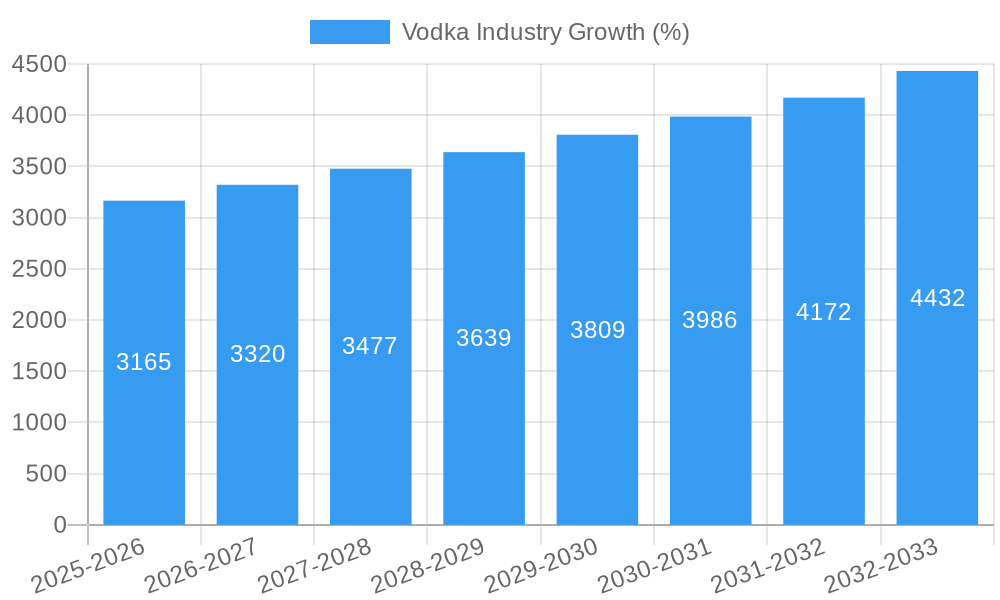
The global vodka market, valued at approximately $XX million in 2025, is projected to experience robust growth, exhibiting a compound annual growth rate (CAGR) of 4.47% from 2025 to 2033. This expansion is fueled by several key drivers. The rising popularity of vodka-based cocktails and mixed drinks, particularly among younger demographics, significantly contributes to market growth. Premiumization trends, with consumers increasingly opting for higher-quality, super-premium vodkas, further boost market value. Geographic expansion into emerging markets, particularly in Asia-Pacific, presents significant untapped potential. The increasing disposable incomes in these regions, coupled with a growing preference for Western alcoholic beverages, are driving consumption. However, the market also faces certain restraints. Health concerns surrounding excessive alcohol consumption, coupled with growing awareness of its health impacts, could potentially curb growth. Furthermore, fluctuating raw material prices and stringent regulations in certain regions can impact profitability and market expansion. The market is segmented by distribution channel (on-trade and off-trade), type (flavored and non-flavored), and category (mass, premium, and super-premium). Major players like Bacardi, Constellation Brands, Diageo, and Pernod Ricard dominate the market, leveraging strong brand recognition and extensive distribution networks. Regional analysis shows a strong presence in North America and Europe, but significant growth opportunities exist within the Asia-Pacific region.
The projected growth trajectory suggests continued market expansion throughout the forecast period. Premiumization trends are expected to continue, with an increased emphasis on craft vodkas and unique flavor profiles. Marketing and branding initiatives targeting specific demographic segments will play a pivotal role in shaping market dynamics. The on-trade segment (bars and restaurants) is expected to show moderate growth, while the off-trade segment (retail stores) is likely to experience stronger growth due to increased accessibility and convenience. The flavored vodka segment is expected to outpace the non-flavored segment driven by consumer demand for unique taste experiences. Companies are investing heavily in innovation, developing new flavor combinations and product variations to maintain market competitiveness. A focus on sustainability and ethical sourcing of ingredients is also gaining momentum, aligning with growing consumer preferences. The long-term outlook remains positive, with the vodka market poised for continued expansion driven by the factors mentioned above.
This comprehensive report provides a detailed analysis of the global vodka industry, covering market size, segmentation, competitive landscape, and future growth prospects from 2019 to 2033. The report utilizes data from the historical period (2019-2024), the base year (2025), and the estimated year (2025) to forecast market trends up to 2033. Key players like Bacardi Limited, Constellation Brands Inc., Diageo PLC, and Pernod Ricard are analyzed, along with emerging trends and opportunities. This report is essential for industry stakeholders, investors, and market researchers seeking actionable insights into this dynamic market.
Vodka Industry Market Concentration & Innovation
The global vodka market exhibits a moderately concentrated structure, with a few major players holding significant market share. However, the presence of numerous smaller, regional brands creates a competitive landscape. Constellation Brands and Diageo, for example, hold substantial shares, while other players like Bacardi and Pernod Ricard command considerable influence in specific regions. The market share of the top five players in 2025 is estimated at xx%.
Innovation Drivers:
- Premiumization: Growing consumer demand for premium and super-premium vodka drives innovation in flavor profiles, packaging, and production methods.
- Flavored Vodka Expansion: The flavored vodka segment exhibits significant growth, leading to continuous innovation in unique flavor combinations and natural ingredients.
- Ready-to-Drink (RTD) Cocktails: The increasing popularity of pre-mixed vodka cocktails is driving innovation in convenient packaging and unique flavor combinations.
Regulatory Frameworks: Government regulations regarding alcohol content, labeling, and marketing significantly impact industry dynamics. These regulations vary across countries, necessitating adaptation and compliance strategies for players.
Product Substitutes: The vodka market faces competition from other alcoholic beverages like gin, whiskey, and tequila. The increasing popularity of non-alcoholic beverages also presents a challenge.
End-User Trends: Health-conscious consumers are driving demand for low-calorie and low-sugar vodka options. Sustainability concerns are also shaping consumer preferences, favoring brands with environmentally friendly practices.
M&A Activities: The vodka industry has witnessed several mergers and acquisitions in recent years, primarily driven by expansion strategies and portfolio diversification. The total value of M&A deals in the past five years is estimated at $xx Million.
Vodka Industry Industry Trends & Insights
The global vodka market is experiencing robust growth, driven by increasing disposable incomes, changing consumer preferences, and expanding distribution channels. The market is expected to witness a Compound Annual Growth Rate (CAGR) of xx% during the forecast period (2025-2033). Market penetration is increasing in emerging economies, particularly in Asia and Africa.
Technological advancements in production and distribution methods are enhancing efficiency and reducing costs. The rise of e-commerce and online alcohol delivery platforms is expanding the market reach and providing new avenues for sales growth.
Consumer preferences are evolving toward premiumization, flavored vodkas, and ready-to-drink cocktails. The demand for organic and sustainable vodka options is growing, driving innovation in production methods and ingredient sourcing. Competitive dynamics are intense, with major players constantly vying for market share through product launches, brand building, and strategic partnerships. The growing popularity of craft vodka brands is posing a challenge to established players, who are adapting by launching their own craft-inspired offerings.
Dominant Markets & Segments in Vodka Industry
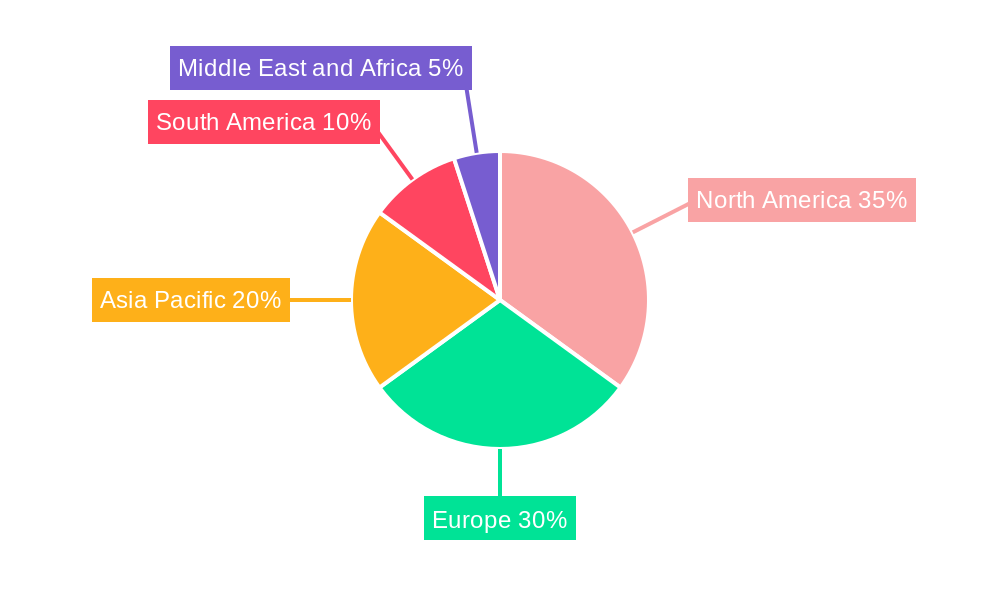
The United States remains the largest market for vodka globally, driven by high consumption rates and a strong preference for premium and super-premium brands. The off-trade channel (retail sales) holds a larger share compared to the on-trade channel (restaurants and bars) due to its wider reach and convenience.
Key Drivers of US Market Dominance:
- Strong consumer spending power
- Well-established distribution networks
- High awareness and acceptance of vodka as a popular beverage
Segment Dominance:
- By Distribution Channel: Off-trade dominates due to widespread retail availability and convenience.
- By Type: Non-flavored vodka retains the largest market share, but flavored vodka exhibits faster growth.
- By Category: The premium and super-premium segments are experiencing the highest growth rates, driven by increased consumer spending on premium products.
Other Significant Markets: The European Union, Russia, and several Asian countries are also key markets for vodka, each characterized by unique cultural preferences and consumption patterns.
Vodka Industry Product Developments
Recent product innovations in the vodka industry focus on premiumization, unique flavor profiles, and convenience. Technological advancements in distillation and filtration processes are enhancing product quality and consistency. The rise of ready-to-drink (RTD) vodka cocktails reflects the increasing demand for convenient and ready-to-consume alcoholic beverages. These innovations cater to diverse consumer preferences and enhance the overall market appeal of vodka.
Report Scope & Segmentation Analysis
This report segments the vodka market by distribution channel (on-trade and off-trade), type (flavored and non-flavored), and category (mass, premium, and super-premium). Each segment is analyzed based on its historical performance, current market size, projected growth rate, and competitive landscape. Growth projections vary across segments, with flavored and premium/super-premium vodka segments exhibiting faster growth than their counterparts. The competitive dynamics within each segment vary depending on brand presence, marketing strategies, and product differentiation.
Key Drivers of Vodka Industry Growth
Several factors contribute to the vodka industry's growth: rising disposable incomes in emerging economies increase purchasing power. The growing popularity of ready-to-drink (RTD) cocktails and flavored vodkas caters to changing consumer preferences. Technological advancements enhance production efficiency and improve product quality. Favorable regulatory environments in certain regions facilitate market expansion.
Challenges in the Vodka Industry Sector
The vodka industry faces challenges such as stringent regulations on alcohol marketing and sales, increased competition from other alcoholic beverages, and fluctuations in raw material prices. Supply chain disruptions can impact production and distribution, increasing costs. Health concerns related to alcohol consumption may lead to a decline in demand in certain segments. Economic downturns may also impact consumer spending on premium alcoholic beverages.
Emerging Opportunities in Vodka Industry
Emerging opportunities exist in untapped markets, especially in developing economies. The growing demand for organic and sustainable vodka products creates opportunities for eco-friendly brands. Innovation in RTD cocktails and unique flavor profiles is crucial for attracting new consumers. Leveraging e-commerce platforms can expand market reach and enhance distribution efficiency.
Leading Players in the Vodka Industry Market
- Bacardi Limited
- Constellation Brands Inc
- Fifth Generation Inc
- Kirker Greer Holdings Limited
- The Coca-Cola HBC AG
- Luctor International
- Pernod Ricard
- LVMH Moët Hennessy Louis Vuitton (Belvedere Vodka)
- Becle SAB de CV
- Diageo PLC
Key Developments in Vodka Industry Industry
- February 2023: Diageo launched the Cherry Drop Smirnoff variety, a new flavored vodka with 37.5% ABV, expanding its portfolio and targeting new consumer segments.
- September 2022: Brown-Forman Corporation announced plans to distribute its brands, including Finlandia Vodka, in Slovakia from September 2023, expanding its geographical reach.
- August 2022: Constellation Brands launched 'Fresca Mixed,' a new line of premium, pre-mixed cocktails, including a vodka spritz, capitalizing on the growing RTD market.
Strategic Outlook for Vodka Industry Market
The vodka industry is poised for continued growth, driven by evolving consumer preferences, innovation in product offerings, and expansion into new markets. The premiumization trend, coupled with the growing popularity of flavored vodkas and RTD cocktails, presents significant opportunities for market expansion. Strategic partnerships, innovative marketing campaigns, and a focus on sustainability will be critical for success in this competitive market. The predicted CAGR for the forecast period remains strong, suggesting substantial growth potential for established and emerging players alike.
Vodka Industry Segmentation
-
1. Type
- 1.1. Flavored
- 1.2. Non-Flavored
-
2. Category
- 2.1. Mass
- 2.2. Premium
- 2.3. Super-Premium
-
3. Distribution Channel
- 3.1. On-Trade
-
3.2. Off-Trade
- 3.2.1. Supermarkets/Hypermarkets
- 3.2.2. Specialty Stores
- 3.2.3. Online Retailers
- 3.2.4. Other Distribution Channels
Vodka Industry Segmentation By Geography
-
1. North America
- 1.1. United States
- 1.2. Canada
- 1.3. Mexico
- 1.4. Rest of North America
-
2. Europe
- 2.1. Spain
- 2.2. United Kingdom
- 2.3. Germany
- 2.4. France
- 2.5. Italy
- 2.6. Russia
- 2.7. Rest of Europe
-
3. Asia Pacific
- 3.1. China
- 3.2. Japan
- 3.3. India
- 3.4. Australia
- 3.5. Taiwan
- 3.6. Singapore
- 3.7. South Korea
- 3.8. Rest of Asia Pacific
-
4. South America
- 4.1. Brazil
- 4.2. Argentina
- 4.3. Rest of South America
-
5. Middle East and Africa
- 5.1. United Arab Emirates
- 5.2. South Africa
- 5.3. Rest of Middle East and Africa
Vodka Industry REPORT HIGHLIGHTS
| Aspects | Details |
|---|---|
| Study Period | 2019-2033 |
| Base Year | 2024 |
| Estimated Year | 2025 |
| Forecast Period | 2025-2033 |
| Historical Period | 2019-2024 |
| Growth Rate | CAGR of 4.47% from 2019-2033 |
| Segmentation |
|
Table of Contents
- 1. Introduction
- 1.1. Research Scope
- 1.2. Market Segmentation
- 1.3. Research Methodology
- 1.4. Definitions and Assumptions
- 2. Executive Summary
- 2.1. Introduction
- 3. Market Dynamics
- 3.1. Introduction
- 3.2. Market Drivers
- 3.2.1. Demand for Premium and Super Premium Vodka; Effective Branding and Marketing by Players
- 3.3. Market Restrains
- 3.3.1. Stringent Regulations Pertaining to Vodka; Popularity of Non-alcoholic Beverages
- 3.4. Market Trends
- 3.4.1. Premiumization of Vodka
- 4. Market Factor Analysis
- 4.1. Porters Five Forces
- 4.2. Supply/Value Chain
- 4.3. PESTEL analysis
- 4.4. Market Entropy
- 4.5. Patent/Trademark Analysis
- 5. Global Vodka Industry Analysis, Insights and Forecast, 2019-2031
- 5.1. Market Analysis, Insights and Forecast - by Type
- 5.1.1. Flavored
- 5.1.2. Non-Flavored
- 5.2. Market Analysis, Insights and Forecast - by Category
- 5.2.1. Mass
- 5.2.2. Premium
- 5.2.3. Super-Premium
- 5.3. Market Analysis, Insights and Forecast - by Distribution Channel
- 5.3.1. On-Trade
- 5.3.2. Off-Trade
- 5.3.2.1. Supermarkets/Hypermarkets
- 5.3.2.2. Specialty Stores
- 5.3.2.3. Online Retailers
- 5.3.2.4. Other Distribution Channels
- 5.4. Market Analysis, Insights and Forecast - by Region
- 5.4.1. North America
- 5.4.2. Europe
- 5.4.3. Asia Pacific
- 5.4.4. South America
- 5.4.5. Middle East and Africa
- 5.1. Market Analysis, Insights and Forecast - by Type
- 6. North America Vodka Industry Analysis, Insights and Forecast, 2019-2031
- 6.1. Market Analysis, Insights and Forecast - by Type
- 6.1.1. Flavored
- 6.1.2. Non-Flavored
- 6.2. Market Analysis, Insights and Forecast - by Category
- 6.2.1. Mass
- 6.2.2. Premium
- 6.2.3. Super-Premium
- 6.3. Market Analysis, Insights and Forecast - by Distribution Channel
- 6.3.1. On-Trade
- 6.3.2. Off-Trade
- 6.3.2.1. Supermarkets/Hypermarkets
- 6.3.2.2. Specialty Stores
- 6.3.2.3. Online Retailers
- 6.3.2.4. Other Distribution Channels
- 6.1. Market Analysis, Insights and Forecast - by Type
- 7. Europe Vodka Industry Analysis, Insights and Forecast, 2019-2031
- 7.1. Market Analysis, Insights and Forecast - by Type
- 7.1.1. Flavored
- 7.1.2. Non-Flavored
- 7.2. Market Analysis, Insights and Forecast - by Category
- 7.2.1. Mass
- 7.2.2. Premium
- 7.2.3. Super-Premium
- 7.3. Market Analysis, Insights and Forecast - by Distribution Channel
- 7.3.1. On-Trade
- 7.3.2. Off-Trade
- 7.3.2.1. Supermarkets/Hypermarkets
- 7.3.2.2. Specialty Stores
- 7.3.2.3. Online Retailers
- 7.3.2.4. Other Distribution Channels
- 7.1. Market Analysis, Insights and Forecast - by Type
- 8. Asia Pacific Vodka Industry Analysis, Insights and Forecast, 2019-2031
- 8.1. Market Analysis, Insights and Forecast - by Type
- 8.1.1. Flavored
- 8.1.2. Non-Flavored
- 8.2. Market Analysis, Insights and Forecast - by Category
- 8.2.1. Mass
- 8.2.2. Premium
- 8.2.3. Super-Premium
- 8.3. Market Analysis, Insights and Forecast - by Distribution Channel
- 8.3.1. On-Trade
- 8.3.2. Off-Trade
- 8.3.2.1. Supermarkets/Hypermarkets
- 8.3.2.2. Specialty Stores
- 8.3.2.3. Online Retailers
- 8.3.2.4. Other Distribution Channels
- 8.1. Market Analysis, Insights and Forecast - by Type
- 9. South America Vodka Industry Analysis, Insights and Forecast, 2019-2031
- 9.1. Market Analysis, Insights and Forecast - by Type
- 9.1.1. Flavored
- 9.1.2. Non-Flavored
- 9.2. Market Analysis, Insights and Forecast - by Category
- 9.2.1. Mass
- 9.2.2. Premium
- 9.2.3. Super-Premium
- 9.3. Market Analysis, Insights and Forecast - by Distribution Channel
- 9.3.1. On-Trade
- 9.3.2. Off-Trade
- 9.3.2.1. Supermarkets/Hypermarkets
- 9.3.2.2. Specialty Stores
- 9.3.2.3. Online Retailers
- 9.3.2.4. Other Distribution Channels
- 9.1. Market Analysis, Insights and Forecast - by Type
- 10. Middle East and Africa Vodka Industry Analysis, Insights and Forecast, 2019-2031
- 10.1. Market Analysis, Insights and Forecast - by Type
- 10.1.1. Flavored
- 10.1.2. Non-Flavored
- 10.2. Market Analysis, Insights and Forecast - by Category
- 10.2.1. Mass
- 10.2.2. Premium
- 10.2.3. Super-Premium
- 10.3. Market Analysis, Insights and Forecast - by Distribution Channel
- 10.3.1. On-Trade
- 10.3.2. Off-Trade
- 10.3.2.1. Supermarkets/Hypermarkets
- 10.3.2.2. Specialty Stores
- 10.3.2.3. Online Retailers
- 10.3.2.4. Other Distribution Channels
- 10.1. Market Analysis, Insights and Forecast - by Type
- 11. North America Vodka Industry Analysis, Insights and Forecast, 2019-2031
- 11.1. Market Analysis, Insights and Forecast - By Country/Sub-region
- 11.1.1 United States
- 11.1.2 Canada
- 11.1.3 Mexico
- 11.1.4 Rest of North America
- 12. Europe Vodka Industry Analysis, Insights and Forecast, 2019-2031
- 12.1. Market Analysis, Insights and Forecast - By Country/Sub-region
- 12.1.1 Spain
- 12.1.2 United Kingdom
- 12.1.3 Germany
- 12.1.4 France
- 12.1.5 Italy
- 12.1.6 Russia
- 12.1.7 Rest of Europe
- 13. Asia Pacific Vodka Industry Analysis, Insights and Forecast, 2019-2031
- 13.1. Market Analysis, Insights and Forecast - By Country/Sub-region
- 13.1.1 China
- 13.1.2 Japan
- 13.1.3 India
- 13.1.4 Australia
- 13.1.5 Taiwan
- 13.1.6 Singapore
- 13.1.7 South Korea
- 13.1.8 Rest of Asia Pacific
- 14. South America Vodka Industry Analysis, Insights and Forecast, 2019-2031
- 14.1. Market Analysis, Insights and Forecast - By Country/Sub-region
- 14.1.1 Brazil
- 14.1.2 Argentina
- 14.1.3 Rest of South America
- 15. Middle East and Africa Vodka Industry Analysis, Insights and Forecast, 2019-2031
- 15.1. Market Analysis, Insights and Forecast - By Country/Sub-region
- 15.1.1 United Arab Emirates
- 15.1.2 South Africa
- 15.1.3 Rest of Middle East and Africa
- 16. Competitive Analysis
- 16.1. Global Market Share Analysis 2024
- 16.2. Company Profiles
- 16.2.1 Bacardi Limited
- 16.2.1.1. Overview
- 16.2.1.2. Products
- 16.2.1.3. SWOT Analysis
- 16.2.1.4. Recent Developments
- 16.2.1.5. Financials (Based on Availability)
- 16.2.2 Constellation Brands Inc
- 16.2.2.1. Overview
- 16.2.2.2. Products
- 16.2.2.3. SWOT Analysis
- 16.2.2.4. Recent Developments
- 16.2.2.5. Financials (Based on Availability)
- 16.2.3 Fifth Generation Inc
- 16.2.3.1. Overview
- 16.2.3.2. Products
- 16.2.3.3. SWOT Analysis
- 16.2.3.4. Recent Developments
- 16.2.3.5. Financials (Based on Availability)
- 16.2.4 Kirker Greer Holdings Limited
- 16.2.4.1. Overview
- 16.2.4.2. Products
- 16.2.4.3. SWOT Analysis
- 16.2.4.4. Recent Developments
- 16.2.4.5. Financials (Based on Availability)
- 16.2.5 The Coca-cola Hbc Ag
- 16.2.5.1. Overview
- 16.2.5.2. Products
- 16.2.5.3. SWOT Analysis
- 16.2.5.4. Recent Developments
- 16.2.5.5. Financials (Based on Availability)
- 16.2.6 Luctor International*List Not Exhaustive
- 16.2.6.1. Overview
- 16.2.6.2. Products
- 16.2.6.3. SWOT Analysis
- 16.2.6.4. Recent Developments
- 16.2.6.5. Financials (Based on Availability)
- 16.2.7 Pernod Ricard
- 16.2.7.1. Overview
- 16.2.7.2. Products
- 16.2.7.3. SWOT Analysis
- 16.2.7.4. Recent Developments
- 16.2.7.5. Financials (Based on Availability)
- 16.2.8 LVMH Moet Hennessy Louis Vuitton (Belvedere Vodka
- 16.2.8.1. Overview
- 16.2.8.2. Products
- 16.2.8.3. SWOT Analysis
- 16.2.8.4. Recent Developments
- 16.2.8.5. Financials (Based on Availability)
- 16.2.9 Becle SAB de
- 16.2.9.1. Overview
- 16.2.9.2. Products
- 16.2.9.3. SWOT Analysis
- 16.2.9.4. Recent Developments
- 16.2.9.5. Financials (Based on Availability)
- 16.2.10 Diageo PLC
- 16.2.10.1. Overview
- 16.2.10.2. Products
- 16.2.10.3. SWOT Analysis
- 16.2.10.4. Recent Developments
- 16.2.10.5. Financials (Based on Availability)
- 16.2.1 Bacardi Limited
List of Figures
- Figure 1: Global Vodka Industry Revenue Breakdown (Million, %) by Region 2024 & 2032
- Figure 2: North America Vodka Industry Revenue (Million), by Country 2024 & 2032
- Figure 3: North America Vodka Industry Revenue Share (%), by Country 2024 & 2032
- Figure 4: Europe Vodka Industry Revenue (Million), by Country 2024 & 2032
- Figure 5: Europe Vodka Industry Revenue Share (%), by Country 2024 & 2032
- Figure 6: Asia Pacific Vodka Industry Revenue (Million), by Country 2024 & 2032
- Figure 7: Asia Pacific Vodka Industry Revenue Share (%), by Country 2024 & 2032
- Figure 8: South America Vodka Industry Revenue (Million), by Country 2024 & 2032
- Figure 9: South America Vodka Industry Revenue Share (%), by Country 2024 & 2032
- Figure 10: Middle East and Africa Vodka Industry Revenue (Million), by Country 2024 & 2032
- Figure 11: Middle East and Africa Vodka Industry Revenue Share (%), by Country 2024 & 2032
- Figure 12: North America Vodka Industry Revenue (Million), by Type 2024 & 2032
- Figure 13: North America Vodka Industry Revenue Share (%), by Type 2024 & 2032
- Figure 14: North America Vodka Industry Revenue (Million), by Category 2024 & 2032
- Figure 15: North America Vodka Industry Revenue Share (%), by Category 2024 & 2032
- Figure 16: North America Vodka Industry Revenue (Million), by Distribution Channel 2024 & 2032
- Figure 17: North America Vodka Industry Revenue Share (%), by Distribution Channel 2024 & 2032
- Figure 18: North America Vodka Industry Revenue (Million), by Country 2024 & 2032
- Figure 19: North America Vodka Industry Revenue Share (%), by Country 2024 & 2032
- Figure 20: Europe Vodka Industry Revenue (Million), by Type 2024 & 2032
- Figure 21: Europe Vodka Industry Revenue Share (%), by Type 2024 & 2032
- Figure 22: Europe Vodka Industry Revenue (Million), by Category 2024 & 2032
- Figure 23: Europe Vodka Industry Revenue Share (%), by Category 2024 & 2032
- Figure 24: Europe Vodka Industry Revenue (Million), by Distribution Channel 2024 & 2032
- Figure 25: Europe Vodka Industry Revenue Share (%), by Distribution Channel 2024 & 2032
- Figure 26: Europe Vodka Industry Revenue (Million), by Country 2024 & 2032
- Figure 27: Europe Vodka Industry Revenue Share (%), by Country 2024 & 2032
- Figure 28: Asia Pacific Vodka Industry Revenue (Million), by Type 2024 & 2032
- Figure 29: Asia Pacific Vodka Industry Revenue Share (%), by Type 2024 & 2032
- Figure 30: Asia Pacific Vodka Industry Revenue (Million), by Category 2024 & 2032
- Figure 31: Asia Pacific Vodka Industry Revenue Share (%), by Category 2024 & 2032
- Figure 32: Asia Pacific Vodka Industry Revenue (Million), by Distribution Channel 2024 & 2032
- Figure 33: Asia Pacific Vodka Industry Revenue Share (%), by Distribution Channel 2024 & 2032
- Figure 34: Asia Pacific Vodka Industry Revenue (Million), by Country 2024 & 2032
- Figure 35: Asia Pacific Vodka Industry Revenue Share (%), by Country 2024 & 2032
- Figure 36: South America Vodka Industry Revenue (Million), by Type 2024 & 2032
- Figure 37: South America Vodka Industry Revenue Share (%), by Type 2024 & 2032
- Figure 38: South America Vodka Industry Revenue (Million), by Category 2024 & 2032
- Figure 39: South America Vodka Industry Revenue Share (%), by Category 2024 & 2032
- Figure 40: South America Vodka Industry Revenue (Million), by Distribution Channel 2024 & 2032
- Figure 41: South America Vodka Industry Revenue Share (%), by Distribution Channel 2024 & 2032
- Figure 42: South America Vodka Industry Revenue (Million), by Country 2024 & 2032
- Figure 43: South America Vodka Industry Revenue Share (%), by Country 2024 & 2032
- Figure 44: Middle East and Africa Vodka Industry Revenue (Million), by Type 2024 & 2032
- Figure 45: Middle East and Africa Vodka Industry Revenue Share (%), by Type 2024 & 2032
- Figure 46: Middle East and Africa Vodka Industry Revenue (Million), by Category 2024 & 2032
- Figure 47: Middle East and Africa Vodka Industry Revenue Share (%), by Category 2024 & 2032
- Figure 48: Middle East and Africa Vodka Industry Revenue (Million), by Distribution Channel 2024 & 2032
- Figure 49: Middle East and Africa Vodka Industry Revenue Share (%), by Distribution Channel 2024 & 2032
- Figure 50: Middle East and Africa Vodka Industry Revenue (Million), by Country 2024 & 2032
- Figure 51: Middle East and Africa Vodka Industry Revenue Share (%), by Country 2024 & 2032
List of Tables
- Table 1: Global Vodka Industry Revenue Million Forecast, by Region 2019 & 2032
- Table 2: Global Vodka Industry Revenue Million Forecast, by Type 2019 & 2032
- Table 3: Global Vodka Industry Revenue Million Forecast, by Category 2019 & 2032
- Table 4: Global Vodka Industry Revenue Million Forecast, by Distribution Channel 2019 & 2032
- Table 5: Global Vodka Industry Revenue Million Forecast, by Region 2019 & 2032
- Table 6: Global Vodka Industry Revenue Million Forecast, by Country 2019 & 2032
- Table 7: United States Vodka Industry Revenue (Million) Forecast, by Application 2019 & 2032
- Table 8: Canada Vodka Industry Revenue (Million) Forecast, by Application 2019 & 2032
- Table 9: Mexico Vodka Industry Revenue (Million) Forecast, by Application 2019 & 2032
- Table 10: Rest of North America Vodka Industry Revenue (Million) Forecast, by Application 2019 & 2032
- Table 11: Global Vodka Industry Revenue Million Forecast, by Country 2019 & 2032
- Table 12: Spain Vodka Industry Revenue (Million) Forecast, by Application 2019 & 2032
- Table 13: United Kingdom Vodka Industry Revenue (Million) Forecast, by Application 2019 & 2032
- Table 14: Germany Vodka Industry Revenue (Million) Forecast, by Application 2019 & 2032
- Table 15: France Vodka Industry Revenue (Million) Forecast, by Application 2019 & 2032
- Table 16: Italy Vodka Industry Revenue (Million) Forecast, by Application 2019 & 2032
- Table 17: Russia Vodka Industry Revenue (Million) Forecast, by Application 2019 & 2032
- Table 18: Rest of Europe Vodka Industry Revenue (Million) Forecast, by Application 2019 & 2032
- Table 19: Global Vodka Industry Revenue Million Forecast, by Country 2019 & 2032
- Table 20: China Vodka Industry Revenue (Million) Forecast, by Application 2019 & 2032
- Table 21: Japan Vodka Industry Revenue (Million) Forecast, by Application 2019 & 2032
- Table 22: India Vodka Industry Revenue (Million) Forecast, by Application 2019 & 2032
- Table 23: Australia Vodka Industry Revenue (Million) Forecast, by Application 2019 & 2032
- Table 24: Taiwan Vodka Industry Revenue (Million) Forecast, by Application 2019 & 2032
- Table 25: Singapore Vodka Industry Revenue (Million) Forecast, by Application 2019 & 2032
- Table 26: South Korea Vodka Industry Revenue (Million) Forecast, by Application 2019 & 2032
- Table 27: Rest of Asia Pacific Vodka Industry Revenue (Million) Forecast, by Application 2019 & 2032
- Table 28: Global Vodka Industry Revenue Million Forecast, by Country 2019 & 2032
- Table 29: Brazil Vodka Industry Revenue (Million) Forecast, by Application 2019 & 2032
- Table 30: Argentina Vodka Industry Revenue (Million) Forecast, by Application 2019 & 2032
- Table 31: Rest of South America Vodka Industry Revenue (Million) Forecast, by Application 2019 & 2032
- Table 32: Global Vodka Industry Revenue Million Forecast, by Country 2019 & 2032
- Table 33: United Arab Emirates Vodka Industry Revenue (Million) Forecast, by Application 2019 & 2032
- Table 34: South Africa Vodka Industry Revenue (Million) Forecast, by Application 2019 & 2032
- Table 35: Rest of Middle East and Africa Vodka Industry Revenue (Million) Forecast, by Application 2019 & 2032
- Table 36: Global Vodka Industry Revenue Million Forecast, by Type 2019 & 2032
- Table 37: Global Vodka Industry Revenue Million Forecast, by Category 2019 & 2032
- Table 38: Global Vodka Industry Revenue Million Forecast, by Distribution Channel 2019 & 2032
- Table 39: Global Vodka Industry Revenue Million Forecast, by Country 2019 & 2032
- Table 40: United States Vodka Industry Revenue (Million) Forecast, by Application 2019 & 2032
- Table 41: Canada Vodka Industry Revenue (Million) Forecast, by Application 2019 & 2032
- Table 42: Mexico Vodka Industry Revenue (Million) Forecast, by Application 2019 & 2032
- Table 43: Rest of North America Vodka Industry Revenue (Million) Forecast, by Application 2019 & 2032
- Table 44: Global Vodka Industry Revenue Million Forecast, by Type 2019 & 2032
- Table 45: Global Vodka Industry Revenue Million Forecast, by Category 2019 & 2032
- Table 46: Global Vodka Industry Revenue Million Forecast, by Distribution Channel 2019 & 2032
- Table 47: Global Vodka Industry Revenue Million Forecast, by Country 2019 & 2032
- Table 48: Spain Vodka Industry Revenue (Million) Forecast, by Application 2019 & 2032
- Table 49: United Kingdom Vodka Industry Revenue (Million) Forecast, by Application 2019 & 2032
- Table 50: Germany Vodka Industry Revenue (Million) Forecast, by Application 2019 & 2032
- Table 51: France Vodka Industry Revenue (Million) Forecast, by Application 2019 & 2032
- Table 52: Italy Vodka Industry Revenue (Million) Forecast, by Application 2019 & 2032
- Table 53: Russia Vodka Industry Revenue (Million) Forecast, by Application 2019 & 2032
- Table 54: Rest of Europe Vodka Industry Revenue (Million) Forecast, by Application 2019 & 2032
- Table 55: Global Vodka Industry Revenue Million Forecast, by Type 2019 & 2032
- Table 56: Global Vodka Industry Revenue Million Forecast, by Category 2019 & 2032
- Table 57: Global Vodka Industry Revenue Million Forecast, by Distribution Channel 2019 & 2032
- Table 58: Global Vodka Industry Revenue Million Forecast, by Country 2019 & 2032
- Table 59: China Vodka Industry Revenue (Million) Forecast, by Application 2019 & 2032
- Table 60: Japan Vodka Industry Revenue (Million) Forecast, by Application 2019 & 2032
- Table 61: India Vodka Industry Revenue (Million) Forecast, by Application 2019 & 2032
- Table 62: Australia Vodka Industry Revenue (Million) Forecast, by Application 2019 & 2032
- Table 63: Taiwan Vodka Industry Revenue (Million) Forecast, by Application 2019 & 2032
- Table 64: Singapore Vodka Industry Revenue (Million) Forecast, by Application 2019 & 2032
- Table 65: South Korea Vodka Industry Revenue (Million) Forecast, by Application 2019 & 2032
- Table 66: Rest of Asia Pacific Vodka Industry Revenue (Million) Forecast, by Application 2019 & 2032
- Table 67: Global Vodka Industry Revenue Million Forecast, by Type 2019 & 2032
- Table 68: Global Vodka Industry Revenue Million Forecast, by Category 2019 & 2032
- Table 69: Global Vodka Industry Revenue Million Forecast, by Distribution Channel 2019 & 2032
- Table 70: Global Vodka Industry Revenue Million Forecast, by Country 2019 & 2032
- Table 71: Brazil Vodka Industry Revenue (Million) Forecast, by Application 2019 & 2032
- Table 72: Argentina Vodka Industry Revenue (Million) Forecast, by Application 2019 & 2032
- Table 73: Rest of South America Vodka Industry Revenue (Million) Forecast, by Application 2019 & 2032
- Table 74: Global Vodka Industry Revenue Million Forecast, by Type 2019 & 2032
- Table 75: Global Vodka Industry Revenue Million Forecast, by Category 2019 & 2032
- Table 76: Global Vodka Industry Revenue Million Forecast, by Distribution Channel 2019 & 2032
- Table 77: Global Vodka Industry Revenue Million Forecast, by Country 2019 & 2032
- Table 78: United Arab Emirates Vodka Industry Revenue (Million) Forecast, by Application 2019 & 2032
- Table 79: South Africa Vodka Industry Revenue (Million) Forecast, by Application 2019 & 2032
- Table 80: Rest of Middle East and Africa Vodka Industry Revenue (Million) Forecast, by Application 2019 & 2032
Frequently Asked Questions
1. What is the projected Compound Annual Growth Rate (CAGR) of the Vodka Industry?
The projected CAGR is approximately 4.47%.
2. Which companies are prominent players in the Vodka Industry?
Key companies in the market include Bacardi Limited, Constellation Brands Inc, Fifth Generation Inc, Kirker Greer Holdings Limited, The Coca-cola Hbc Ag, Luctor International*List Not Exhaustive, Pernod Ricard, LVMH Moet Hennessy Louis Vuitton (Belvedere Vodka, Becle SAB de, Diageo PLC.
3. What are the main segments of the Vodka Industry?
The market segments include Type, Category, Distribution Channel.
4. Can you provide details about the market size?
The market size is estimated to be USD XX Million as of 2022.
5. What are some drivers contributing to market growth?
Demand for Premium and Super Premium Vodka; Effective Branding and Marketing by Players.
6. What are the notable trends driving market growth?
Premiumization of Vodka.
7. Are there any restraints impacting market growth?
Stringent Regulations Pertaining to Vodka; Popularity of Non-alcoholic Beverages.
8. Can you provide examples of recent developments in the market?
February 2023: Diageo expanded its portfolio by launching a new product, the Cherry Drop Smirnoff variety, consisting of a unique flavor with 37.5% ABV.
9. What pricing options are available for accessing the report?
Pricing options include single-user, multi-user, and enterprise licenses priced at USD 4750, USD 5250, and USD 8750 respectively.
10. Is the market size provided in terms of value or volume?
The market size is provided in terms of value, measured in Million.
11. Are there any specific market keywords associated with the report?
Yes, the market keyword associated with the report is "Vodka Industry," which aids in identifying and referencing the specific market segment covered.
12. How do I determine which pricing option suits my needs best?
The pricing options vary based on user requirements and access needs. Individual users may opt for single-user licenses, while businesses requiring broader access may choose multi-user or enterprise licenses for cost-effective access to the report.
13. Are there any additional resources or data provided in the Vodka Industry report?
While the report offers comprehensive insights, it's advisable to review the specific contents or supplementary materials provided to ascertain if additional resources or data are available.
14. How can I stay updated on further developments or reports in the Vodka Industry?
To stay informed about further developments, trends, and reports in the Vodka Industry, consider subscribing to industry newsletters, following relevant companies and organizations, or regularly checking reputable industry news sources and publications.
Methodology
Step 1 - Identification of Relevant Samples Size from Population Database


Step 2 - Approaches for Defining Global Market Size (Value, Volume* & Price*)

Note*: In applicable scenarios
Step 3 - Data Sources
Primary Research
- Web Analytics
- Survey Reports
- Research Institute
- Latest Research Reports
- Opinion Leaders
Secondary Research
- Annual Reports
- White Paper
- Latest Press Release
- Industry Association
- Paid Database
- Investor Presentations

Step 4 - Data Triangulation
Involves using different sources of information in order to increase the validity of a study
These sources are likely to be stakeholders in a program - participants, other researchers, program staff, other community members, and so on.
Then we put all data in single framework & apply various statistical tools to find out the dynamic on the market.
During the analysis stage, feedback from the stakeholder groups would be compared to determine areas of agreement as well as areas of divergence


