

Key Insights
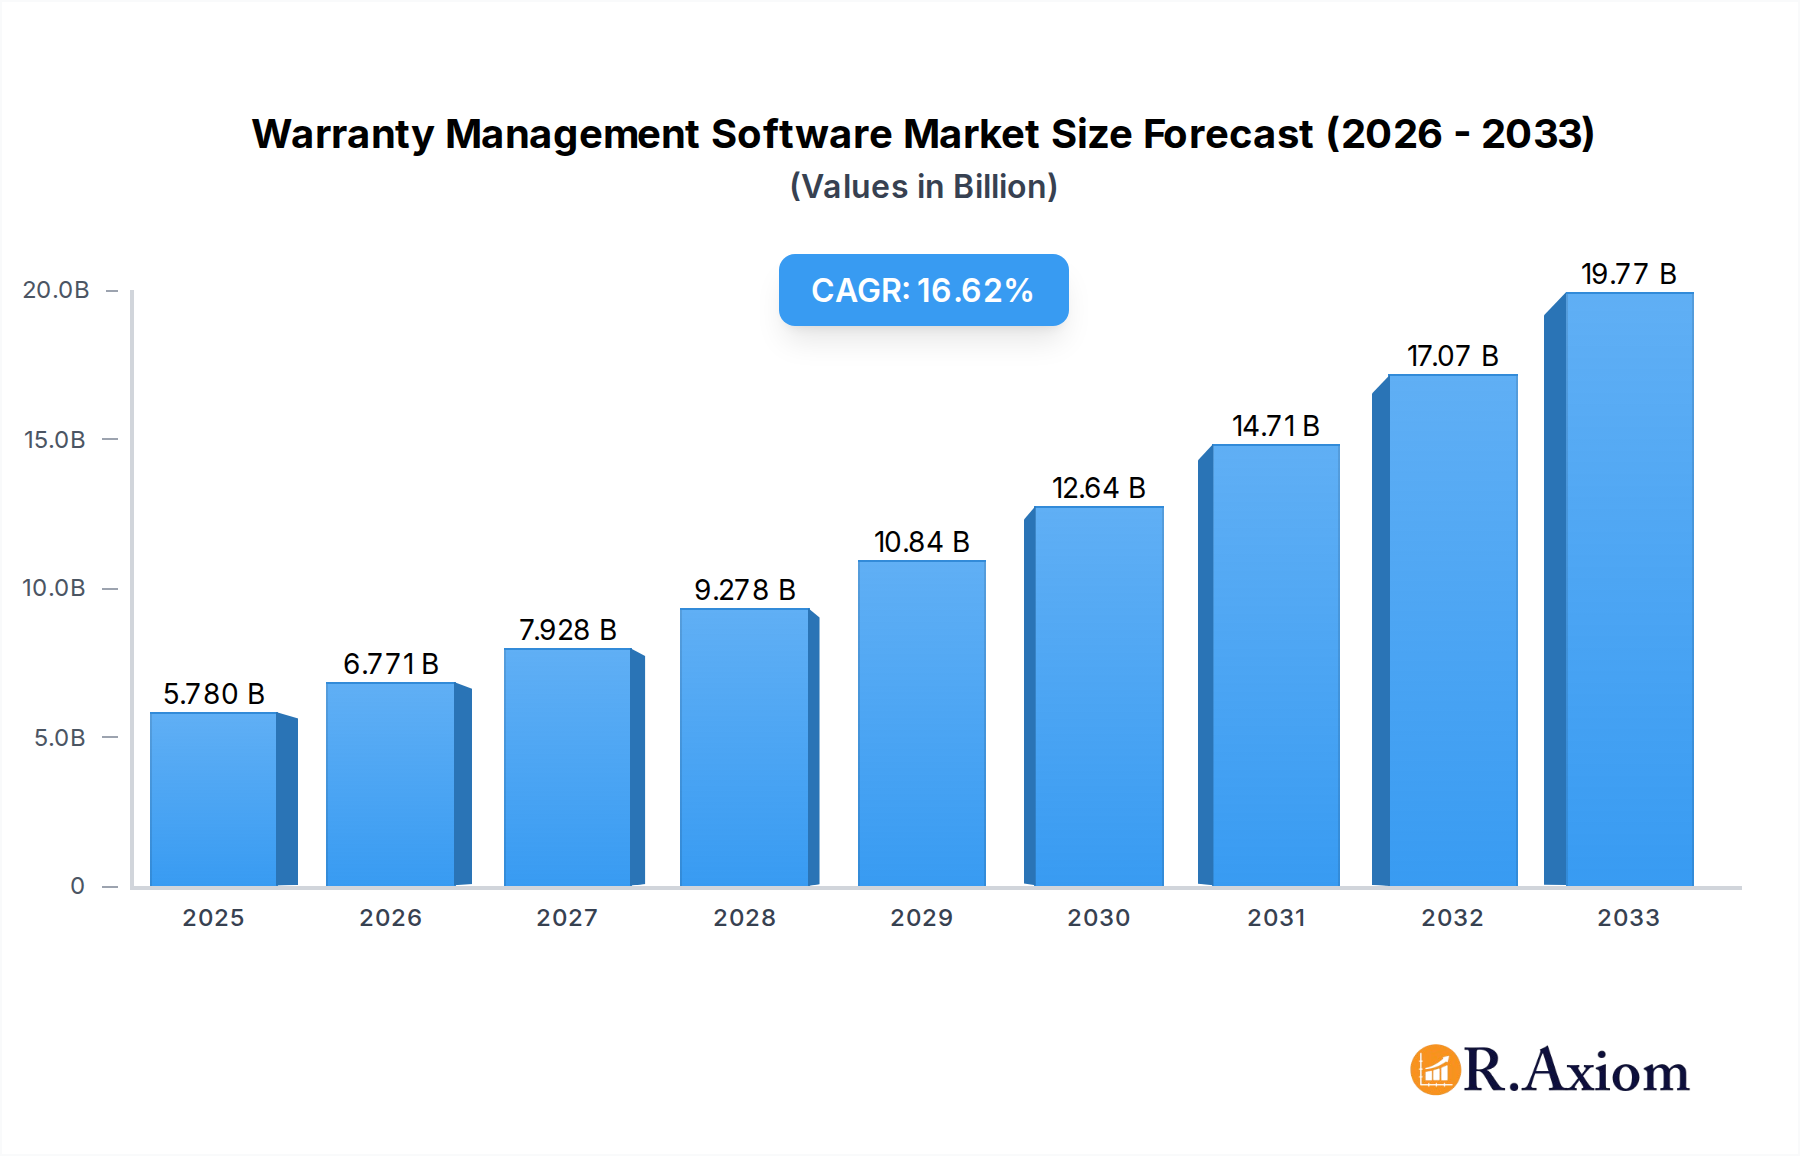
The global Warranty Management Software market is poised for substantial growth, projected to reach an estimated $5.78 billion by 2025. This robust expansion is fueled by an impressive CAGR of 17.12%, indicating a dynamic and rapidly evolving industry landscape. The increasing complexity of product lifecycles, coupled with a growing emphasis on customer satisfaction and retention, are primary drivers. Businesses are recognizing the strategic imperative of efficient warranty management to reduce costs associated with claims, enhance brand reputation through seamless service experiences, and gain valuable insights into product performance and failure trends. The demand for cloud-based solutions is anticipated to surge, offering scalability, accessibility, and cost-effectiveness, particularly for small and medium-sized enterprises. Conversely, on-premises solutions will continue to cater to organizations with stringent data security requirements.

Warranty Management Software Market Size (In Billion)
The market segmentation highlights a strong focus on catering to diverse enterprise needs. Large enterprises, with their intricate product portfolios and extensive customer bases, represent a significant segment, demanding sophisticated features for managing high volumes of claims and data. Medium-sized enterprises are actively adopting these solutions to streamline operations and improve customer service, while small enterprises are increasingly leveraging affordable cloud-based options to compete effectively. Geographically, North America and Europe are expected to lead the market, driven by early adoption of technology and a mature service economy. However, the Asia Pacific region, with its burgeoning manufacturing sector and increasing focus on after-sales services, presents a substantial growth opportunity. Key trends include the integration of AI and machine learning for predictive analytics and fraud detection, as well as enhanced mobile accessibility for field service technicians, all contributing to a more efficient and proactive warranty management ecosystem.
Warranty Management Software Company Market Share
This in-depth report provides a detailed analysis of the global Warranty Management Software market, offering critical insights for industry stakeholders. Leveraging billions in market valuation and an extensive study period from 2019 to 2033, this report equips businesses with the knowledge to navigate market dynamics, capitalize on emerging trends, and optimize their warranty processes.
Warranty Management Software Market Concentration & Innovation
The Warranty Management Software market exhibits a moderate concentration, characterized by a blend of established players and emerging innovators. Key drivers of innovation include the increasing demand for streamlined warranty claims processing, enhanced customer experience, and proactive product lifecycle management. Regulatory frameworks, particularly those related to consumer protection and product safety, also play a significant role in shaping product development and compliance. Product substitutes, such as manual processes or less integrated ERP modules, are gradually being phased out as the benefits of specialized warranty management solutions become more apparent. End-user trends are strongly leaning towards cloud-based solutions offering scalability, accessibility, and cost-effectiveness. Mergers and Acquisitions (M&A) activity, with estimated deal values in the billions, is a notable indicator of market consolidation and strategic expansion, as companies seek to acquire innovative technologies and broaden their customer base. Companies like FieldEZ Technologies, Metasystems, and ServicePower are actively participating in this dynamic landscape.
Warranty Management Software Industry Trends & Insights
The Warranty Management Software industry is poised for robust growth, driven by several compelling factors. The escalating complexity of product offerings, coupled with a growing global customer base, necessitates sophisticated systems for managing warranty claims, service requests, and repair processes. Technological advancements, including the integration of Artificial Intelligence (AI) for predictive maintenance and automated claim validation, are revolutionizing the sector. Furthermore, a heightened focus on customer retention and loyalty is pushing businesses to offer seamless and efficient warranty experiences, transforming warranty from a cost center to a customer satisfaction driver. The increasing adoption of the Internet of Things (IoT) is generating a wealth of data that can be leveraged for proactive warranty management, identifying potential issues before they lead to claims. The market penetration of these solutions is rapidly expanding across various industries, from automotive and electronics to manufacturing and healthcare. The projected Compound Annual Growth Rate (CAGR) signifies a significant upward trajectory for the market, indicating substantial opportunities for growth and investment.
Dominant Markets & Segments in Warranty Management Software
The Warranty Management Software market is experiencing dominant growth across various segments, reflecting diverse business needs and technological adoption patterns.
Application:
- Large Enterprises (1000+ Users): This segment is a primary growth engine due to the sheer volume of warranty claims, complex product portfolios, and the need for robust, scalable solutions. Economic policies supporting industrial growth and infrastructure development in emerging economies are indirectly fueling the adoption of advanced warranty management systems. Key drivers include the imperative for centralized control, enhanced data analytics for product defect identification, and compliance with stringent industry regulations. Companies like Tavant Technologies and Mize are well-positioned to serve this segment.
- Medium-Sized Enterprise (499-1000 Users): This segment is characterized by a strong need for cost-effective yet comprehensive warranty solutions. They often seek cloud-based platforms that offer flexibility and rapid deployment. The drive for competitive advantage and improved customer service pushes these enterprises to invest in software that streamlines operations and reduces administrative overhead.
- Small Enterprises (1-499 Users): While historically slower to adopt, this segment is increasingly recognizing the value of warranty management software, particularly cloud-based solutions that are affordable and easy to implement. They are driven by the need to professionalize their operations, improve customer satisfaction, and avoid the pitfalls of inefficient manual tracking.
Types:
- Cloud-based: This type is experiencing phenomenal growth due to its inherent scalability, lower upfront costs, ease of access, and continuous updates. Favorable government initiatives promoting digital transformation and cloud adoption in numerous countries are a significant catalyst. The ability to integrate with other cloud-based business applications further solidifies its dominance. Companies like ServicePower and SalesBabu Business Solutions are strong contenders in this space.
- On-premises: While still relevant for organizations with strict data security requirements or specific legacy system integrations, on-premises solutions are seeing a slower growth rate compared to cloud-based alternatives. The initial investment and ongoing maintenance costs are a significant consideration for many businesses.
Warranty Management Software Product Developments
Product developments in the Warranty Management Software market are focused on enhancing automation, improving user experience, and leveraging advanced technologies. Innovations include AI-powered claim adjudication, predictive analytics for product failure, and seamless integration with CRM and ERP systems. These advancements provide competitive advantages by reducing processing times, minimizing fraudulent claims, and offering proactive customer support. The market fit is increasingly driven by the demand for end-to-end solutions that cover the entire warranty lifecycle, from registration and claims submission to repair, returns, and analytics. Companies like Zed-Axis Technologies and Service Software are at the forefront of these developments.
Report Scope & Segmentation Analysis
This report offers a comprehensive analysis of the Warranty Management Software market, meticulously segmented to provide granular insights.
- Large Enterprises (1000+ Users): This segment is projected to hold a substantial market share, driven by the complexity of their operations and the significant ROI from optimized warranty processes. Growth projections indicate a steady increase as these organizations continue to invest in enterprise-grade solutions.
- Medium-Sized Enterprise (499-1000 Users): This segment is expected to witness robust growth, as these companies seek to enhance their competitive edge through efficient warranty management. Market size is expanding as more mid-sized businesses recognize the strategic importance of these solutions.
- Small Enterprises (1-499 Users): This segment, while smaller in current market share, is projected for rapid growth as affordable and user-friendly cloud-based solutions become more accessible. Competitive dynamics are evolving with the entry of providers focusing on SMB needs.
- Cloud-based: This type is anticipated to dominate the market, with significant growth projections driven by its inherent advantages and widespread adoption across all enterprise sizes.
- On-premises: This type will continue to hold a relevant, albeit smaller, market share, primarily catering to specific industry requirements and existing infrastructure.
Key Drivers of Warranty Management Software Growth
The growth of the Warranty Management Software market is propelled by several key factors. The increasing complexity and cost of products across industries necessitate robust systems to manage warranty claims efficiently and accurately, thereby minimizing financial losses. The rising emphasis on customer experience and loyalty is a significant driver, as a streamlined warranty process directly impacts customer satisfaction and retention. Technological advancements, including the integration of AI, machine learning, and IoT for predictive maintenance and automated claim processing, are transforming operational efficiency. Furthermore, evolving regulatory landscapes and the need for compliance with consumer protection laws are compelling organizations to adopt sophisticated warranty management solutions.
Challenges in the Warranty Management Software Sector
Despite the strong growth trajectory, the Warranty Management Software sector faces several challenges. High implementation costs and the complexity of integrating with existing legacy systems can be significant barriers, particularly for smaller enterprises. Resistance to change and a lack of awareness regarding the full benefits of specialized software can hinder adoption rates. Cybersecurity concerns and data privacy issues are paramount, requiring robust security measures and compliance with evolving regulations. Intense competition among vendors, leading to price pressures, and the continuous need for innovation to keep pace with technological advancements also present ongoing challenges.
Emerging Opportunities in Warranty Management Software
The Warranty Management Software market is ripe with emerging opportunities. The expansion of the IoT ecosystem presents a significant opportunity for integrating real-time product performance data into warranty management, enabling predictive maintenance and proactive service. The growing demand for sustainability and circular economy initiatives is driving interest in software that can effectively manage product returns, refurbishment, and end-of-life processes. The increasing globalization of businesses necessitates warranty management solutions that can handle multilingual support and diverse regional regulations. Furthermore, the development of specialized warranty solutions for niche industries, such as medical devices or aerospace, offers a promising avenue for market penetration.
Leading Players in the Warranty Management Software Market
The Warranty Management Software market features a competitive landscape with several key players driving innovation and market growth. These include:
- FieldEZ Technologies
- Metasystems
- Renewity Systems
- ServicePower
- SalesBabu Business Solutions
- Zed-Axis Technologies
- Service Software
- Mize
- Tavant Technologies
- Evia Information Systems
- DealersCircle
- ServiceCentral Technologies
- Warranty Master Software
- Infozech Software
Key Developments in Warranty Management Software Industry
- 2024: Increased integration of AI for automated claim fraud detection by various providers.
- 2024: Launch of enhanced IoT-enabled predictive maintenance modules by leading software vendors.
- 2023: Several strategic partnerships formed to expand cloud-based warranty solution offerings.
- 2023: Increased focus on sustainability features within warranty management systems, including returns and refurbishment tracking.
- 2022: Mergers and acquisitions activity intensified as larger players sought to consolidate market share and acquire innovative technologies.
- 2022: Significant advancements in mobile accessibility for field service technicians managing warranty claims.
- 2021: Introduction of more sophisticated analytics dashboards for better warranty data insights.
- 2020: Accelerated adoption of cloud-based solutions driven by the shift towards remote work and digital transformation initiatives.
- 2019: Emergence of specialized warranty management solutions for emerging industries like electric vehicles.
Strategic Outlook for Warranty Management Software Market
The strategic outlook for the Warranty Management Software market remains exceptionally strong, driven by the continuous need for operational efficiency, enhanced customer satisfaction, and proactive risk management. The ongoing digital transformation across industries will fuel the demand for sophisticated, integrated warranty solutions. Companies that prioritize innovation, particularly in areas like AI, IoT integration, and user experience, will be well-positioned to capture significant market share. Strategic collaborations and potential M&A activities are expected to shape the competitive landscape, leading to further consolidation and the emergence of comprehensive service offerings. The increasing global adoption of cloud-based solutions will continue to be a dominant trend, enabling scalability and accessibility for businesses of all sizes.
Warranty Management Software Segmentation
-
1. Application
- 1.1. Large Enterprises(1000+ Users)
- 1.2. Medium-Sized Enterprise(499-1000 Users)
- 1.3. Small Enterprises(1-499 Users)
-
2. Types
- 2.1. Cloud-based
- 2.2. On-premises
Warranty Management Software Segmentation By Geography
-
1. North America
- 1.1. United States
- 1.2. Canada
- 1.3. Mexico
-
2. South America
- 2.1. Brazil
- 2.2. Argentina
- 2.3. Rest of South America
-
3. Europe
- 3.1. United Kingdom
- 3.2. Germany
- 3.3. France
- 3.4. Italy
- 3.5. Spain
- 3.6. Russia
- 3.7. Benelux
- 3.8. Nordics
- 3.9. Rest of Europe
-
4. Middle East & Africa
- 4.1. Turkey
- 4.2. Israel
- 4.3. GCC
- 4.4. North Africa
- 4.5. South Africa
- 4.6. Rest of Middle East & Africa
-
5. Asia Pacific
- 5.1. China
- 5.2. India
- 5.3. Japan
- 5.4. South Korea
- 5.5. ASEAN
- 5.6. Oceania
- 5.7. Rest of Asia Pacific
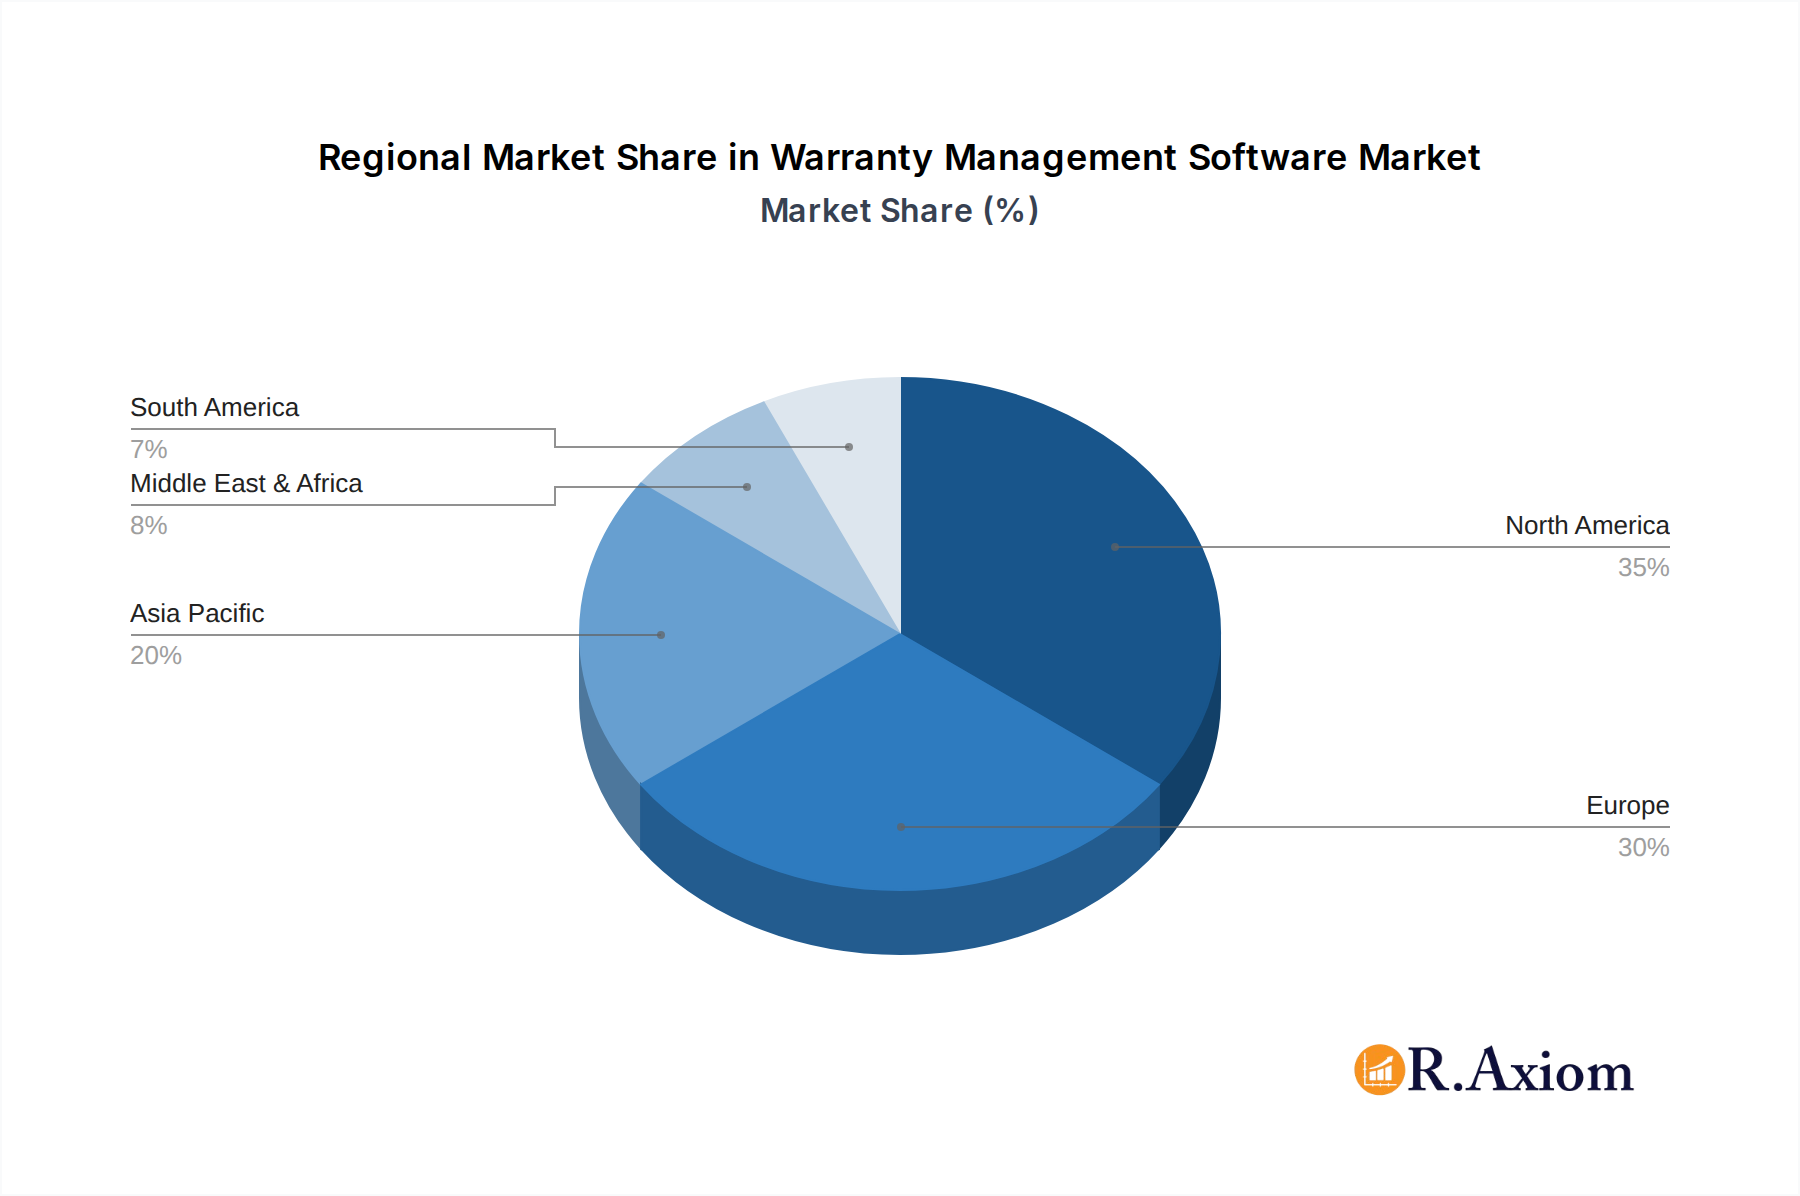
Warranty Management Software Regional Market Share
Geographic Coverage of Warranty Management Software
Warranty Management Software REPORT HIGHLIGHTS
| Aspects | Details |
|---|---|
| Study Period | 2020-2034 |
| Base Year | 2025 |
| Estimated Year | 2026 |
| Forecast Period | 2026-2034 |
| Historical Period | 2020-2025 |
| Growth Rate | CAGR of 17.12% from 2020-2034 |
| Segmentation |
|
Table of Contents
- 1. Introduction
- 1.1. Research Scope
- 1.2. Market Segmentation
- 1.3. Research Objective
- 1.4. Definitions and Assumptions
- 2. Executive Summary
- 2.1. Market Snapshot
- 3. Market Dynamics
- 3.1. Market Drivers
- 3.2. Market Restrains
- 3.3. Market Trends
- 3.4. Market Opportunities
- 4. Market Factor Analysis
- 4.1. Porters Five Forces
- 4.1.1. Bargaining Power of Suppliers
- 4.1.2. Bargaining Power of Buyers
- 4.1.3. Threat of New Entrants
- 4.1.4. Threat of Substitutes
- 4.1.5. Competitive Rivalry
- 4.2. PESTEL analysis
- 4.3. BCG Analysis
- 4.3.1. Stars (High Growth, High Market Share)
- 4.3.2. Cash Cows (Low Growth, High Market Share)
- 4.3.3. Question Mark (High Growth, Low Market Share)
- 4.3.4. Dogs (Low Growth, Low Market Share)
- 4.4. Ansoff Matrix Analysis
- 4.5. Supply Chain Analysis
- 4.6. Regulatory Landscape
- 4.7. Current Market Potential and Opportunity Assessment (TAM–SAM–SOM Framework)
- 4.8. RAX Analyst Note
- 4.1. Porters Five Forces
- 5. Market Analysis, Insights and Forecast 2021-2033
- 5.1. Market Analysis, Insights and Forecast - by Application
- 5.1.1. Large Enterprises(1000+ Users)
- 5.1.2. Medium-Sized Enterprise(499-1000 Users)
- 5.1.3. Small Enterprises(1-499 Users)
- 5.2. Market Analysis, Insights and Forecast - by Types
- 5.2.1. Cloud-based
- 5.2.2. On-premises
- 5.3. Market Analysis, Insights and Forecast - by Region
- 5.3.1. North America
- 5.3.2. South America
- 5.3.3. Europe
- 5.3.4. Middle East & Africa
- 5.3.5. Asia Pacific
- 5.1. Market Analysis, Insights and Forecast - by Application
- 6. Global Warranty Management Software Analysis, Insights and Forecast, 2021-2033
- 6.1. Market Analysis, Insights and Forecast - by Application
- 6.1.1. Large Enterprises(1000+ Users)
- 6.1.2. Medium-Sized Enterprise(499-1000 Users)
- 6.1.3. Small Enterprises(1-499 Users)
- 6.2. Market Analysis, Insights and Forecast - by Types
- 6.2.1. Cloud-based
- 6.2.2. On-premises
- 6.1. Market Analysis, Insights and Forecast - by Application
- 7. North America Warranty Management Software Analysis, Insights and Forecast, 2020-2032
- 7.1. Market Analysis, Insights and Forecast - by Application
- 7.1.1. Large Enterprises(1000+ Users)
- 7.1.2. Medium-Sized Enterprise(499-1000 Users)
- 7.1.3. Small Enterprises(1-499 Users)
- 7.2. Market Analysis, Insights and Forecast - by Types
- 7.2.1. Cloud-based
- 7.2.2. On-premises
- 7.1. Market Analysis, Insights and Forecast - by Application
- 8. South America Warranty Management Software Analysis, Insights and Forecast, 2020-2032
- 8.1. Market Analysis, Insights and Forecast - by Application
- 8.1.1. Large Enterprises(1000+ Users)
- 8.1.2. Medium-Sized Enterprise(499-1000 Users)
- 8.1.3. Small Enterprises(1-499 Users)
- 8.2. Market Analysis, Insights and Forecast - by Types
- 8.2.1. Cloud-based
- 8.2.2. On-premises
- 8.1. Market Analysis, Insights and Forecast - by Application
- 9. Europe Warranty Management Software Analysis, Insights and Forecast, 2020-2032
- 9.1. Market Analysis, Insights and Forecast - by Application
- 9.1.1. Large Enterprises(1000+ Users)
- 9.1.2. Medium-Sized Enterprise(499-1000 Users)
- 9.1.3. Small Enterprises(1-499 Users)
- 9.2. Market Analysis, Insights and Forecast - by Types
- 9.2.1. Cloud-based
- 9.2.2. On-premises
- 9.1. Market Analysis, Insights and Forecast - by Application
- 10. Middle East & Africa Warranty Management Software Analysis, Insights and Forecast, 2020-2032
- 10.1. Market Analysis, Insights and Forecast - by Application
- 10.1.1. Large Enterprises(1000+ Users)
- 10.1.2. Medium-Sized Enterprise(499-1000 Users)
- 10.1.3. Small Enterprises(1-499 Users)
- 10.2. Market Analysis, Insights and Forecast - by Types
- 10.2.1. Cloud-based
- 10.2.2. On-premises
- 10.1. Market Analysis, Insights and Forecast - by Application
- 11. Asia Pacific Warranty Management Software Analysis, Insights and Forecast, 2020-2032
- 11.1. Market Analysis, Insights and Forecast - by Application
- 11.1.1. Large Enterprises(1000+ Users)
- 11.1.2. Medium-Sized Enterprise(499-1000 Users)
- 11.1.3. Small Enterprises(1-499 Users)
- 11.2. Market Analysis, Insights and Forecast - by Types
- 11.2.1. Cloud-based
- 11.2.2. On-premises
- 11.1. Market Analysis, Insights and Forecast - by Application
- 12. Competitive Analysis
- 12.1. Company Profiles
- 12.1.1 FieldEZ Technologies
- 12.1.1.1. Company Overview
- 12.1.1.2. Products
- 12.1.1.3. Company Financials
- 12.1.1.4. SWOT Analysis
- 12.1.2 Metasystems
- 12.1.2.1. Company Overview
- 12.1.2.2. Products
- 12.1.2.3. Company Financials
- 12.1.2.4. SWOT Analysis
- 12.1.3 Renewity Systems
- 12.1.3.1. Company Overview
- 12.1.3.2. Products
- 12.1.3.3. Company Financials
- 12.1.3.4. SWOT Analysis
- 12.1.4 ServicePower
- 12.1.4.1. Company Overview
- 12.1.4.2. Products
- 12.1.4.3. Company Financials
- 12.1.4.4. SWOT Analysis
- 12.1.5 SalesBabu Business Solutions
- 12.1.5.1. Company Overview
- 12.1.5.2. Products
- 12.1.5.3. Company Financials
- 12.1.5.4. SWOT Analysis
- 12.1.6 Zed-Axis Technologies
- 12.1.6.1. Company Overview
- 12.1.6.2. Products
- 12.1.6.3. Company Financials
- 12.1.6.4. SWOT Analysis
- 12.1.7 Service Software
- 12.1.7.1. Company Overview
- 12.1.7.2. Products
- 12.1.7.3. Company Financials
- 12.1.7.4. SWOT Analysis
- 12.1.8 Mize
- 12.1.8.1. Company Overview
- 12.1.8.2. Products
- 12.1.8.3. Company Financials
- 12.1.8.4. SWOT Analysis
- 12.1.9 Tavant Technologies
- 12.1.9.1. Company Overview
- 12.1.9.2. Products
- 12.1.9.3. Company Financials
- 12.1.9.4. SWOT Analysis
- 12.1.10 Evia Information Systems
- 12.1.10.1. Company Overview
- 12.1.10.2. Products
- 12.1.10.3. Company Financials
- 12.1.10.4. SWOT Analysis
- 12.1.11 DealersCircle
- 12.1.11.1. Company Overview
- 12.1.11.2. Products
- 12.1.11.3. Company Financials
- 12.1.11.4. SWOT Analysis
- 12.1.12 ServiceCentral Technologies
- 12.1.12.1. Company Overview
- 12.1.12.2. Products
- 12.1.12.3. Company Financials
- 12.1.12.4. SWOT Analysis
- 12.1.13 Warranty Master Software
- 12.1.13.1. Company Overview
- 12.1.13.2. Products
- 12.1.13.3. Company Financials
- 12.1.13.4. SWOT Analysis
- 12.1.14 Infozech Software
- 12.1.14.1. Company Overview
- 12.1.14.2. Products
- 12.1.14.3. Company Financials
- 12.1.14.4. SWOT Analysis
- 12.1.1 FieldEZ Technologies
- 12.2. Market Entropy
- 12.2.1 Company's Key Areas Served
- 12.2.2 Recent Developments
- 12.3. Company Market Share Analysis 2025
- 12.3.1 Top 5 Companies Market Share Analysis
- 12.3.2 Top 3 Companies Market Share Analysis
- 12.4. List of Potential Customers
- 13. Research Methodology
List of Figures
- Figure 1: Global Warranty Management Software Revenue Breakdown (billion, %) by Region 2025 & 2033
- Figure 2: North America Warranty Management Software Revenue (billion), by Application 2025 & 2033
- Figure 3: North America Warranty Management Software Revenue Share (%), by Application 2025 & 2033
- Figure 4: North America Warranty Management Software Revenue (billion), by Types 2025 & 2033
- Figure 5: North America Warranty Management Software Revenue Share (%), by Types 2025 & 2033
- Figure 6: North America Warranty Management Software Revenue (billion), by Country 2025 & 2033
- Figure 7: North America Warranty Management Software Revenue Share (%), by Country 2025 & 2033
- Figure 8: South America Warranty Management Software Revenue (billion), by Application 2025 & 2033
- Figure 9: South America Warranty Management Software Revenue Share (%), by Application 2025 & 2033
- Figure 10: South America Warranty Management Software Revenue (billion), by Types 2025 & 2033
- Figure 11: South America Warranty Management Software Revenue Share (%), by Types 2025 & 2033
- Figure 12: South America Warranty Management Software Revenue (billion), by Country 2025 & 2033
- Figure 13: South America Warranty Management Software Revenue Share (%), by Country 2025 & 2033
- Figure 14: Europe Warranty Management Software Revenue (billion), by Application 2025 & 2033
- Figure 15: Europe Warranty Management Software Revenue Share (%), by Application 2025 & 2033
- Figure 16: Europe Warranty Management Software Revenue (billion), by Types 2025 & 2033
- Figure 17: Europe Warranty Management Software Revenue Share (%), by Types 2025 & 2033
- Figure 18: Europe Warranty Management Software Revenue (billion), by Country 2025 & 2033
- Figure 19: Europe Warranty Management Software Revenue Share (%), by Country 2025 & 2033
- Figure 20: Middle East & Africa Warranty Management Software Revenue (billion), by Application 2025 & 2033
- Figure 21: Middle East & Africa Warranty Management Software Revenue Share (%), by Application 2025 & 2033
- Figure 22: Middle East & Africa Warranty Management Software Revenue (billion), by Types 2025 & 2033
- Figure 23: Middle East & Africa Warranty Management Software Revenue Share (%), by Types 2025 & 2033
- Figure 24: Middle East & Africa Warranty Management Software Revenue (billion), by Country 2025 & 2033
- Figure 25: Middle East & Africa Warranty Management Software Revenue Share (%), by Country 2025 & 2033
- Figure 26: Asia Pacific Warranty Management Software Revenue (billion), by Application 2025 & 2033
- Figure 27: Asia Pacific Warranty Management Software Revenue Share (%), by Application 2025 & 2033
- Figure 28: Asia Pacific Warranty Management Software Revenue (billion), by Types 2025 & 2033
- Figure 29: Asia Pacific Warranty Management Software Revenue Share (%), by Types 2025 & 2033
- Figure 30: Asia Pacific Warranty Management Software Revenue (billion), by Country 2025 & 2033
- Figure 31: Asia Pacific Warranty Management Software Revenue Share (%), by Country 2025 & 2033
List of Tables
- Table 1: Global Warranty Management Software Revenue billion Forecast, by Application 2020 & 2033
- Table 2: Global Warranty Management Software Revenue billion Forecast, by Types 2020 & 2033
- Table 3: Global Warranty Management Software Revenue billion Forecast, by Region 2020 & 2033
- Table 4: Global Warranty Management Software Revenue billion Forecast, by Application 2020 & 2033
- Table 5: Global Warranty Management Software Revenue billion Forecast, by Types 2020 & 2033
- Table 6: Global Warranty Management Software Revenue billion Forecast, by Country 2020 & 2033
- Table 7: United States Warranty Management Software Revenue (billion) Forecast, by Application 2020 & 2033
- Table 8: Canada Warranty Management Software Revenue (billion) Forecast, by Application 2020 & 2033
- Table 9: Mexico Warranty Management Software Revenue (billion) Forecast, by Application 2020 & 2033
- Table 10: Global Warranty Management Software Revenue billion Forecast, by Application 2020 & 2033
- Table 11: Global Warranty Management Software Revenue billion Forecast, by Types 2020 & 2033
- Table 12: Global Warranty Management Software Revenue billion Forecast, by Country 2020 & 2033
- Table 13: Brazil Warranty Management Software Revenue (billion) Forecast, by Application 2020 & 2033
- Table 14: Argentina Warranty Management Software Revenue (billion) Forecast, by Application 2020 & 2033
- Table 15: Rest of South America Warranty Management Software Revenue (billion) Forecast, by Application 2020 & 2033
- Table 16: Global Warranty Management Software Revenue billion Forecast, by Application 2020 & 2033
- Table 17: Global Warranty Management Software Revenue billion Forecast, by Types 2020 & 2033
- Table 18: Global Warranty Management Software Revenue billion Forecast, by Country 2020 & 2033
- Table 19: United Kingdom Warranty Management Software Revenue (billion) Forecast, by Application 2020 & 2033
- Table 20: Germany Warranty Management Software Revenue (billion) Forecast, by Application 2020 & 2033
- Table 21: France Warranty Management Software Revenue (billion) Forecast, by Application 2020 & 2033
- Table 22: Italy Warranty Management Software Revenue (billion) Forecast, by Application 2020 & 2033
- Table 23: Spain Warranty Management Software Revenue (billion) Forecast, by Application 2020 & 2033
- Table 24: Russia Warranty Management Software Revenue (billion) Forecast, by Application 2020 & 2033
- Table 25: Benelux Warranty Management Software Revenue (billion) Forecast, by Application 2020 & 2033
- Table 26: Nordics Warranty Management Software Revenue (billion) Forecast, by Application 2020 & 2033
- Table 27: Rest of Europe Warranty Management Software Revenue (billion) Forecast, by Application 2020 & 2033
- Table 28: Global Warranty Management Software Revenue billion Forecast, by Application 2020 & 2033
- Table 29: Global Warranty Management Software Revenue billion Forecast, by Types 2020 & 2033
- Table 30: Global Warranty Management Software Revenue billion Forecast, by Country 2020 & 2033
- Table 31: Turkey Warranty Management Software Revenue (billion) Forecast, by Application 2020 & 2033
- Table 32: Israel Warranty Management Software Revenue (billion) Forecast, by Application 2020 & 2033
- Table 33: GCC Warranty Management Software Revenue (billion) Forecast, by Application 2020 & 2033
- Table 34: North Africa Warranty Management Software Revenue (billion) Forecast, by Application 2020 & 2033
- Table 35: South Africa Warranty Management Software Revenue (billion) Forecast, by Application 2020 & 2033
- Table 36: Rest of Middle East & Africa Warranty Management Software Revenue (billion) Forecast, by Application 2020 & 2033
- Table 37: Global Warranty Management Software Revenue billion Forecast, by Application 2020 & 2033
- Table 38: Global Warranty Management Software Revenue billion Forecast, by Types 2020 & 2033
- Table 39: Global Warranty Management Software Revenue billion Forecast, by Country 2020 & 2033
- Table 40: China Warranty Management Software Revenue (billion) Forecast, by Application 2020 & 2033
- Table 41: India Warranty Management Software Revenue (billion) Forecast, by Application 2020 & 2033
- Table 42: Japan Warranty Management Software Revenue (billion) Forecast, by Application 2020 & 2033
- Table 43: South Korea Warranty Management Software Revenue (billion) Forecast, by Application 2020 & 2033
- Table 44: ASEAN Warranty Management Software Revenue (billion) Forecast, by Application 2020 & 2033
- Table 45: Oceania Warranty Management Software Revenue (billion) Forecast, by Application 2020 & 2033
- Table 46: Rest of Asia Pacific Warranty Management Software Revenue (billion) Forecast, by Application 2020 & 2033
Frequently Asked Questions
1. What is the projected Compound Annual Growth Rate (CAGR) of the Warranty Management Software?
The projected CAGR is approximately 17.12%.
2. Which companies are prominent players in the Warranty Management Software?
Key companies in the market include FieldEZ Technologies, Metasystems, Renewity Systems, ServicePower, SalesBabu Business Solutions, Zed-Axis Technologies, Service Software, Mize, Tavant Technologies, Evia Information Systems, DealersCircle, ServiceCentral Technologies, Warranty Master Software, Infozech Software.
3. What are the main segments of the Warranty Management Software?
The market segments include Application, Types.
4. Can you provide details about the market size?
The market size is estimated to be USD 5.78 billion as of 2022.
5. What are some drivers contributing to market growth?
N/A
6. What are the notable trends driving market growth?
N/A
7. Are there any restraints impacting market growth?
N/A
8. Can you provide examples of recent developments in the market?
N/A
9. What pricing options are available for accessing the report?
Pricing options include single-user, multi-user, and enterprise licenses priced at USD 4900.00, USD 7350.00, and USD 9800.00 respectively.
10. Is the market size provided in terms of value or volume?
The market size is provided in terms of value, measured in billion.
11. Are there any specific market keywords associated with the report?
Yes, the market keyword associated with the report is "Warranty Management Software," which aids in identifying and referencing the specific market segment covered.
12. How do I determine which pricing option suits my needs best?
The pricing options vary based on user requirements and access needs. Individual users may opt for single-user licenses, while businesses requiring broader access may choose multi-user or enterprise licenses for cost-effective access to the report.
13. Are there any additional resources or data provided in the Warranty Management Software report?
While the report offers comprehensive insights, it's advisable to review the specific contents or supplementary materials provided to ascertain if additional resources or data are available.
14. How can I stay updated on further developments or reports in the Warranty Management Software?
To stay informed about further developments, trends, and reports in the Warranty Management Software, consider subscribing to industry newsletters, following relevant companies and organizations, or regularly checking reputable industry news sources and publications.
Methodology
Step 1 - Identification of Relevant Samples Size from Population Database


Step 2 - Approaches for Defining Global Market Size (Value, Volume* & Price*)

Note*: In applicable scenarios
Step 3 - Data Sources
Primary Research
- Web Analytics
- Survey Reports
- Research Institute
- Latest Research Reports
- Opinion Leaders
Secondary Research
- Annual Reports
- White Paper
- Latest Press Release
- Industry Association
- Paid Database
- Investor Presentations

Step 4 - Data Triangulation
Involves using different sources of information in order to increase the validity of a study
These sources are likely to be stakeholders in a program - participants, other researchers, program staff, other community members, and so on.
Then we put all data in single framework & apply various statistical tools to find out the dynamic on the market.
During the analysis stage, feedback from the stakeholder groups would be compared to determine areas of agreement as well as areas of divergence