Key Insights
The global Waste Grease Recovery market is projected to reach $1.37 billion by 2025, with a Compound Annual Growth Rate (CAGR) of 2.25% during the 2025-2033 forecast period. This expansion is driven by the increasing demand for sustainable fuel alternatives and stricter environmental regulations promoting recycled materials. Key growth sectors include biodiesel and Sustainable Aviation Fuel (SAF) production, utilizing waste grease as a vital feedstock. As energy security and carbon footprint reduction become paramount, waste grease recovery is integral to the circular economy, transforming waste into a valuable resource.
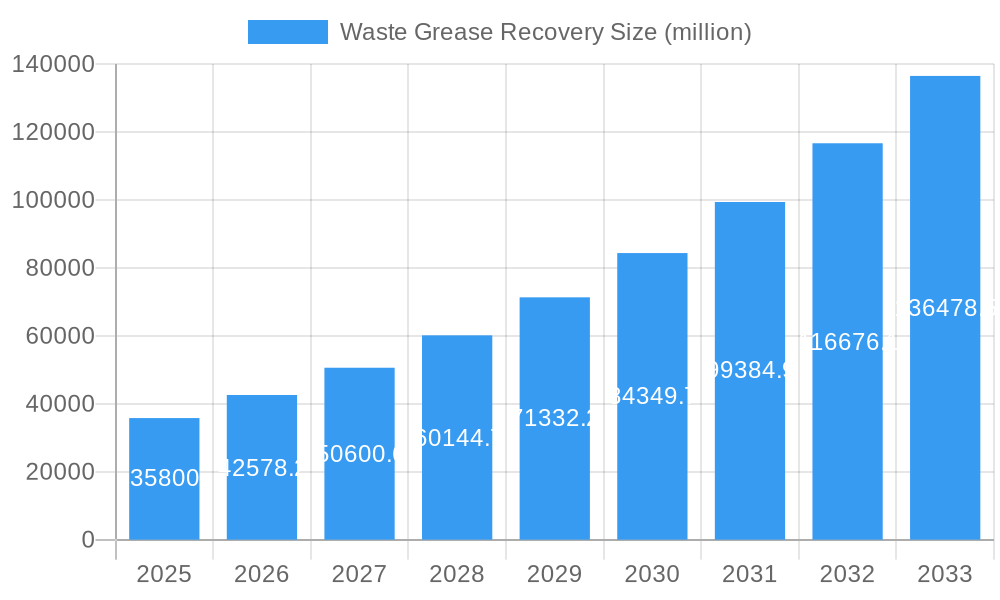
Waste Grease Recovery Market Size (In Billion)
The market is segmented by application into Biodiesel Production, SAF Production, and Others, with biodiesel and SAF leading consumption. Major sources include Non-cooking Waste Oils and Fats, and Cooking Waste Oils and Fats, the latter being more accessible. Geographically, the Asia Pacific region, led by China and India, is expected to experience significant growth due to rapid industrialization and a focus on renewable energy. Europe and North America are also crucial markets, supported by stringent environmental policies and advanced waste management systems. Leading companies such as Neste, Darling Ingredients, and Chevron Renewable Energy Group are investing in R&D, capacity expansion, and strategic partnerships.
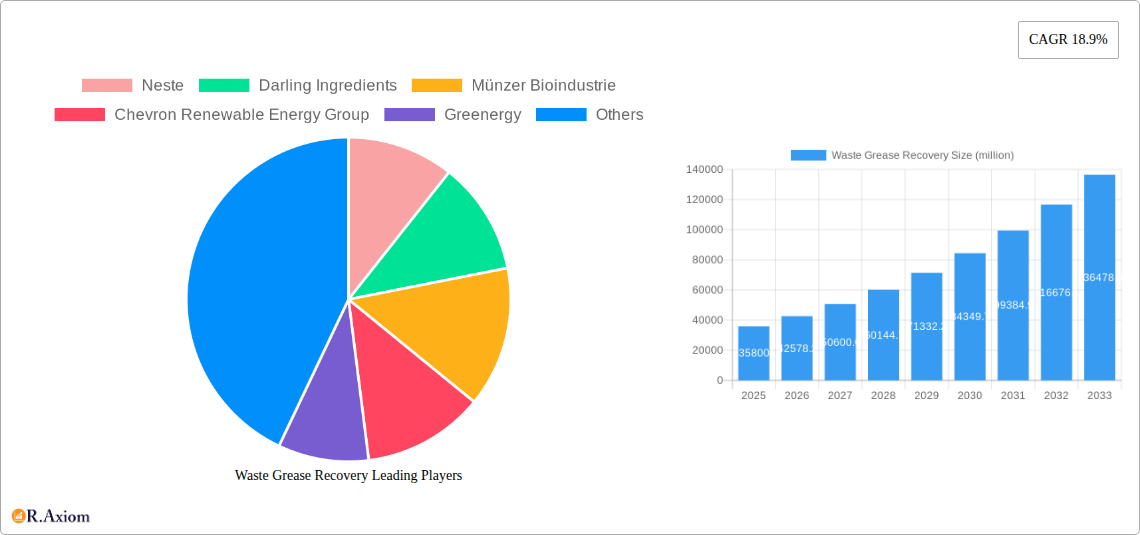
Waste Grease Recovery Company Market Share
This report offers a comprehensive analysis of the global Waste Grease Recovery market, including historical data, current trends, and future projections up to 2033. It examines key applications such as Biodiesel Production and SAF Production, and types including Non-cooking Waste Oils and Fats and Cooking Waste Oils and Fats, providing actionable insights for stakeholders. With a base year of 2025, the report covers market dynamics, technological advancements, regulatory frameworks, and competitive strategies of key players like Neste, Darling Ingredients, and Chevron Renewable Energy Group.
Waste Grease Recovery Market Concentration & Innovation
The Waste Grease Recovery market exhibits a moderate to high concentration, with a few major players like Neste and Darling Ingredients holding significant market share, estimated at over 20 million and 15 million units of processed grease respectively in 2025. However, the landscape is increasingly dynamic with the emergence of specialized regional players and technological innovators. Innovation in waste grease recovery is primarily driven by the demand for sustainable fuel alternatives and advancements in refining and processing technologies. Regulatory frameworks, such as renewable fuel mandates and carbon emission reduction targets, are crucial drivers, encouraging investment and the adoption of efficient recovery methods. Product substitutes, while present in the form of virgin oils and fats, are increasingly less competitive due to rising fossil fuel prices and growing environmental consciousness. End-user trends are clearly leaning towards higher demand for biofuels, especially SAF, pushing for more efficient and scalable waste grease processing. Merger and Acquisition (M&A) activities are on the rise, with recent deals valued in the hundreds of millions, indicating consolidation and strategic expansion as companies seek to secure feedstock and expand processing capacities. For instance, an M&A deal valued at approximately 300 million in 2023 significantly impacted regional market dynamics.
Waste Grease Recovery Industry Trends & Insights
The Waste Grease Recovery industry is experiencing robust growth, propelled by escalating global demand for renewable energy and stringent environmental regulations. The market is projected to witness a Compound Annual Growth Rate (CAGR) of approximately 7.5% over the forecast period, driven by advancements in processing technologies and increasing awareness regarding the environmental benefits of utilizing waste grease. The market penetration of waste grease-derived biofuels is steadily increasing, particularly in regions with strong governmental support and established biofuel infrastructure. Technological disruptions, such as improved pre-treatment processes and more efficient transesterification methods, are enhancing the economic viability and scalability of waste grease recovery. Consumer preferences are shifting towards sustainable products and services, with a growing segment of the population willing to support businesses that demonstrate environmental responsibility. This trend is further amplified by corporate sustainability initiatives and the push for circular economy models. Competitive dynamics are characterized by strategic partnerships between waste collectors, processing facilities, and biofuel producers, aiming to create integrated value chains. Companies are investing heavily in research and development to optimize extraction yields, reduce processing costs, and enhance the quality of recovered grease for diverse applications. The increasing scarcity and fluctuating prices of traditional fossil fuels also act as significant catalysts, making waste grease a more attractive and cost-effective alternative feedstock. The growing emphasis on reducing greenhouse gas emissions across various sectors, including transportation and manufacturing, further fuels the demand for sustainable alternatives, positioning waste grease recovery at the forefront of the bioeconomy. The global market size for waste grease recovery is projected to reach over 100 million metric tons by 2033, a substantial increase from an estimated 45 million metric tons in 2025.
Dominant Markets & Segments in Waste Grease Recovery
The Biodiesel Production segment is currently the dominant application in the Waste Grease Recovery market, accounting for over 65% of the total market volume in 2025, estimated at 30 million metric tons. This dominance is fueled by well-established infrastructure for biodiesel blending and consumption, supported by favorable government policies and mandates in key regions like North America and Europe. The economic policies that incentivize the use of renewable fuels, such as tax credits and renewable volume obligations, play a pivotal role in driving this segment's growth.
Cooking Waste Oils and Fats represent the largest type segment, contributing approximately 70% to the overall waste grease feedstock in 2025, estimated at 35 million metric tons. This is attributed to the widespread availability of used cooking oil from household and commercial sources. Infrastructure for collection and initial processing of used cooking oil is more developed in many parts of the world, making it a readily accessible feedstock.
Sustainable Aviation Fuel (SAF) Production is an emerging and rapidly growing segment, projected to witness the highest CAGR of over 15% during the forecast period. While its current market share is smaller, estimated at around 10 million metric tons in 2025, its potential for significant expansion is immense, driven by the aviation industry's commitment to decarbonization. Stricter emissions regulations for the aviation sector and advancements in HEFA (Hydroprocessed Esters and Fatty Acids) technology are key drivers for this segment.
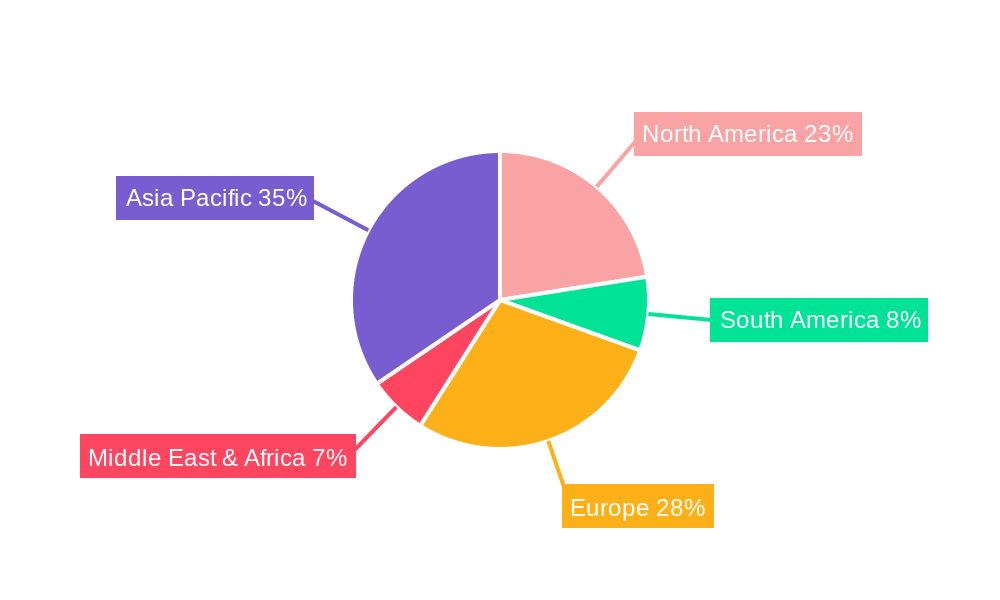
Geographically, Europe currently leads the Waste Grease Recovery market, holding an estimated 35% market share in 2025. This leadership is attributed to stringent environmental regulations, ambitious renewable energy targets, and a well-developed network of biofuel producers. Countries like Germany, France, and the Netherlands are at the forefront of waste grease valorization. North America follows closely, with significant investments in biodiesel and an emerging interest in SAF production.
The Other application segment, encompassing industrial lubricants, animal feed additives, and chemical feedstock, currently represents a smaller but stable portion of the market, estimated at 5 million metric tons in 2025. Growth in this segment is linked to specific industrial demands and the development of niche applications for recovered grease components.
Waste Grease Recovery Product Developments
Product developments in waste grease recovery are centered on enhancing efficiency and expanding application possibilities. Innovations focus on advanced pretreatment methods to remove impurities, thereby improving the quality of recovered grease for biodiesel and SAF production. Companies are developing more energy-efficient refining processes and catalysts that lower production costs and environmental impact. The competitive advantage lies in achieving higher yields of high-purity feedstock suitable for demanding applications like aviation fuels.
Report Scope & Segmentation Analysis
This report segments the Waste Grease Recovery market by Application and Type. The Biodiesel Production segment, projected to reach over 50 million metric tons by 2033, is driven by existing infrastructure and supportive policies. SAF Production, expected to grow at a CAGR exceeding 15%, is a key growth area, driven by the aviation industry's decarbonization goals. The Others segment, encompassing various industrial uses, is forecast to grow steadily at an estimated 5% CAGR. In terms of Type, Non-cooking Waste Oils and Fats contribute significantly to feedstock availability, while Cooking Waste Oils and Fats remain the dominant source, with projections indicating continued strong demand.
Key Drivers of Waste Grease Recovery Growth
Key drivers for the Waste Grease Recovery market include stringent government mandates and incentives promoting the use of renewable fuels, such as renewable portfolio standards and carbon pricing mechanisms. Technological advancements in processing and refining techniques are continuously improving efficiency and reducing operational costs, making waste grease a more economically viable feedstock. The growing global commitment to sustainability and the circular economy principles are creating a strong demand for recycled and renewable materials. Furthermore, the increasing price volatility and environmental concerns associated with fossil fuels are pushing industries to seek alternative energy sources, with waste grease positioned as a readily available and sustainable option.
Challenges in the Waste Grease Recovery Sector
Challenges in the Waste Grease Recovery sector include the inconsistent quality and availability of feedstock, which can vary significantly based on collection infrastructure and regional practices. Stringent and sometimes fragmented regulatory frameworks across different geographies can pose compliance hurdles for companies operating internationally. The capital-intensive nature of advanced processing facilities requires substantial investment, potentially limiting the entry of smaller players. Furthermore, competition from other renewable feedstock sources, as well as the established infrastructure for fossil fuels, presents ongoing competitive pressures. Supply chain logistics for efficient collection and transportation of waste grease also remain a critical challenge.
Emerging Opportunities in Waste Grease Recovery
Emerging opportunities in the Waste Grease Recovery sector lie in the rapidly expanding market for Sustainable Aviation Fuel (SAF), which offers significant growth potential driven by the aviation industry's decarbonization targets. Advancements in biochemical conversion technologies are opening up new avenues for producing higher-value chemicals and materials from waste grease. Developing advanced collection and purification technologies can unlock new sources of feedstock and improve overall process efficiency. Furthermore, expanding into emerging economies with growing industrial bases and increasing environmental awareness presents significant market expansion opportunities. The development of integrated biorefineries capable of producing multiple bio-based products from waste grease also represents a promising avenue for value creation.
Leading Players in the Waste Grease Recovery Market
- Neste
- Darling Ingredients
- Münzer Bioindustrie
- Chevron Renewable Energy Group
- Greenergy
- SunOil
- Veolia
- Olleco
- Shandong Hi-Speed Renewable Energy
- Fujian Zhongyu Energy
- Jiaao Enprotech
- Beijing Haidian New Energy Technology
- Suzhou Fengbei Biotech
- Longhai Bioenergy
- Hebei Jingu
- Tangshan Jinlihai Biodiesel
- Hubei Bimei New Energy Technology
- Zhongqi Group
- Jingzhou Dadi Bioengineering
Key Developments in Waste Grease Recovery Industry
- 2023: Neste announced a significant investment in expanding its SAF production capacity, signaling strong market confidence.
- 2023: Darling Ingredients completed a major acquisition, bolstering its feedstock sourcing and processing capabilities in North America.
- 2022: Chevron Renewable Energy Group partnered with an airline to secure long-term supply of SAF, highlighting growing industry collaboration.
- 2022: Münzer Bioindustrie launched a new advanced processing facility in Europe, focusing on higher-purity recovered grease.
- 2021: Greenergy expanded its biodiesel production, incorporating a higher percentage of waste-derived feedstock.
- 2021: Veolia focused on developing innovative waste valorization solutions, including grease-to-energy projects.
- 2020: Olleco invested in new technologies to improve the efficiency of cooking oil recovery for biofuel production.
- 2020: Shandong Hi-Speed Renewable Energy expanded its biodiesel operations, leveraging regional waste streams.
Strategic Outlook for Waste Grease Recovery Market
The strategic outlook for the Waste Grease Recovery market is overwhelmingly positive, driven by a confluence of environmental imperatives, technological advancements, and supportive policy frameworks. The increasing global demand for sustainable fuels, particularly SAF, presents a substantial growth catalyst. Companies that invest in optimizing their feedstock sourcing, enhancing processing efficiencies, and developing innovative applications for recovered grease will be well-positioned for success. Strategic partnerships and vertical integration across the value chain, from collection to end-product utilization, will be crucial for securing market share and mitigating supply chain risks. The continuous evolution of regulatory landscapes and the growing consumer preference for eco-friendly products will further solidify waste grease recovery's role as a vital component of the future bioeconomy.
Waste Grease Recovery Segmentation
-
1. Application
- 1.1. Biodiesel Production
- 1.2. SAF Production
- 1.3. Others
-
2. Type
- 2.1. Non-cooking Waste Oils and Fats
- 2.2. Cooking Waste Oils and Fats
Waste Grease Recovery Segmentation By Geography
-
1. North America
- 1.1. United States
- 1.2. Canada
- 1.3. Mexico
-
2. South America
- 2.1. Brazil
- 2.2. Argentina
- 2.3. Rest of South America
-
3. Europe
- 3.1. United Kingdom
- 3.2. Germany
- 3.3. France
- 3.4. Italy
- 3.5. Spain
- 3.6. Russia
- 3.7. Benelux
- 3.8. Nordics
- 3.9. Rest of Europe
-
4. Middle East & Africa
- 4.1. Turkey
- 4.2. Israel
- 4.3. GCC
- 4.4. North Africa
- 4.5. South Africa
- 4.6. Rest of Middle East & Africa
-
5. Asia Pacific
- 5.1. China
- 5.2. India
- 5.3. Japan
- 5.4. South Korea
- 5.5. ASEAN
- 5.6. Oceania
- 5.7. Rest of Asia Pacific
Waste Grease Recovery Regional Market Share
Geographic Coverage of Waste Grease Recovery
Waste Grease Recovery REPORT HIGHLIGHTS
| Aspects | Details |
|---|---|
| Study Period | 2020-2034 |
| Base Year | 2025 |
| Estimated Year | 2026 |
| Forecast Period | 2026-2034 |
| Historical Period | 2020-2025 |
| Growth Rate | CAGR of 2.25% from 2020-2034 |
| Segmentation |
|
Table of Contents
- 1. Introduction
- 1.1. Research Scope
- 1.2. Market Segmentation
- 1.3. Research Objective
- 1.4. Definitions and Assumptions
- 2. Executive Summary
- 2.1. Market Snapshot
- 3. Market Dynamics
- 3.1. Market Drivers
- 3.2. Market Restrains
- 3.3. Market Trends
- 3.4. Market Opportunities
- 4. Market Factor Analysis
- 4.1. Porters Five Forces
- 4.1.1. Bargaining Power of Suppliers
- 4.1.2. Bargaining Power of Buyers
- 4.1.3. Threat of New Entrants
- 4.1.4. Threat of Substitutes
- 4.1.5. Competitive Rivalry
- 4.2. PESTEL analysis
- 4.3. BCG Analysis
- 4.3.1. Stars (High Growth, High Market Share)
- 4.3.2. Cash Cows (Low Growth, High Market Share)
- 4.3.3. Question Mark (High Growth, Low Market Share)
- 4.3.4. Dogs (Low Growth, Low Market Share)
- 4.4. Ansoff Matrix Analysis
- 4.5. Supply Chain Analysis
- 4.6. Regulatory Landscape
- 4.7. Current Market Potential and Opportunity Assessment (TAM–SAM–SOM Framework)
- 4.8. RAX Analyst Note
- 4.1. Porters Five Forces
- 5. Market Analysis, Insights and Forecast 2021-2033
- 5.1. Market Analysis, Insights and Forecast - by Application
- 5.1.1. Biodiesel Production
- 5.1.2. SAF Production
- 5.1.3. Others
- 5.2. Market Analysis, Insights and Forecast - by Type
- 5.2.1. Non-cooking Waste Oils and Fats
- 5.2.2. Cooking Waste Oils and Fats
- 5.3. Market Analysis, Insights and Forecast - by Region
- 5.3.1. North America
- 5.3.2. South America
- 5.3.3. Europe
- 5.3.4. Middle East & Africa
- 5.3.5. Asia Pacific
- 5.1. Market Analysis, Insights and Forecast - by Application
- 6. Global Waste Grease Recovery Analysis, Insights and Forecast, 2021-2033
- 6.1. Market Analysis, Insights and Forecast - by Application
- 6.1.1. Biodiesel Production
- 6.1.2. SAF Production
- 6.1.3. Others
- 6.2. Market Analysis, Insights and Forecast - by Type
- 6.2.1. Non-cooking Waste Oils and Fats
- 6.2.2. Cooking Waste Oils and Fats
- 6.1. Market Analysis, Insights and Forecast - by Application
- 7. North America Waste Grease Recovery Analysis, Insights and Forecast, 2020-2032
- 7.1. Market Analysis, Insights and Forecast - by Application
- 7.1.1. Biodiesel Production
- 7.1.2. SAF Production
- 7.1.3. Others
- 7.2. Market Analysis, Insights and Forecast - by Type
- 7.2.1. Non-cooking Waste Oils and Fats
- 7.2.2. Cooking Waste Oils and Fats
- 7.1. Market Analysis, Insights and Forecast - by Application
- 8. South America Waste Grease Recovery Analysis, Insights and Forecast, 2020-2032
- 8.1. Market Analysis, Insights and Forecast - by Application
- 8.1.1. Biodiesel Production
- 8.1.2. SAF Production
- 8.1.3. Others
- 8.2. Market Analysis, Insights and Forecast - by Type
- 8.2.1. Non-cooking Waste Oils and Fats
- 8.2.2. Cooking Waste Oils and Fats
- 8.1. Market Analysis, Insights and Forecast - by Application
- 9. Europe Waste Grease Recovery Analysis, Insights and Forecast, 2020-2032
- 9.1. Market Analysis, Insights and Forecast - by Application
- 9.1.1. Biodiesel Production
- 9.1.2. SAF Production
- 9.1.3. Others
- 9.2. Market Analysis, Insights and Forecast - by Type
- 9.2.1. Non-cooking Waste Oils and Fats
- 9.2.2. Cooking Waste Oils and Fats
- 9.1. Market Analysis, Insights and Forecast - by Application
- 10. Middle East & Africa Waste Grease Recovery Analysis, Insights and Forecast, 2020-2032
- 10.1. Market Analysis, Insights and Forecast - by Application
- 10.1.1. Biodiesel Production
- 10.1.2. SAF Production
- 10.1.3. Others
- 10.2. Market Analysis, Insights and Forecast - by Type
- 10.2.1. Non-cooking Waste Oils and Fats
- 10.2.2. Cooking Waste Oils and Fats
- 10.1. Market Analysis, Insights and Forecast - by Application
- 11. Asia Pacific Waste Grease Recovery Analysis, Insights and Forecast, 2020-2032
- 11.1. Market Analysis, Insights and Forecast - by Application
- 11.1.1. Biodiesel Production
- 11.1.2. SAF Production
- 11.1.3. Others
- 11.2. Market Analysis, Insights and Forecast - by Type
- 11.2.1. Non-cooking Waste Oils and Fats
- 11.2.2. Cooking Waste Oils and Fats
- 11.1. Market Analysis, Insights and Forecast - by Application
- 12. Competitive Analysis
- 12.1. Company Profiles
- 12.1.1 Neste
- 12.1.1.1. Company Overview
- 12.1.1.2. Products
- 12.1.1.3. Company Financials
- 12.1.1.4. SWOT Analysis
- 12.1.2 Darling Ingredients
- 12.1.2.1. Company Overview
- 12.1.2.2. Products
- 12.1.2.3. Company Financials
- 12.1.2.4. SWOT Analysis
- 12.1.3 Münzer Bioindustrie
- 12.1.3.1. Company Overview
- 12.1.3.2. Products
- 12.1.3.3. Company Financials
- 12.1.3.4. SWOT Analysis
- 12.1.4 Chevron Renewable Energy Group
- 12.1.4.1. Company Overview
- 12.1.4.2. Products
- 12.1.4.3. Company Financials
- 12.1.4.4. SWOT Analysis
- 12.1.5 Greenergy
- 12.1.5.1. Company Overview
- 12.1.5.2. Products
- 12.1.5.3. Company Financials
- 12.1.5.4. SWOT Analysis
- 12.1.6 SunOil
- 12.1.6.1. Company Overview
- 12.1.6.2. Products
- 12.1.6.3. Company Financials
- 12.1.6.4. SWOT Analysis
- 12.1.7 Veolia
- 12.1.7.1. Company Overview
- 12.1.7.2. Products
- 12.1.7.3. Company Financials
- 12.1.7.4. SWOT Analysis
- 12.1.8 Olleco
- 12.1.8.1. Company Overview
- 12.1.8.2. Products
- 12.1.8.3. Company Financials
- 12.1.8.4. SWOT Analysis
- 12.1.9 Shandong Hi-Speed Renewable Energy
- 12.1.9.1. Company Overview
- 12.1.9.2. Products
- 12.1.9.3. Company Financials
- 12.1.9.4. SWOT Analysis
- 12.1.10 Fujian Zhongyu Energy
- 12.1.10.1. Company Overview
- 12.1.10.2. Products
- 12.1.10.3. Company Financials
- 12.1.10.4. SWOT Analysis
- 12.1.11 Jiaao Enprotech
- 12.1.11.1. Company Overview
- 12.1.11.2. Products
- 12.1.11.3. Company Financials
- 12.1.11.4. SWOT Analysis
- 12.1.12 Beijing Haidian New Energy Technology
- 12.1.12.1. Company Overview
- 12.1.12.2. Products
- 12.1.12.3. Company Financials
- 12.1.12.4. SWOT Analysis
- 12.1.13 Suzhou Fengbei Biotech
- 12.1.13.1. Company Overview
- 12.1.13.2. Products
- 12.1.13.3. Company Financials
- 12.1.13.4. SWOT Analysis
- 12.1.14 Longhai Bioenergy
- 12.1.14.1. Company Overview
- 12.1.14.2. Products
- 12.1.14.3. Company Financials
- 12.1.14.4. SWOT Analysis
- 12.1.15 Hebei Jingu
- 12.1.15.1. Company Overview
- 12.1.15.2. Products
- 12.1.15.3. Company Financials
- 12.1.15.4. SWOT Analysis
- 12.1.16 Tangshan Jinlihai Biodiesel
- 12.1.16.1. Company Overview
- 12.1.16.2. Products
- 12.1.16.3. Company Financials
- 12.1.16.4. SWOT Analysis
- 12.1.17 Hubei Bimei New Energy Technology
- 12.1.17.1. Company Overview
- 12.1.17.2. Products
- 12.1.17.3. Company Financials
- 12.1.17.4. SWOT Analysis
- 12.1.18 Zhongqi Group
- 12.1.18.1. Company Overview
- 12.1.18.2. Products
- 12.1.18.3. Company Financials
- 12.1.18.4. SWOT Analysis
- 12.1.19 Jingzhou Dadi Bioengineering
- 12.1.19.1. Company Overview
- 12.1.19.2. Products
- 12.1.19.3. Company Financials
- 12.1.19.4. SWOT Analysis
- 12.1.1 Neste
- 12.2. Market Entropy
- 12.2.1 Company's Key Areas Served
- 12.2.2 Recent Developments
- 12.3. Company Market Share Analysis 2025
- 12.3.1 Top 5 Companies Market Share Analysis
- 12.3.2 Top 3 Companies Market Share Analysis
- 12.4. List of Potential Customers
- 13. Research Methodology
List of Figures
- Figure 1: Global Waste Grease Recovery Revenue Breakdown (billion, %) by Region 2025 & 2033
- Figure 2: North America Waste Grease Recovery Revenue (billion), by Application 2025 & 2033
- Figure 3: North America Waste Grease Recovery Revenue Share (%), by Application 2025 & 2033
- Figure 4: North America Waste Grease Recovery Revenue (billion), by Type 2025 & 2033
- Figure 5: North America Waste Grease Recovery Revenue Share (%), by Type 2025 & 2033
- Figure 6: North America Waste Grease Recovery Revenue (billion), by Country 2025 & 2033
- Figure 7: North America Waste Grease Recovery Revenue Share (%), by Country 2025 & 2033
- Figure 8: South America Waste Grease Recovery Revenue (billion), by Application 2025 & 2033
- Figure 9: South America Waste Grease Recovery Revenue Share (%), by Application 2025 & 2033
- Figure 10: South America Waste Grease Recovery Revenue (billion), by Type 2025 & 2033
- Figure 11: South America Waste Grease Recovery Revenue Share (%), by Type 2025 & 2033
- Figure 12: South America Waste Grease Recovery Revenue (billion), by Country 2025 & 2033
- Figure 13: South America Waste Grease Recovery Revenue Share (%), by Country 2025 & 2033
- Figure 14: Europe Waste Grease Recovery Revenue (billion), by Application 2025 & 2033
- Figure 15: Europe Waste Grease Recovery Revenue Share (%), by Application 2025 & 2033
- Figure 16: Europe Waste Grease Recovery Revenue (billion), by Type 2025 & 2033
- Figure 17: Europe Waste Grease Recovery Revenue Share (%), by Type 2025 & 2033
- Figure 18: Europe Waste Grease Recovery Revenue (billion), by Country 2025 & 2033
- Figure 19: Europe Waste Grease Recovery Revenue Share (%), by Country 2025 & 2033
- Figure 20: Middle East & Africa Waste Grease Recovery Revenue (billion), by Application 2025 & 2033
- Figure 21: Middle East & Africa Waste Grease Recovery Revenue Share (%), by Application 2025 & 2033
- Figure 22: Middle East & Africa Waste Grease Recovery Revenue (billion), by Type 2025 & 2033
- Figure 23: Middle East & Africa Waste Grease Recovery Revenue Share (%), by Type 2025 & 2033
- Figure 24: Middle East & Africa Waste Grease Recovery Revenue (billion), by Country 2025 & 2033
- Figure 25: Middle East & Africa Waste Grease Recovery Revenue Share (%), by Country 2025 & 2033
- Figure 26: Asia Pacific Waste Grease Recovery Revenue (billion), by Application 2025 & 2033
- Figure 27: Asia Pacific Waste Grease Recovery Revenue Share (%), by Application 2025 & 2033
- Figure 28: Asia Pacific Waste Grease Recovery Revenue (billion), by Type 2025 & 2033
- Figure 29: Asia Pacific Waste Grease Recovery Revenue Share (%), by Type 2025 & 2033
- Figure 30: Asia Pacific Waste Grease Recovery Revenue (billion), by Country 2025 & 2033
- Figure 31: Asia Pacific Waste Grease Recovery Revenue Share (%), by Country 2025 & 2033
List of Tables
- Table 1: Global Waste Grease Recovery Revenue billion Forecast, by Application 2020 & 2033
- Table 2: Global Waste Grease Recovery Revenue billion Forecast, by Type 2020 & 2033
- Table 3: Global Waste Grease Recovery Revenue billion Forecast, by Region 2020 & 2033
- Table 4: Global Waste Grease Recovery Revenue billion Forecast, by Application 2020 & 2033
- Table 5: Global Waste Grease Recovery Revenue billion Forecast, by Type 2020 & 2033
- Table 6: Global Waste Grease Recovery Revenue billion Forecast, by Country 2020 & 2033
- Table 7: United States Waste Grease Recovery Revenue (billion) Forecast, by Application 2020 & 2033
- Table 8: Canada Waste Grease Recovery Revenue (billion) Forecast, by Application 2020 & 2033
- Table 9: Mexico Waste Grease Recovery Revenue (billion) Forecast, by Application 2020 & 2033
- Table 10: Global Waste Grease Recovery Revenue billion Forecast, by Application 2020 & 2033
- Table 11: Global Waste Grease Recovery Revenue billion Forecast, by Type 2020 & 2033
- Table 12: Global Waste Grease Recovery Revenue billion Forecast, by Country 2020 & 2033
- Table 13: Brazil Waste Grease Recovery Revenue (billion) Forecast, by Application 2020 & 2033
- Table 14: Argentina Waste Grease Recovery Revenue (billion) Forecast, by Application 2020 & 2033
- Table 15: Rest of South America Waste Grease Recovery Revenue (billion) Forecast, by Application 2020 & 2033
- Table 16: Global Waste Grease Recovery Revenue billion Forecast, by Application 2020 & 2033
- Table 17: Global Waste Grease Recovery Revenue billion Forecast, by Type 2020 & 2033
- Table 18: Global Waste Grease Recovery Revenue billion Forecast, by Country 2020 & 2033
- Table 19: United Kingdom Waste Grease Recovery Revenue (billion) Forecast, by Application 2020 & 2033
- Table 20: Germany Waste Grease Recovery Revenue (billion) Forecast, by Application 2020 & 2033
- Table 21: France Waste Grease Recovery Revenue (billion) Forecast, by Application 2020 & 2033
- Table 22: Italy Waste Grease Recovery Revenue (billion) Forecast, by Application 2020 & 2033
- Table 23: Spain Waste Grease Recovery Revenue (billion) Forecast, by Application 2020 & 2033
- Table 24: Russia Waste Grease Recovery Revenue (billion) Forecast, by Application 2020 & 2033
- Table 25: Benelux Waste Grease Recovery Revenue (billion) Forecast, by Application 2020 & 2033
- Table 26: Nordics Waste Grease Recovery Revenue (billion) Forecast, by Application 2020 & 2033
- Table 27: Rest of Europe Waste Grease Recovery Revenue (billion) Forecast, by Application 2020 & 2033
- Table 28: Global Waste Grease Recovery Revenue billion Forecast, by Application 2020 & 2033
- Table 29: Global Waste Grease Recovery Revenue billion Forecast, by Type 2020 & 2033
- Table 30: Global Waste Grease Recovery Revenue billion Forecast, by Country 2020 & 2033
- Table 31: Turkey Waste Grease Recovery Revenue (billion) Forecast, by Application 2020 & 2033
- Table 32: Israel Waste Grease Recovery Revenue (billion) Forecast, by Application 2020 & 2033
- Table 33: GCC Waste Grease Recovery Revenue (billion) Forecast, by Application 2020 & 2033
- Table 34: North Africa Waste Grease Recovery Revenue (billion) Forecast, by Application 2020 & 2033
- Table 35: South Africa Waste Grease Recovery Revenue (billion) Forecast, by Application 2020 & 2033
- Table 36: Rest of Middle East & Africa Waste Grease Recovery Revenue (billion) Forecast, by Application 2020 & 2033
- Table 37: Global Waste Grease Recovery Revenue billion Forecast, by Application 2020 & 2033
- Table 38: Global Waste Grease Recovery Revenue billion Forecast, by Type 2020 & 2033
- Table 39: Global Waste Grease Recovery Revenue billion Forecast, by Country 2020 & 2033
- Table 40: China Waste Grease Recovery Revenue (billion) Forecast, by Application 2020 & 2033
- Table 41: India Waste Grease Recovery Revenue (billion) Forecast, by Application 2020 & 2033
- Table 42: Japan Waste Grease Recovery Revenue (billion) Forecast, by Application 2020 & 2033
- Table 43: South Korea Waste Grease Recovery Revenue (billion) Forecast, by Application 2020 & 2033
- Table 44: ASEAN Waste Grease Recovery Revenue (billion) Forecast, by Application 2020 & 2033
- Table 45: Oceania Waste Grease Recovery Revenue (billion) Forecast, by Application 2020 & 2033
- Table 46: Rest of Asia Pacific Waste Grease Recovery Revenue (billion) Forecast, by Application 2020 & 2033
Frequently Asked Questions
1. What is the projected Compound Annual Growth Rate (CAGR) of the Waste Grease Recovery?
The projected CAGR is approximately 2.25%.
2. Which companies are prominent players in the Waste Grease Recovery?
Key companies in the market include Neste, Darling Ingredients, Münzer Bioindustrie, Chevron Renewable Energy Group, Greenergy, SunOil, Veolia, Olleco, Shandong Hi-Speed Renewable Energy, Fujian Zhongyu Energy, Jiaao Enprotech, Beijing Haidian New Energy Technology, Suzhou Fengbei Biotech, Longhai Bioenergy, Hebei Jingu, Tangshan Jinlihai Biodiesel, Hubei Bimei New Energy Technology, Zhongqi Group, Jingzhou Dadi Bioengineering.
3. What are the main segments of the Waste Grease Recovery?
The market segments include Application, Type.
4. Can you provide details about the market size?
The market size is estimated to be USD 1.37 billion as of 2022.
5. What are some drivers contributing to market growth?
N/A
6. What are the notable trends driving market growth?
N/A
7. Are there any restraints impacting market growth?
N/A
8. Can you provide examples of recent developments in the market?
N/A
9. What pricing options are available for accessing the report?
Pricing options include single-user, multi-user, and enterprise licenses priced at USD 2900.00, USD 4350.00, and USD 5800.00 respectively.
10. Is the market size provided in terms of value or volume?
The market size is provided in terms of value, measured in billion.
11. Are there any specific market keywords associated with the report?
Yes, the market keyword associated with the report is "Waste Grease Recovery," which aids in identifying and referencing the specific market segment covered.
12. How do I determine which pricing option suits my needs best?
The pricing options vary based on user requirements and access needs. Individual users may opt for single-user licenses, while businesses requiring broader access may choose multi-user or enterprise licenses for cost-effective access to the report.
13. Are there any additional resources or data provided in the Waste Grease Recovery report?
While the report offers comprehensive insights, it's advisable to review the specific contents or supplementary materials provided to ascertain if additional resources or data are available.
14. How can I stay updated on further developments or reports in the Waste Grease Recovery?
To stay informed about further developments, trends, and reports in the Waste Grease Recovery, consider subscribing to industry newsletters, following relevant companies and organizations, or regularly checking reputable industry news sources and publications.
Methodology
Step 1 - Identification of Relevant Samples Size from Population Database


Step 2 - Approaches for Defining Global Market Size (Value, Volume* & Price*)

Note*: In applicable scenarios
Step 3 - Data Sources
Primary Research
- Web Analytics
- Survey Reports
- Research Institute
- Latest Research Reports
- Opinion Leaders
Secondary Research
- Annual Reports
- White Paper
- Latest Press Release
- Industry Association
- Paid Database
- Investor Presentations

Step 4 - Data Triangulation
Involves using different sources of information in order to increase the validity of a study
These sources are likely to be stakeholders in a program - participants, other researchers, program staff, other community members, and so on.
Then we put all data in single framework & apply various statistical tools to find out the dynamic on the market.
During the analysis stage, feedback from the stakeholder groups would be compared to determine areas of agreement as well as areas of divergence

