
Key Insights
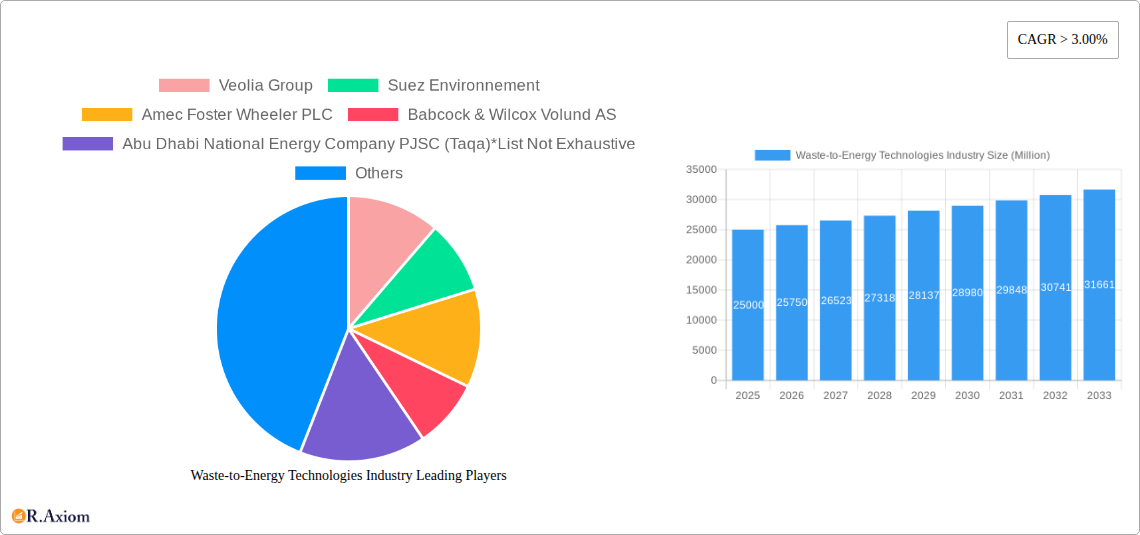
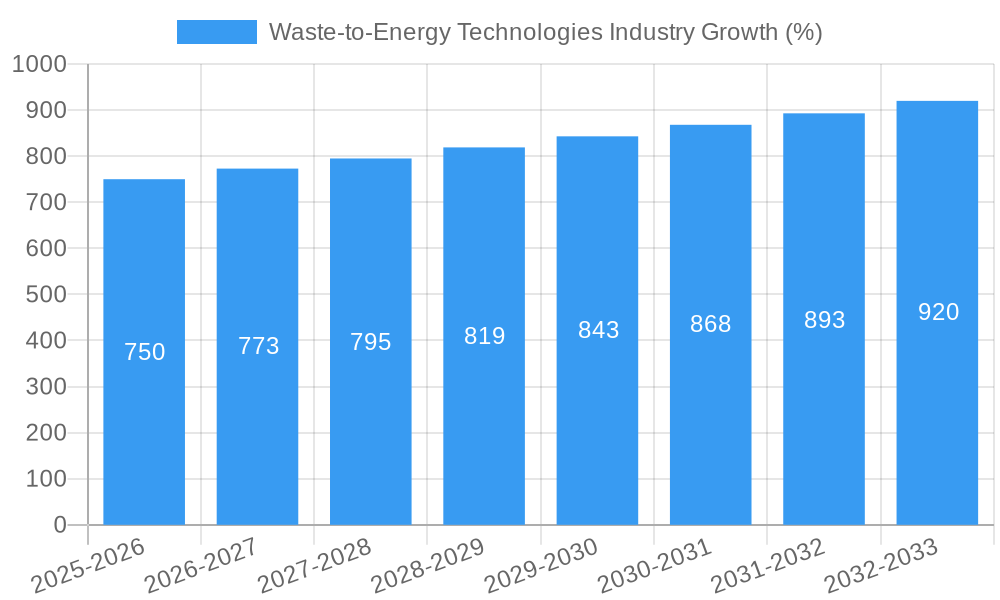
The Waste-to-Energy (WtE) Technologies market is experiencing robust growth, projected to maintain a CAGR exceeding 3.00% from 2025 to 2033. This expansion is driven by several key factors. Increasing urbanization and industrialization lead to escalating volumes of municipal solid waste (MSW), necessitating sustainable waste management solutions. Furthermore, stringent environmental regulations globally are pushing for reduced landfill reliance and promoting cleaner energy sources. The rising cost of landfill disposal, coupled with the potential for energy recovery from waste, makes WtE technologies economically viable and attractive to governments and private companies alike. Technological advancements in incineration, pyrolysis, and gasification are enhancing efficiency and reducing environmental impact, further fueling market growth. While challenges remain, such as high initial capital investment and potential public concerns regarding emissions, the long-term benefits of WtE, including reduced greenhouse gas emissions and resource recovery, outweigh these concerns, driving market expansion.
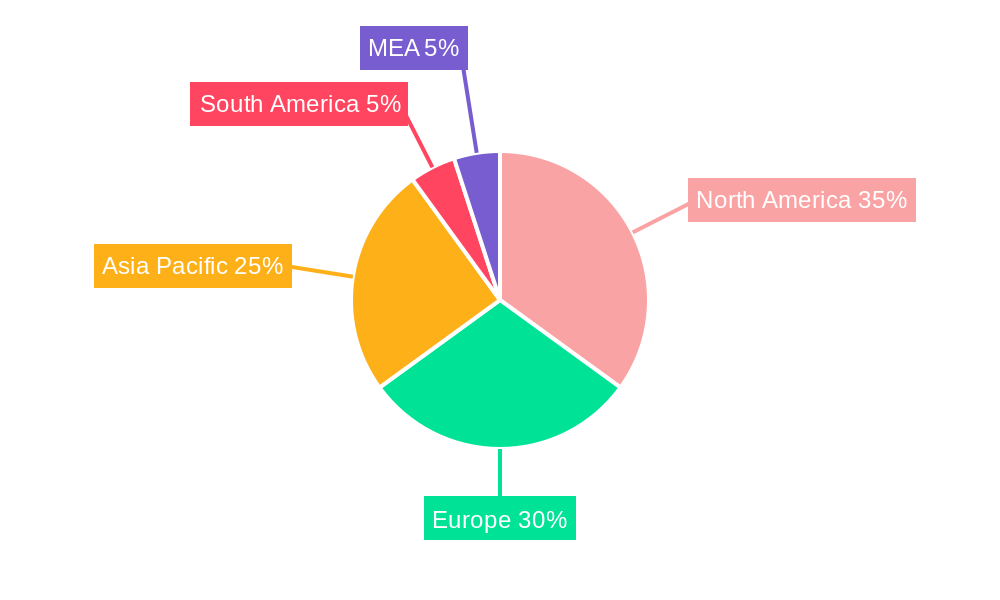
Significant regional variations exist in the WtE market. North America and Europe currently hold substantial market shares, driven by established infrastructure and stringent environmental policies. However, the Asia-Pacific region is poised for rapid growth, fueled by increasing urbanization, industrialization, and government initiatives promoting renewable energy. The market is segmented by technology, with Municipal Solid Waste (MSW) incineration currently dominating. However, pyrolysis and gasification technologies are gaining traction due to their ability to produce valuable byproducts, such as biochar and syngas. Key players, including Veolia Group, Suez Environnement, and Covanta Holding Corporation, are strategically investing in research and development, expanding their global reach, and establishing partnerships to capitalize on this growing market opportunity. The forecast period of 2025-2033 anticipates sustained market growth, driven by consistent technological innovation and increasing global demand for sustainable waste management solutions.
This in-depth report provides a comprehensive analysis of the Waste-to-Energy Technologies industry, offering invaluable insights for stakeholders, investors, and industry professionals. The report covers market size, growth projections, key players, technological advancements, and emerging opportunities across diverse segments, using data from 2019-2024 (historical period), with projections extending to 2033 (forecast period). The base year for analysis is 2025.
Waste-to-Energy Technologies Industry Market Concentration & Innovation
The Waste-to-Energy (WtE) technologies market exhibits a moderately concentrated landscape, with a few multinational corporations holding significant market share. Companies like Veolia Group, Suez Environnement, and Covanta Holding Corporation, along with regional players like Babcock & Wilcox Volund AS and Hitachi Zosen Inova AG, dominate various segments. While precise market share figures for each company are proprietary information and not publicly released in its entirety, these players collectively represent a substantial percentage of the market, particularly in MSW incineration. The market concentration is influenced by factors such as technological expertise, established infrastructure, and access to capital.
Innovation within the industry is driven by several factors: stringent environmental regulations pushing for cleaner energy solutions, increasing MSW generation globally, advancements in pyrolysis and gasification technologies, and rising demand for renewable energy sources. M&A activity within the sector further shapes market dynamics, with larger companies acquiring smaller firms to expand their technological capabilities and geographic reach. Over the last five years, the total value of M&A deals in the WtE industry has been estimated at approximately $xx Million, indicative of a consolidating industry.
Waste-to-Energy Technologies Industry Industry Trends & Insights
The global WtE technologies market is experiencing significant growth, driven by a confluence of factors. The compound annual growth rate (CAGR) during the forecast period (2025-2033) is projected to be approximately xx%, fuelled by several key trends: rising urbanization and increased MSW generation, stricter environmental regulations mandating waste reduction and energy recovery, government incentives and subsidies promoting renewable energy adoption, and technological advancements enhancing efficiency and reducing environmental impact. Market penetration of WtE technologies varies considerably across regions, with developed economies showing higher adoption rates than developing nations. This disparity is attributed to differences in infrastructure development, economic conditions, and regulatory frameworks. The increasing focus on circular economy principles further propels the industry's growth by emphasizing waste minimization, reuse, and recovery. Competitive dynamics are shaped by technological innovations, cost competitiveness, and the ability to offer comprehensive solutions encompassing design, construction, operation, and maintenance of WtE facilities.
Dominant Markets & Segments in Waste-to-Energy Technologies Industry
The Municipal Solid Waste (MSW) incineration segment currently dominates the WtE technologies market, primarily due to its established technology and widespread adoption. However, other technologies are gaining traction.
- Key Drivers for MSW Incineration Dominance:
- Mature technology and proven efficiency.
- Significant installed base of plants globally.
- Established regulatory frameworks supporting incineration.
- Relatively lower capital investment compared to some newer technologies (Pyrolysis and Gasification).
- Other Technologies Growth:
- Pyrolysis and Gasification: These advanced thermal treatment technologies offer the potential for higher energy recovery and value-added product generation, driving their increasing adoption in the long term. However, higher initial investment costs currently limit widespread adoption compared to incineration.
- Co-processing: This technology is witnessing growth in specific regions where it's integrated with existing cement or other industrial processes, offering cost-effective waste management solutions.
- Other Technologies: This category includes technologies still in developmental stages or with limited market penetration.
Geographically, the market is dominated by regions with high population density, rapid urbanization, and stringent environmental regulations. Europe and North America currently lead the market, but Asia Pacific is expected to witness rapid growth in the coming years due to substantial investments in waste management infrastructure and increasing environmental awareness. Favorable government policies, including economic incentives and tax benefits, further fuel market growth in specific regions.
Waste-to-Energy Technologies Industry Product Developments
Recent product innovations focus on enhancing efficiency, reducing emissions, and recovering valuable materials from waste. This includes advancements in air pollution control systems, energy recovery technologies, and waste pretreatment methods. New designs emphasize modularity, allowing for scalability and flexible deployment. Competitive advantages stem from superior efficiency, lower operating costs, and the capability to handle diverse waste streams. The increasing integration of digital technologies, such as advanced process control systems and data analytics, is revolutionizing plant operations and optimizing performance.
Report Scope & Segmentation Analysis
This report segments the WtE technologies market by technology:
Municipal Solid Waste (MSW) Incineration: This segment constitutes the largest share of the market, driven by established technologies and a large existing base of plants. Growth in this segment will be moderate, primarily driven by replacement of older plants with more efficient and environmentally friendly units. Market size is predicted to reach $xx Million by 2033.
Co-processing: This segment benefits from synergy with established industrial processes, lowering costs. Growth in this segment will depend on the expansion of associated industries and increasing integration opportunities. Market size is projected to be $xx Million by 2033.
Pyrolysis and Gasification: The market for these advanced technologies is expected to witness substantial growth, driven by technological advancements, increasing focus on resource recovery, and government support. Market size is projected to be $xx Million by 2033.
Other Technologies: This comprises emerging technologies with limited market penetration. Growth will depend on technological breakthroughs, and regulatory acceptance. The expected market size is $xx Million by 2033.
Key Drivers of Waste-to-Energy Technologies Industry Growth
Several factors fuel the growth of the WtE industry. Firstly, the increasing volume of MSW generation globally, driven by population growth and rising consumption levels, necessitates efficient waste management solutions. Stringent environmental regulations are also a key driver, emphasizing waste reduction and renewable energy adoption. Government initiatives, including subsidies, tax incentives, and supportive policies, further accelerate market expansion. Technological advancements continuously enhance the efficiency, environmental performance, and economic viability of WtE technologies, promoting wider adoption.
Challenges in the Waste-to-Energy Technologies Industry Sector
The WtE industry faces several challenges. Public perception of incineration, particularly related to potential environmental impacts, remains a significant hurdle in some regions. High capital costs associated with WtE plant construction can be a barrier to entry, especially in developing countries. Securing sufficient and consistent feedstock supply is crucial for plant operation and profitability. Furthermore, regulatory hurdles and permitting processes can delay project implementation, influencing investment decisions and overall market growth. The fluctuating prices of fossil fuels can impact the economic competitiveness of WtE projects, depending on the energy market dynamics.
Emerging Opportunities in Waste-to-Energy Technologies Industry
Significant opportunities exist for innovative WtE technologies. The integration of advanced technologies, such as artificial intelligence and machine learning, can enhance plant efficiency, optimize operations, and reduce emissions. The recovery of valuable materials from waste streams, such as metals and plastics, offers opportunities to create a circular economy and reduce reliance on virgin materials. Expanding into new geographical markets, particularly in developing economies experiencing rapid urbanization, presents significant growth potential. Finally, the development of more sustainable and environmentally friendly WtE technologies will be crucial for future growth and public acceptance.
Leading Players in the Waste-to-Energy Technologies Industry Market
- Veolia Group
- Suez Environnement
- Amec Foster Wheeler PLC
- Babcock & Wilcox Volund AS
- Abu Dhabi National Energy Company PJSC (Taqa)
- Covanta Holding Corporation
- Ramboll Group AS
- Babcock & Wilcox Enterprises Inc
- Hitachi Zosen Inova AG
- China Everbright International Limited
Key Developments in Waste-to-Energy Technologies Industry Industry
July 2022: Construction of Delhi's fourth waste-to-energy plant nearing completion, with a capacity to generate 25 MW of power from 2,000 tons of MSW daily. This signifies increased investment in WtE infrastructure in developing economies.
April 2022: Doosan Lentjes constructing a state-of-the-art WtE plant in Wiesbaden, Germany, with a capacity of 240,000 tons per year. This highlights technological advancements and the ongoing modernization of WtE facilities in developed regions.
December 2022: Thailand aims to build 79 waste-to-energy facilities with a total installed capacity of 619.28 MW, showcasing ambitious plans for WtE deployment in Asia Pacific.
Strategic Outlook for Waste-to-Energy Technologies Industry Market
The future of the WtE technologies market is bright. Continued technological advancements, coupled with supportive government policies and increasing environmental awareness, will drive substantial market expansion in the coming years. The focus on resource recovery and the circular economy will further enhance the value proposition of WtE technologies. The industry is poised for significant growth, driven by the need for sustainable waste management solutions and the transition towards cleaner energy sources. Companies that invest in innovation, optimize operations, and adapt to evolving regulatory landscapes will be best positioned to capitalize on the numerous opportunities within this rapidly expanding sector.
Waste-to-Energy Technologies Industry Segmentation
-
1. Technology
- 1.1. Municipal Solid Waste (MSW) Incineration
- 1.2. Co-processing
- 1.3. Pyrolysis and Gasification
- 1.4. Other Technologies
Waste-to-Energy Technologies Industry Segmentation By Geography
- 1. North America
- 2. Asia Pacific
- 3. Europe
- 4. South America
- 5. Middle East and Africa
Waste-to-Energy Technologies Industry REPORT HIGHLIGHTS
| Aspects | Details |
|---|---|
| Study Period | 2019-2033 |
| Base Year | 2024 |
| Estimated Year | 2025 |
| Forecast Period | 2025-2033 |
| Historical Period | 2019-2024 |
| Growth Rate | CAGR of > 3.00% from 2019-2033 |
| Segmentation |
|
Table of Contents
- 1. Introduction
- 1.1. Research Scope
- 1.2. Market Segmentation
- 1.3. Research Methodology
- 1.4. Definitions and Assumptions
- 2. Executive Summary
- 2.1. Introduction
- 3. Market Dynamics
- 3.1. Introduction
- 3.2. Market Drivers
- 3.2.1. 4.; Declining Lithium-Ion Battery Prices4.; Increasing Adoption Of Electric Vehicles
- 3.3. Market Restrains
- 3.3.1. 4.; Safety Concerns Related To Lithium-Ion Battery
- 3.4. Market Trends
- 3.4.1. Municipal Solid Waste Incineration (MSWI) as a Prominent Technology
- 4. Market Factor Analysis
- 4.1. Porters Five Forces
- 4.2. Supply/Value Chain
- 4.3. PESTEL analysis
- 4.4. Market Entropy
- 4.5. Patent/Trademark Analysis
- 5. Global Waste-to-Energy Technologies Industry Analysis, Insights and Forecast, 2019-2031
- 5.1. Market Analysis, Insights and Forecast - by Technology
- 5.1.1. Municipal Solid Waste (MSW) Incineration
- 5.1.2. Co-processing
- 5.1.3. Pyrolysis and Gasification
- 5.1.4. Other Technologies
- 5.2. Market Analysis, Insights and Forecast - by Region
- 5.2.1. North America
- 5.2.2. Asia Pacific
- 5.2.3. Europe
- 5.2.4. South America
- 5.2.5. Middle East and Africa
- 5.1. Market Analysis, Insights and Forecast - by Technology
- 6. North America Waste-to-Energy Technologies Industry Analysis, Insights and Forecast, 2019-2031
- 6.1. Market Analysis, Insights and Forecast - by Technology
- 6.1.1. Municipal Solid Waste (MSW) Incineration
- 6.1.2. Co-processing
- 6.1.3. Pyrolysis and Gasification
- 6.1.4. Other Technologies
- 6.1. Market Analysis, Insights and Forecast - by Technology
- 7. Asia Pacific Waste-to-Energy Technologies Industry Analysis, Insights and Forecast, 2019-2031
- 7.1. Market Analysis, Insights and Forecast - by Technology
- 7.1.1. Municipal Solid Waste (MSW) Incineration
- 7.1.2. Co-processing
- 7.1.3. Pyrolysis and Gasification
- 7.1.4. Other Technologies
- 7.1. Market Analysis, Insights and Forecast - by Technology
- 8. Europe Waste-to-Energy Technologies Industry Analysis, Insights and Forecast, 2019-2031
- 8.1. Market Analysis, Insights and Forecast - by Technology
- 8.1.1. Municipal Solid Waste (MSW) Incineration
- 8.1.2. Co-processing
- 8.1.3. Pyrolysis and Gasification
- 8.1.4. Other Technologies
- 8.1. Market Analysis, Insights and Forecast - by Technology
- 9. South America Waste-to-Energy Technologies Industry Analysis, Insights and Forecast, 2019-2031
- 9.1. Market Analysis, Insights and Forecast - by Technology
- 9.1.1. Municipal Solid Waste (MSW) Incineration
- 9.1.2. Co-processing
- 9.1.3. Pyrolysis and Gasification
- 9.1.4. Other Technologies
- 9.1. Market Analysis, Insights and Forecast - by Technology
- 10. Middle East and Africa Waste-to-Energy Technologies Industry Analysis, Insights and Forecast, 2019-2031
- 10.1. Market Analysis, Insights and Forecast - by Technology
- 10.1.1. Municipal Solid Waste (MSW) Incineration
- 10.1.2. Co-processing
- 10.1.3. Pyrolysis and Gasification
- 10.1.4. Other Technologies
- 10.1. Market Analysis, Insights and Forecast - by Technology
- 11. North America Waste-to-Energy Technologies Industry Analysis, Insights and Forecast, 2019-2031
- 11.1. Market Analysis, Insights and Forecast - By Country/Sub-region
- 11.1.1 United States
- 11.1.2 Canada
- 11.1.3 Mexico
- 12. Europe Waste-to-Energy Technologies Industry Analysis, Insights and Forecast, 2019-2031
- 12.1. Market Analysis, Insights and Forecast - By Country/Sub-region
- 12.1.1 Germany
- 12.1.2 United Kingdom
- 12.1.3 France
- 12.1.4 Spain
- 12.1.5 Italy
- 12.1.6 Spain
- 12.1.7 Belgium
- 12.1.8 Netherland
- 12.1.9 Nordics
- 12.1.10 Rest of Europe
- 13. Asia Pacific Waste-to-Energy Technologies Industry Analysis, Insights and Forecast, 2019-2031
- 13.1. Market Analysis, Insights and Forecast - By Country/Sub-region
- 13.1.1 China
- 13.1.2 Japan
- 13.1.3 India
- 13.1.4 South Korea
- 13.1.5 Southeast Asia
- 13.1.6 Australia
- 13.1.7 Indonesia
- 13.1.8 Phillipes
- 13.1.9 Singapore
- 13.1.10 Thailandc
- 13.1.11 Rest of Asia Pacific
- 14. South America Waste-to-Energy Technologies Industry Analysis, Insights and Forecast, 2019-2031
- 14.1. Market Analysis, Insights and Forecast - By Country/Sub-region
- 14.1.1 Brazil
- 14.1.2 Argentina
- 14.1.3 Peru
- 14.1.4 Chile
- 14.1.5 Colombia
- 14.1.6 Ecuador
- 14.1.7 Venezuela
- 14.1.8 Rest of South America
- 15. North America Waste-to-Energy Technologies Industry Analysis, Insights and Forecast, 2019-2031
- 15.1. Market Analysis, Insights and Forecast - By Country/Sub-region
- 15.1.1 United States
- 15.1.2 Canada
- 15.1.3 Mexico
- 16. MEA Waste-to-Energy Technologies Industry Analysis, Insights and Forecast, 2019-2031
- 16.1. Market Analysis, Insights and Forecast - By Country/Sub-region
- 16.1.1 United Arab Emirates
- 16.1.2 Saudi Arabia
- 16.1.3 South Africa
- 16.1.4 Rest of Middle East and Africa
- 17. Competitive Analysis
- 17.1. Global Market Share Analysis 2024
- 17.2. Company Profiles
- 17.2.1 Veolia Group
- 17.2.1.1. Overview
- 17.2.1.2. Products
- 17.2.1.3. SWOT Analysis
- 17.2.1.4. Recent Developments
- 17.2.1.5. Financials (Based on Availability)
- 17.2.2 Suez Environnement
- 17.2.2.1. Overview
- 17.2.2.2. Products
- 17.2.2.3. SWOT Analysis
- 17.2.2.4. Recent Developments
- 17.2.2.5. Financials (Based on Availability)
- 17.2.3 Amec Foster Wheeler PLC
- 17.2.3.1. Overview
- 17.2.3.2. Products
- 17.2.3.3. SWOT Analysis
- 17.2.3.4. Recent Developments
- 17.2.3.5. Financials (Based on Availability)
- 17.2.4 Babcock & Wilcox Volund AS
- 17.2.4.1. Overview
- 17.2.4.2. Products
- 17.2.4.3. SWOT Analysis
- 17.2.4.4. Recent Developments
- 17.2.4.5. Financials (Based on Availability)
- 17.2.5 Abu Dhabi National Energy Company PJSC (Taqa)*List Not Exhaustive
- 17.2.5.1. Overview
- 17.2.5.2. Products
- 17.2.5.3. SWOT Analysis
- 17.2.5.4. Recent Developments
- 17.2.5.5. Financials (Based on Availability)
- 17.2.6 Covanta Holding Corporation
- 17.2.6.1. Overview
- 17.2.6.2. Products
- 17.2.6.3. SWOT Analysis
- 17.2.6.4. Recent Developments
- 17.2.6.5. Financials (Based on Availability)
- 17.2.7 Ramboll Group AS
- 17.2.7.1. Overview
- 17.2.7.2. Products
- 17.2.7.3. SWOT Analysis
- 17.2.7.4. Recent Developments
- 17.2.7.5. Financials (Based on Availability)
- 17.2.8 Babcock & Wilcox Enterprises Inc
- 17.2.8.1. Overview
- 17.2.8.2. Products
- 17.2.8.3. SWOT Analysis
- 17.2.8.4. Recent Developments
- 17.2.8.5. Financials (Based on Availability)
- 17.2.9 Hitachi Zosen Inova AG
- 17.2.9.1. Overview
- 17.2.9.2. Products
- 17.2.9.3. SWOT Analysis
- 17.2.9.4. Recent Developments
- 17.2.9.5. Financials (Based on Availability)
- 17.2.10 China Everbright International Limited
- 17.2.10.1. Overview
- 17.2.10.2. Products
- 17.2.10.3. SWOT Analysis
- 17.2.10.4. Recent Developments
- 17.2.10.5. Financials (Based on Availability)
- 17.2.1 Veolia Group
List of Figures
- Figure 1: Global Waste-to-Energy Technologies Industry Revenue Breakdown (Million, %) by Region 2024 & 2032
- Figure 2: North America Waste-to-Energy Technologies Industry Revenue (Million), by Country 2024 & 2032
- Figure 3: North America Waste-to-Energy Technologies Industry Revenue Share (%), by Country 2024 & 2032
- Figure 4: Europe Waste-to-Energy Technologies Industry Revenue (Million), by Country 2024 & 2032
- Figure 5: Europe Waste-to-Energy Technologies Industry Revenue Share (%), by Country 2024 & 2032
- Figure 6: Asia Pacific Waste-to-Energy Technologies Industry Revenue (Million), by Country 2024 & 2032
- Figure 7: Asia Pacific Waste-to-Energy Technologies Industry Revenue Share (%), by Country 2024 & 2032
- Figure 8: South America Waste-to-Energy Technologies Industry Revenue (Million), by Country 2024 & 2032
- Figure 9: South America Waste-to-Energy Technologies Industry Revenue Share (%), by Country 2024 & 2032
- Figure 10: North America Waste-to-Energy Technologies Industry Revenue (Million), by Country 2024 & 2032
- Figure 11: North America Waste-to-Energy Technologies Industry Revenue Share (%), by Country 2024 & 2032
- Figure 12: MEA Waste-to-Energy Technologies Industry Revenue (Million), by Country 2024 & 2032
- Figure 13: MEA Waste-to-Energy Technologies Industry Revenue Share (%), by Country 2024 & 2032
- Figure 14: North America Waste-to-Energy Technologies Industry Revenue (Million), by Technology 2024 & 2032
- Figure 15: North America Waste-to-Energy Technologies Industry Revenue Share (%), by Technology 2024 & 2032
- Figure 16: North America Waste-to-Energy Technologies Industry Revenue (Million), by Country 2024 & 2032
- Figure 17: North America Waste-to-Energy Technologies Industry Revenue Share (%), by Country 2024 & 2032
- Figure 18: Asia Pacific Waste-to-Energy Technologies Industry Revenue (Million), by Technology 2024 & 2032
- Figure 19: Asia Pacific Waste-to-Energy Technologies Industry Revenue Share (%), by Technology 2024 & 2032
- Figure 20: Asia Pacific Waste-to-Energy Technologies Industry Revenue (Million), by Country 2024 & 2032
- Figure 21: Asia Pacific Waste-to-Energy Technologies Industry Revenue Share (%), by Country 2024 & 2032
- Figure 22: Europe Waste-to-Energy Technologies Industry Revenue (Million), by Technology 2024 & 2032
- Figure 23: Europe Waste-to-Energy Technologies Industry Revenue Share (%), by Technology 2024 & 2032
- Figure 24: Europe Waste-to-Energy Technologies Industry Revenue (Million), by Country 2024 & 2032
- Figure 25: Europe Waste-to-Energy Technologies Industry Revenue Share (%), by Country 2024 & 2032
- Figure 26: South America Waste-to-Energy Technologies Industry Revenue (Million), by Technology 2024 & 2032
- Figure 27: South America Waste-to-Energy Technologies Industry Revenue Share (%), by Technology 2024 & 2032
- Figure 28: South America Waste-to-Energy Technologies Industry Revenue (Million), by Country 2024 & 2032
- Figure 29: South America Waste-to-Energy Technologies Industry Revenue Share (%), by Country 2024 & 2032
- Figure 30: Middle East and Africa Waste-to-Energy Technologies Industry Revenue (Million), by Technology 2024 & 2032
- Figure 31: Middle East and Africa Waste-to-Energy Technologies Industry Revenue Share (%), by Technology 2024 & 2032
- Figure 32: Middle East and Africa Waste-to-Energy Technologies Industry Revenue (Million), by Country 2024 & 2032
- Figure 33: Middle East and Africa Waste-to-Energy Technologies Industry Revenue Share (%), by Country 2024 & 2032
List of Tables
- Table 1: Global Waste-to-Energy Technologies Industry Revenue Million Forecast, by Region 2019 & 2032
- Table 2: Global Waste-to-Energy Technologies Industry Revenue Million Forecast, by Technology 2019 & 2032
- Table 3: Global Waste-to-Energy Technologies Industry Revenue Million Forecast, by Region 2019 & 2032
- Table 4: Global Waste-to-Energy Technologies Industry Revenue Million Forecast, by Country 2019 & 2032
- Table 5: United States Waste-to-Energy Technologies Industry Revenue (Million) Forecast, by Application 2019 & 2032
- Table 6: Canada Waste-to-Energy Technologies Industry Revenue (Million) Forecast, by Application 2019 & 2032
- Table 7: Mexico Waste-to-Energy Technologies Industry Revenue (Million) Forecast, by Application 2019 & 2032
- Table 8: Global Waste-to-Energy Technologies Industry Revenue Million Forecast, by Country 2019 & 2032
- Table 9: Germany Waste-to-Energy Technologies Industry Revenue (Million) Forecast, by Application 2019 & 2032
- Table 10: United Kingdom Waste-to-Energy Technologies Industry Revenue (Million) Forecast, by Application 2019 & 2032
- Table 11: France Waste-to-Energy Technologies Industry Revenue (Million) Forecast, by Application 2019 & 2032
- Table 12: Spain Waste-to-Energy Technologies Industry Revenue (Million) Forecast, by Application 2019 & 2032
- Table 13: Italy Waste-to-Energy Technologies Industry Revenue (Million) Forecast, by Application 2019 & 2032
- Table 14: Spain Waste-to-Energy Technologies Industry Revenue (Million) Forecast, by Application 2019 & 2032
- Table 15: Belgium Waste-to-Energy Technologies Industry Revenue (Million) Forecast, by Application 2019 & 2032
- Table 16: Netherland Waste-to-Energy Technologies Industry Revenue (Million) Forecast, by Application 2019 & 2032
- Table 17: Nordics Waste-to-Energy Technologies Industry Revenue (Million) Forecast, by Application 2019 & 2032
- Table 18: Rest of Europe Waste-to-Energy Technologies Industry Revenue (Million) Forecast, by Application 2019 & 2032
- Table 19: Global Waste-to-Energy Technologies Industry Revenue Million Forecast, by Country 2019 & 2032
- Table 20: China Waste-to-Energy Technologies Industry Revenue (Million) Forecast, by Application 2019 & 2032
- Table 21: Japan Waste-to-Energy Technologies Industry Revenue (Million) Forecast, by Application 2019 & 2032
- Table 22: India Waste-to-Energy Technologies Industry Revenue (Million) Forecast, by Application 2019 & 2032
- Table 23: South Korea Waste-to-Energy Technologies Industry Revenue (Million) Forecast, by Application 2019 & 2032
- Table 24: Southeast Asia Waste-to-Energy Technologies Industry Revenue (Million) Forecast, by Application 2019 & 2032
- Table 25: Australia Waste-to-Energy Technologies Industry Revenue (Million) Forecast, by Application 2019 & 2032
- Table 26: Indonesia Waste-to-Energy Technologies Industry Revenue (Million) Forecast, by Application 2019 & 2032
- Table 27: Phillipes Waste-to-Energy Technologies Industry Revenue (Million) Forecast, by Application 2019 & 2032
- Table 28: Singapore Waste-to-Energy Technologies Industry Revenue (Million) Forecast, by Application 2019 & 2032
- Table 29: Thailandc Waste-to-Energy Technologies Industry Revenue (Million) Forecast, by Application 2019 & 2032
- Table 30: Rest of Asia Pacific Waste-to-Energy Technologies Industry Revenue (Million) Forecast, by Application 2019 & 2032
- Table 31: Global Waste-to-Energy Technologies Industry Revenue Million Forecast, by Country 2019 & 2032
- Table 32: Brazil Waste-to-Energy Technologies Industry Revenue (Million) Forecast, by Application 2019 & 2032
- Table 33: Argentina Waste-to-Energy Technologies Industry Revenue (Million) Forecast, by Application 2019 & 2032
- Table 34: Peru Waste-to-Energy Technologies Industry Revenue (Million) Forecast, by Application 2019 & 2032
- Table 35: Chile Waste-to-Energy Technologies Industry Revenue (Million) Forecast, by Application 2019 & 2032
- Table 36: Colombia Waste-to-Energy Technologies Industry Revenue (Million) Forecast, by Application 2019 & 2032
- Table 37: Ecuador Waste-to-Energy Technologies Industry Revenue (Million) Forecast, by Application 2019 & 2032
- Table 38: Venezuela Waste-to-Energy Technologies Industry Revenue (Million) Forecast, by Application 2019 & 2032
- Table 39: Rest of South America Waste-to-Energy Technologies Industry Revenue (Million) Forecast, by Application 2019 & 2032
- Table 40: Global Waste-to-Energy Technologies Industry Revenue Million Forecast, by Country 2019 & 2032
- Table 41: United States Waste-to-Energy Technologies Industry Revenue (Million) Forecast, by Application 2019 & 2032
- Table 42: Canada Waste-to-Energy Technologies Industry Revenue (Million) Forecast, by Application 2019 & 2032
- Table 43: Mexico Waste-to-Energy Technologies Industry Revenue (Million) Forecast, by Application 2019 & 2032
- Table 44: Global Waste-to-Energy Technologies Industry Revenue Million Forecast, by Country 2019 & 2032
- Table 45: United Arab Emirates Waste-to-Energy Technologies Industry Revenue (Million) Forecast, by Application 2019 & 2032
- Table 46: Saudi Arabia Waste-to-Energy Technologies Industry Revenue (Million) Forecast, by Application 2019 & 2032
- Table 47: South Africa Waste-to-Energy Technologies Industry Revenue (Million) Forecast, by Application 2019 & 2032
- Table 48: Rest of Middle East and Africa Waste-to-Energy Technologies Industry Revenue (Million) Forecast, by Application 2019 & 2032
- Table 49: Global Waste-to-Energy Technologies Industry Revenue Million Forecast, by Technology 2019 & 2032
- Table 50: Global Waste-to-Energy Technologies Industry Revenue Million Forecast, by Country 2019 & 2032
- Table 51: Global Waste-to-Energy Technologies Industry Revenue Million Forecast, by Technology 2019 & 2032
- Table 52: Global Waste-to-Energy Technologies Industry Revenue Million Forecast, by Country 2019 & 2032
- Table 53: Global Waste-to-Energy Technologies Industry Revenue Million Forecast, by Technology 2019 & 2032
- Table 54: Global Waste-to-Energy Technologies Industry Revenue Million Forecast, by Country 2019 & 2032
- Table 55: Global Waste-to-Energy Technologies Industry Revenue Million Forecast, by Technology 2019 & 2032
- Table 56: Global Waste-to-Energy Technologies Industry Revenue Million Forecast, by Country 2019 & 2032
- Table 57: Global Waste-to-Energy Technologies Industry Revenue Million Forecast, by Technology 2019 & 2032
- Table 58: Global Waste-to-Energy Technologies Industry Revenue Million Forecast, by Country 2019 & 2032
Frequently Asked Questions
1. What is the projected Compound Annual Growth Rate (CAGR) of the Waste-to-Energy Technologies Industry?
The projected CAGR is approximately > 3.00%.
2. Which companies are prominent players in the Waste-to-Energy Technologies Industry?
Key companies in the market include Veolia Group, Suez Environnement, Amec Foster Wheeler PLC, Babcock & Wilcox Volund AS, Abu Dhabi National Energy Company PJSC (Taqa)*List Not Exhaustive, Covanta Holding Corporation, Ramboll Group AS, Babcock & Wilcox Enterprises Inc, Hitachi Zosen Inova AG, China Everbright International Limited.
3. What are the main segments of the Waste-to-Energy Technologies Industry?
The market segments include Technology.
4. Can you provide details about the market size?
The market size is estimated to be USD XX Million as of 2022.
5. What are some drivers contributing to market growth?
4.; Declining Lithium-Ion Battery Prices4.; Increasing Adoption Of Electric Vehicles.
6. What are the notable trends driving market growth?
Municipal Solid Waste Incineration (MSWI) as a Prominent Technology.
7. Are there any restraints impacting market growth?
4.; Safety Concerns Related To Lithium-Ion Battery.
8. Can you provide examples of recent developments in the market?
As of July 2022, the construction of Delhi's fourth waste-to-energy plant in Tehkhand, southeast Delhi, was nearing completion. According to a senior Municipal Corporation of Delhi (MCD) official, the plant will generate 25 megawatts (MW) of power by utilizing 2,000 ton of municipal solid waste (MSW) discharged at the Okhla landfill site daily.
9. What pricing options are available for accessing the report?
Pricing options include single-user, multi-user, and enterprise licenses priced at USD 4750, USD 5250, and USD 8750 respectively.
10. Is the market size provided in terms of value or volume?
The market size is provided in terms of value, measured in Million.
11. Are there any specific market keywords associated with the report?
Yes, the market keyword associated with the report is "Waste-to-Energy Technologies Industry," which aids in identifying and referencing the specific market segment covered.
12. How do I determine which pricing option suits my needs best?
The pricing options vary based on user requirements and access needs. Individual users may opt for single-user licenses, while businesses requiring broader access may choose multi-user or enterprise licenses for cost-effective access to the report.
13. Are there any additional resources or data provided in the Waste-to-Energy Technologies Industry report?
While the report offers comprehensive insights, it's advisable to review the specific contents or supplementary materials provided to ascertain if additional resources or data are available.
14. How can I stay updated on further developments or reports in the Waste-to-Energy Technologies Industry?
To stay informed about further developments, trends, and reports in the Waste-to-Energy Technologies Industry, consider subscribing to industry newsletters, following relevant companies and organizations, or regularly checking reputable industry news sources and publications.
Methodology
Step 1 - Identification of Relevant Samples Size from Population Database


Step 2 - Approaches for Defining Global Market Size (Value, Volume* & Price*)

Note*: In applicable scenarios
Step 3 - Data Sources
Primary Research
- Web Analytics
- Survey Reports
- Research Institute
- Latest Research Reports
- Opinion Leaders
Secondary Research
- Annual Reports
- White Paper
- Latest Press Release
- Industry Association
- Paid Database
- Investor Presentations

Step 4 - Data Triangulation
Involves using different sources of information in order to increase the validity of a study
These sources are likely to be stakeholders in a program - participants, other researchers, program staff, other community members, and so on.
Then we put all data in single framework & apply various statistical tools to find out the dynamic on the market.
During the analysis stage, feedback from the stakeholder groups would be compared to determine areas of agreement as well as areas of divergence


