
Key Insights
The global Water Automation and Instrumentation Market, valued at $4.12 billion in 2025, is projected to experience robust growth, driven by increasing urbanization, stringent water quality regulations, and the rising need for efficient water management across various industries. The market's Compound Annual Growth Rate (CAGR) of 7.49% from 2019 to 2024 suggests a consistent upward trajectory, expected to continue through 2033. Key growth drivers include the escalating demand for advanced water treatment technologies, the adoption of smart water grids for improved resource allocation, and the growing focus on minimizing water loss through leak detection and prevention strategies. The market is segmented by solution type (automation and instrumentation), encompassing technologies such as DCS, SCADA, PLCs, and various sensors for pressure, level, temperature, and flow measurement, alongside advanced analyzers for water quality monitoring. End-user industries such as chemical, manufacturing, food and beverage, utilities, and paper and pulp are significant contributors to market growth, driven by their need for precise water management and control to optimize production processes and comply with environmental regulations. The increasing adoption of Industry 4.0 principles and the integration of advanced analytics for predictive maintenance are further bolstering market expansion.
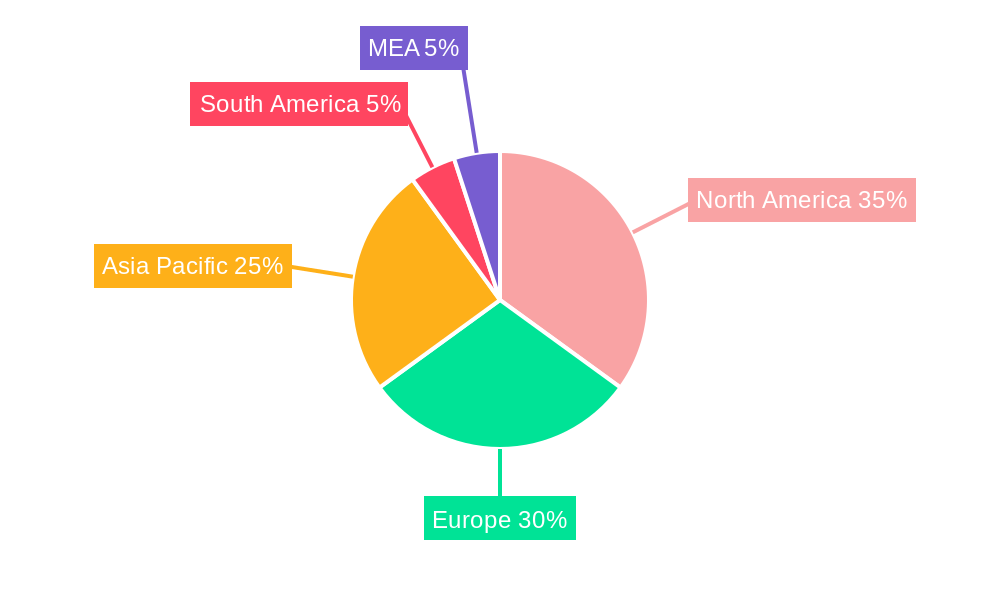
The regional distribution of the market shows strong presence across North America, Europe, and Asia Pacific. North America and Europe are currently leading due to established infrastructure and advanced technology adoption. However, the Asia Pacific region is anticipated to witness the most significant growth in the coming years, driven by rapid industrialization and increasing investments in water infrastructure development. Competitive landscape analysis reveals a blend of established multinational corporations and specialized regional players. Companies such as NALCO, Phoenix Contact, Endress+Hauser, GE Corporation, and Siemens are actively involved in developing and supplying advanced automation and instrumentation solutions, fostering innovation and competition within the market. Future growth hinges on the continued development of cost-effective, reliable, and environmentally friendly water management solutions, along with the implementation of effective policies promoting sustainable water usage.

Water Automation and Instrumentation Market: A Comprehensive Report (2019-2033)
This comprehensive report provides an in-depth analysis of the Water Automation and Instrumentation market, offering valuable insights for stakeholders across the industry value chain. The study period spans from 2019 to 2033, with 2025 serving as the base and estimated year. The forecast period is 2025-2033, and the historical period covers 2019-2024. The report leverages extensive primary and secondary research to deliver actionable intelligence, covering market size, segmentation, key players, and future growth prospects.
Water Automation and Instrumentation Market Market Concentration & Innovation
The Water Automation and Instrumentation market exhibits a moderately concentrated landscape, with several major players holding significant market share. However, the presence of numerous smaller, specialized firms fosters competition and innovation. Market concentration is influenced by factors including technological expertise, geographic reach, and established customer relationships. Key players like Siemens AG, Schneider Electric SE, and Emerson Electric maintain substantial market share due to their comprehensive product portfolios and global presence. Smaller companies often focus on niche segments, offering specialized solutions and driving innovation.
Market Concentration Metrics (Estimated 2025):
- Top 5 players: xx% market share
- Top 10 players: xx% market share
- Average market share of top players: xx%
Innovation Drivers:
- Technological advancements: The integration of IoT, AI, and cloud computing is driving the development of intelligent water management systems.
- Regulatory pressures: Stringent environmental regulations are pushing for efficient water usage and leak detection, fueling demand for advanced instrumentation.
- Increased automation: The need for improved operational efficiency and reduced labor costs promotes automation in water treatment and distribution.
Regulatory Frameworks: Varying regulations across different regions significantly impact market dynamics. Compliance requirements influence product development and adoption rates.
Product Substitutes: While direct substitutes are limited, the market faces competition from alternative water management strategies and technologies.
End-User Trends: The increasing adoption of smart water management solutions by end-users across sectors is shaping market growth.
M&A Activities: The market has witnessed a moderate level of mergers and acquisitions (M&A) activity, with larger players acquiring smaller firms to expand their product offerings and market reach. Recent M&A deal values have ranged from xx Million to xx Million, driven by the desire to enhance technological capabilities and expand market penetration.
Water Automation and Instrumentation Market Industry Trends & Insights
The Water Automation and Instrumentation market is experiencing robust growth, driven by several key factors. The global market size is expected to reach xx Million by 2033, exhibiting a CAGR of xx% during the forecast period. This growth is fueled by increasing urbanization, industrialization, and growing concerns about water scarcity and water quality. Technological disruptions, such as the adoption of advanced sensors, cloud-based analytics, and AI-powered predictive maintenance, are revolutionizing water management practices. Consumer preferences are shifting towards sustainable and efficient water solutions. The market is becoming increasingly competitive, with companies investing in R&D to develop innovative products and services. Market penetration of smart water management solutions is gradually increasing across various end-user industries. Several factors, including the ongoing digital transformation in water utilities and increased investment in water infrastructure projects, are contributing to this upward trend. Specific challenges, like cybersecurity concerns and interoperability issues, still need to be addressed.

Dominant Markets & Segments in Water Automation and Instrumentation Market
The Utilities sector is the dominant end-user industry, followed by the Chemical and Manufacturing sectors. Geographically, North America and Europe currently hold a significant market share, but Asia-Pacific is expected to witness rapid growth in the coming years.
Leading Segments:
- Water Automation Solutions: SCADA systems hold the largest market share, owing to their ability to provide real-time monitoring and control of water networks. PLC systems are also gaining traction due to their flexibility and cost-effectiveness.
- Water Instrumentation Solutions: Flow sensors/transmitters and level transmitters are the most widely used instrumentation solutions due to their critical role in monitoring water flow and storage levels.
- End-user Industries: Utilities are the leading segment due to their extensive use of automation and instrumentation technologies for water treatment, distribution, and management.
Key Drivers:
- Economic policies: Government initiatives promoting water conservation and infrastructure development are driving market growth.
- Infrastructure investments: Significant investments in upgrading water infrastructure are creating opportunities for automation and instrumentation vendors.
- Technological advancements: Innovations in sensor technology and data analytics are leading to improved water management practices.
The dominance of specific regions and segments is primarily influenced by factors like existing infrastructure, regulatory frameworks, technological maturity, and economic conditions.
Water Automation and Instrumentation Market Product Developments
Recent product innovations focus on improving accuracy, reliability, and connectivity of water automation and instrumentation solutions. The integration of IoT and cloud computing allows for remote monitoring and control, predictive maintenance, and data-driven decision-making. Advanced analytics and AI-powered algorithms enhance operational efficiency and optimize water resource management. These advancements are leading to better water quality control, reduced water loss, and improved operational efficiency. The market fit of these technologies is exceptionally high, driven by the increasing demand for sophisticated water management solutions.
Report Scope & Segmentation Analysis
This report provides a comprehensive segmentation analysis of the Water Automation and Instrumentation market based on the following categories:
Water Automation Solutions: DCS, SCADA, PLC, IAM, HMI, Other Water Automation Solutions. Each segment's growth projection and market size are analyzed, considering the technological advancements and competitive dynamics within each category.
Water Instrumentation Solutions: Pressure Transmitter, Level Transmitter, Temperature Transmitter, Liquid Analyzers, Gas Analyzers, Leakage Detection Systems, Flow Sensors/Transmitters, Other Water Instrumentation Solutions. This segmentation assesses the specific applications and market trends for each instrumentation type.
End-user Industries: Chemical, Manufacturing, Food and Beverages, Utilities, Paper and Pulp, Other End-user Industries. The report delves into the unique requirements and market size of each industry sector. Growth projections vary based on industry-specific factors like regulatory compliance and technological adoption rates.
Key Drivers of Water Automation and Instrumentation Market Growth
The market's growth is driven by several factors:
- Increasing demand for efficient water management: Water scarcity and rising concerns about water quality are driving the adoption of advanced automation and instrumentation technologies.
- Government regulations and initiatives: Stringent environmental regulations and government funding for water infrastructure projects are creating favorable market conditions.
- Technological advancements: The development of advanced sensors, AI, and IoT-based solutions is improving water management practices and enhancing operational efficiency.
Challenges in the Water Automation and Instrumentation Market Sector
The market faces certain challenges:
- High initial investment costs: The implementation of sophisticated automation systems can require significant upfront investments, potentially hindering adoption by smaller entities.
- Cybersecurity concerns: The interconnected nature of modern water management systems raises concerns about cybersecurity threats.
- Integration challenges: Integrating different automation and instrumentation systems from various vendors can pose technical challenges.
These factors pose obstacles to market penetration and require strategic solutions from both vendors and end-users.
Emerging Opportunities in Water Automation and Instrumentation Market
Significant growth opportunities exist in:
- Smart water grids: The development and implementation of smart water grids offers vast potential for improved water management.
- Advanced analytics and AI: The application of AI and machine learning algorithms for predictive maintenance and optimized water distribution is a promising area.
- Development of sustainable water solutions: Growing environmental awareness is driving demand for eco-friendly water management technologies.
These trends present attractive opportunities for innovation and investment in the Water Automation and Instrumentation market.
Leading Players in the Water Automation and Instrumentation Market Market
- NALCO
- Phoenix Contact
- Endress + Hauser Pvt Ltd
- GE Corporation
- KROHNE LT
- MJK Automation
- Siemens AG
- Schneider Electric SE
- Emerson Electric
- ABB Group
- Rockwell Automation Inc
- Yokogawa Electric Corporation
- Mitsubishi Motors Corporation
- Eurotek India
Key Developments in Water Automation and Instrumentation Market Industry
- May 2021: Schneider Electric partnered with Roca Group to accelerate decarbonization efforts, impacting the market by promoting sustainable water management solutions.
- March 2021: General Electric Company unveiled enhancements to its CIMPLICITY and Tracker software, boosting efficiency and decision-making capabilities for water utilities.
Strategic Outlook for Water Automation and Instrumentation Market Market
The Water Automation and Instrumentation market is poised for substantial growth, driven by ongoing technological advancements, increasing urbanization, and growing concerns about water scarcity. The integration of smart technologies, data analytics, and AI will continue to shape market trends, fostering innovation and creating opportunities for enhanced water management. Companies that can effectively adapt to these changes and offer integrated, cost-effective solutions will be well-positioned to capture market share and drive future growth. The long-term outlook remains highly positive, with significant potential for expansion in both developed and developing economies.
Water Automation And Instrumentation Market Segmentation
-
1. Water Automation Solution
- 1.1. DCS
- 1.2. SCADA
- 1.3. PLC
- 1.4. IAM
- 1.5. HMI
- 1.6. Other Water Automation Solutions
-
2. Water Instrumentation Solution
- 2.1. Pressure Transmitter
- 2.2. Level Transmitter
- 2.3. Temperature Transmitter
- 2.4. Liquid Analyzers
- 2.5. Gas Analyzers
- 2.6. Leakage Detection Systems
- 2.7. Flow Sensors/Transmitters
- 2.8. Other Water Instrumentation Solutions
-
3. End-user Industry
- 3.1. Chemical
- 3.2. Manufacturing
- 3.3. Food and Beverages
- 3.4. Utilities
- 3.5. Paper and Pulp
- 3.6. Other End-user Industries
Water Automation And Instrumentation Market Segmentation By Geography
-
1. North America
- 1.1. United States
- 1.2. Canada
-
2. Europe
- 2.1. Germany
- 2.2. United Kingdom
- 2.3. France
- 2.4. Italy
- 2.5. Rest of Europe
-
3. Asia Pacific
- 3.1. Australia
- 3.2. China
- 3.3. Japan
- 3.4. India
- 3.5. Rest of Asia Pacific
- 4. Latin America
-
5. Middle East and Africa
- 5.1. Saudi Arabia
- 5.2. United Arab Emirates
- 5.3. Rest of Middle East and Africa
Water Automation And Instrumentation Market REPORT HIGHLIGHTS
| Aspects | Details |
|---|---|
| Study Period | 2019-2033 |
| Base Year | 2024 |
| Estimated Year | 2025 |
| Forecast Period | 2025-2033 |
| Historical Period | 2019-2024 |
| Growth Rate | CAGR of 7.49% from 2019-2033 |
| Segmentation |
|
Table of Contents
- 1. Introduction
- 1.1. Research Scope
- 1.2. Market Segmentation
- 1.3. Research Methodology
- 1.4. Definitions and Assumptions
- 2. Executive Summary
- 2.1. Introduction
- 3. Market Dynamics
- 3.1. Introduction
- 3.2. Market Drivers
- 3.2.1. Government Regulation to Save Water Resources and Energy; Increase in Adoption of Smart Water Technologies
- 3.3. Market Restrains
- 3.3.1. Lack of Skilled Personnel to Operate Instrumentation
- 3.4. Market Trends
- 3.4.1. Demand from Food and Beverage Industry to Witness a Significant Growth Rate
- 4. Market Factor Analysis
- 4.1. Porters Five Forces
- 4.2. Supply/Value Chain
- 4.3. PESTEL analysis
- 4.4. Market Entropy
- 4.5. Patent/Trademark Analysis
- 5. Global Water Automation And Instrumentation Market Analysis, Insights and Forecast, 2019-2031
- 5.1. Market Analysis, Insights and Forecast - by Water Automation Solution
- 5.1.1. DCS
- 5.1.2. SCADA
- 5.1.3. PLC
- 5.1.4. IAM
- 5.1.5. HMI
- 5.1.6. Other Water Automation Solutions
- 5.2. Market Analysis, Insights and Forecast - by Water Instrumentation Solution
- 5.2.1. Pressure Transmitter
- 5.2.2. Level Transmitter
- 5.2.3. Temperature Transmitter
- 5.2.4. Liquid Analyzers
- 5.2.5. Gas Analyzers
- 5.2.6. Leakage Detection Systems
- 5.2.7. Flow Sensors/Transmitters
- 5.2.8. Other Water Instrumentation Solutions
- 5.3. Market Analysis, Insights and Forecast - by End-user Industry
- 5.3.1. Chemical
- 5.3.2. Manufacturing
- 5.3.3. Food and Beverages
- 5.3.4. Utilities
- 5.3.5. Paper and Pulp
- 5.3.6. Other End-user Industries
- 5.4. Market Analysis, Insights and Forecast - by Region
- 5.4.1. North America
- 5.4.2. Europe
- 5.4.3. Asia Pacific
- 5.4.4. Latin America
- 5.4.5. Middle East and Africa
- 5.1. Market Analysis, Insights and Forecast - by Water Automation Solution
- 6. North America Water Automation And Instrumentation Market Analysis, Insights and Forecast, 2019-2031
- 6.1. Market Analysis, Insights and Forecast - by Water Automation Solution
- 6.1.1. DCS
- 6.1.2. SCADA
- 6.1.3. PLC
- 6.1.4. IAM
- 6.1.5. HMI
- 6.1.6. Other Water Automation Solutions
- 6.2. Market Analysis, Insights and Forecast - by Water Instrumentation Solution
- 6.2.1. Pressure Transmitter
- 6.2.2. Level Transmitter
- 6.2.3. Temperature Transmitter
- 6.2.4. Liquid Analyzers
- 6.2.5. Gas Analyzers
- 6.2.6. Leakage Detection Systems
- 6.2.7. Flow Sensors/Transmitters
- 6.2.8. Other Water Instrumentation Solutions
- 6.3. Market Analysis, Insights and Forecast - by End-user Industry
- 6.3.1. Chemical
- 6.3.2. Manufacturing
- 6.3.3. Food and Beverages
- 6.3.4. Utilities
- 6.3.5. Paper and Pulp
- 6.3.6. Other End-user Industries
- 6.1. Market Analysis, Insights and Forecast - by Water Automation Solution
- 7. Europe Water Automation And Instrumentation Market Analysis, Insights and Forecast, 2019-2031
- 7.1. Market Analysis, Insights and Forecast - by Water Automation Solution
- 7.1.1. DCS
- 7.1.2. SCADA
- 7.1.3. PLC
- 7.1.4. IAM
- 7.1.5. HMI
- 7.1.6. Other Water Automation Solutions
- 7.2. Market Analysis, Insights and Forecast - by Water Instrumentation Solution
- 7.2.1. Pressure Transmitter
- 7.2.2. Level Transmitter
- 7.2.3. Temperature Transmitter
- 7.2.4. Liquid Analyzers
- 7.2.5. Gas Analyzers
- 7.2.6. Leakage Detection Systems
- 7.2.7. Flow Sensors/Transmitters
- 7.2.8. Other Water Instrumentation Solutions
- 7.3. Market Analysis, Insights and Forecast - by End-user Industry
- 7.3.1. Chemical
- 7.3.2. Manufacturing
- 7.3.3. Food and Beverages
- 7.3.4. Utilities
- 7.3.5. Paper and Pulp
- 7.3.6. Other End-user Industries
- 7.1. Market Analysis, Insights and Forecast - by Water Automation Solution
- 8. Asia Pacific Water Automation And Instrumentation Market Analysis, Insights and Forecast, 2019-2031
- 8.1. Market Analysis, Insights and Forecast - by Water Automation Solution
- 8.1.1. DCS
- 8.1.2. SCADA
- 8.1.3. PLC
- 8.1.4. IAM
- 8.1.5. HMI
- 8.1.6. Other Water Automation Solutions
- 8.2. Market Analysis, Insights and Forecast - by Water Instrumentation Solution
- 8.2.1. Pressure Transmitter
- 8.2.2. Level Transmitter
- 8.2.3. Temperature Transmitter
- 8.2.4. Liquid Analyzers
- 8.2.5. Gas Analyzers
- 8.2.6. Leakage Detection Systems
- 8.2.7. Flow Sensors/Transmitters
- 8.2.8. Other Water Instrumentation Solutions
- 8.3. Market Analysis, Insights and Forecast - by End-user Industry
- 8.3.1. Chemical
- 8.3.2. Manufacturing
- 8.3.3. Food and Beverages
- 8.3.4. Utilities
- 8.3.5. Paper and Pulp
- 8.3.6. Other End-user Industries
- 8.1. Market Analysis, Insights and Forecast - by Water Automation Solution
- 9. Latin America Water Automation And Instrumentation Market Analysis, Insights and Forecast, 2019-2031
- 9.1. Market Analysis, Insights and Forecast - by Water Automation Solution
- 9.1.1. DCS
- 9.1.2. SCADA
- 9.1.3. PLC
- 9.1.4. IAM
- 9.1.5. HMI
- 9.1.6. Other Water Automation Solutions
- 9.2. Market Analysis, Insights and Forecast - by Water Instrumentation Solution
- 9.2.1. Pressure Transmitter
- 9.2.2. Level Transmitter
- 9.2.3. Temperature Transmitter
- 9.2.4. Liquid Analyzers
- 9.2.5. Gas Analyzers
- 9.2.6. Leakage Detection Systems
- 9.2.7. Flow Sensors/Transmitters
- 9.2.8. Other Water Instrumentation Solutions
- 9.3. Market Analysis, Insights and Forecast - by End-user Industry
- 9.3.1. Chemical
- 9.3.2. Manufacturing
- 9.3.3. Food and Beverages
- 9.3.4. Utilities
- 9.3.5. Paper and Pulp
- 9.3.6. Other End-user Industries
- 9.1. Market Analysis, Insights and Forecast - by Water Automation Solution
- 10. Middle East and Africa Water Automation And Instrumentation Market Analysis, Insights and Forecast, 2019-2031
- 10.1. Market Analysis, Insights and Forecast - by Water Automation Solution
- 10.1.1. DCS
- 10.1.2. SCADA
- 10.1.3. PLC
- 10.1.4. IAM
- 10.1.5. HMI
- 10.1.6. Other Water Automation Solutions
- 10.2. Market Analysis, Insights and Forecast - by Water Instrumentation Solution
- 10.2.1. Pressure Transmitter
- 10.2.2. Level Transmitter
- 10.2.3. Temperature Transmitter
- 10.2.4. Liquid Analyzers
- 10.2.5. Gas Analyzers
- 10.2.6. Leakage Detection Systems
- 10.2.7. Flow Sensors/Transmitters
- 10.2.8. Other Water Instrumentation Solutions
- 10.3. Market Analysis, Insights and Forecast - by End-user Industry
- 10.3.1. Chemical
- 10.3.2. Manufacturing
- 10.3.3. Food and Beverages
- 10.3.4. Utilities
- 10.3.5. Paper and Pulp
- 10.3.6. Other End-user Industries
- 10.1. Market Analysis, Insights and Forecast - by Water Automation Solution
- 11. North America Water Automation And Instrumentation Market Analysis, Insights and Forecast, 2019-2031
- 11.1. Market Analysis, Insights and Forecast - By Country/Sub-region
- 11.1.1. undefined
- 12. Europe Water Automation And Instrumentation Market Analysis, Insights and Forecast, 2019-2031
- 12.1. Market Analysis, Insights and Forecast - By Country/Sub-region
- 12.1.1. undefined
- 13. Asia Pacific Water Automation And Instrumentation Market Analysis, Insights and Forecast, 2019-2031
- 13.1. Market Analysis, Insights and Forecast - By Country/Sub-region
- 13.1.1. undefined
- 14. South America Water Automation And Instrumentation Market Analysis, Insights and Forecast, 2019-2031
- 14.1. Market Analysis, Insights and Forecast - By Country/Sub-region
- 14.1.1. undefined
- 15. North America Water Automation And Instrumentation Market Analysis, Insights and Forecast, 2019-2031
- 15.1. Market Analysis, Insights and Forecast - By Country/Sub-region
- 15.1.1. undefined
- 16. MEA Water Automation And Instrumentation Market Analysis, Insights and Forecast, 2019-2031
- 16.1. Market Analysis, Insights and Forecast - By Country/Sub-region
- 16.1.1. undefined
- 17. Competitive Analysis
- 17.1. Global Market Share Analysis 2024
- 17.2. Company Profiles
- 17.2.1 NALCO
- 17.2.1.1. Overview
- 17.2.1.2. Products
- 17.2.1.3. SWOT Analysis
- 17.2.1.4. Recent Developments
- 17.2.1.5. Financials (Based on Availability)
- 17.2.2 Phoenix Contact
- 17.2.2.1. Overview
- 17.2.2.2. Products
- 17.2.2.3. SWOT Analysis
- 17.2.2.4. Recent Developments
- 17.2.2.5. Financials (Based on Availability)
- 17.2.3 Endress + Hauser Pvt Ltd
- 17.2.3.1. Overview
- 17.2.3.2. Products
- 17.2.3.3. SWOT Analysis
- 17.2.3.4. Recent Developments
- 17.2.3.5. Financials (Based on Availability)
- 17.2.4 GE Corporation
- 17.2.4.1. Overview
- 17.2.4.2. Products
- 17.2.4.3. SWOT Analysis
- 17.2.4.4. Recent Developments
- 17.2.4.5. Financials (Based on Availability)
- 17.2.5 KROHNE LT
- 17.2.5.1. Overview
- 17.2.5.2. Products
- 17.2.5.3. SWOT Analysis
- 17.2.5.4. Recent Developments
- 17.2.5.5. Financials (Based on Availability)
- 17.2.6 MJK Automation
- 17.2.6.1. Overview
- 17.2.6.2. Products
- 17.2.6.3. SWOT Analysis
- 17.2.6.4. Recent Developments
- 17.2.6.5. Financials (Based on Availability)
- 17.2.7 Siemens AG
- 17.2.7.1. Overview
- 17.2.7.2. Products
- 17.2.7.3. SWOT Analysis
- 17.2.7.4. Recent Developments
- 17.2.7.5. Financials (Based on Availability)
- 17.2.8 Schneider Electric SE
- 17.2.8.1. Overview
- 17.2.8.2. Products
- 17.2.8.3. SWOT Analysis
- 17.2.8.4. Recent Developments
- 17.2.8.5. Financials (Based on Availability)
- 17.2.9 Emerson Electric
- 17.2.9.1. Overview
- 17.2.9.2. Products
- 17.2.9.3. SWOT Analysis
- 17.2.9.4. Recent Developments
- 17.2.9.5. Financials (Based on Availability)
- 17.2.10 ABB Group
- 17.2.10.1. Overview
- 17.2.10.2. Products
- 17.2.10.3. SWOT Analysis
- 17.2.10.4. Recent Developments
- 17.2.10.5. Financials (Based on Availability)
- 17.2.11 Rockwell Automation Inc
- 17.2.11.1. Overview
- 17.2.11.2. Products
- 17.2.11.3. SWOT Analysis
- 17.2.11.4. Recent Developments
- 17.2.11.5. Financials (Based on Availability)
- 17.2.12 Yokogawa Electric Corporation
- 17.2.12.1. Overview
- 17.2.12.2. Products
- 17.2.12.3. SWOT Analysis
- 17.2.12.4. Recent Developments
- 17.2.12.5. Financials (Based on Availability)
- 17.2.13 Mitsubishi Motors Corporation
- 17.2.13.1. Overview
- 17.2.13.2. Products
- 17.2.13.3. SWOT Analysis
- 17.2.13.4. Recent Developments
- 17.2.13.5. Financials (Based on Availability)
- 17.2.14 Eurotek India
- 17.2.14.1. Overview
- 17.2.14.2. Products
- 17.2.14.3. SWOT Analysis
- 17.2.14.4. Recent Developments
- 17.2.14.5. Financials (Based on Availability)
- 17.2.1 NALCO
List of Figures
- Figure 1: Global Water Automation And Instrumentation Market Revenue Breakdown (Million, %) by Region 2024 & 2032
- Figure 2: Global Water Automation And Instrumentation Market Volume Breakdown (K Unit, %) by Region 2024 & 2032
- Figure 3: North America Water Automation And Instrumentation Market Revenue (Million), by Country 2024 & 2032
- Figure 4: North America Water Automation And Instrumentation Market Volume (K Unit), by Country 2024 & 2032
- Figure 5: North America Water Automation And Instrumentation Market Revenue Share (%), by Country 2024 & 2032
- Figure 6: North America Water Automation And Instrumentation Market Volume Share (%), by Country 2024 & 2032
- Figure 7: Europe Water Automation And Instrumentation Market Revenue (Million), by Country 2024 & 2032
- Figure 8: Europe Water Automation And Instrumentation Market Volume (K Unit), by Country 2024 & 2032
- Figure 9: Europe Water Automation And Instrumentation Market Revenue Share (%), by Country 2024 & 2032
- Figure 10: Europe Water Automation And Instrumentation Market Volume Share (%), by Country 2024 & 2032
- Figure 11: Asia Pacific Water Automation And Instrumentation Market Revenue (Million), by Country 2024 & 2032
- Figure 12: Asia Pacific Water Automation And Instrumentation Market Volume (K Unit), by Country 2024 & 2032
- Figure 13: Asia Pacific Water Automation And Instrumentation Market Revenue Share (%), by Country 2024 & 2032
- Figure 14: Asia Pacific Water Automation And Instrumentation Market Volume Share (%), by Country 2024 & 2032
- Figure 15: South America Water Automation And Instrumentation Market Revenue (Million), by Country 2024 & 2032
- Figure 16: South America Water Automation And Instrumentation Market Volume (K Unit), by Country 2024 & 2032
- Figure 17: South America Water Automation And Instrumentation Market Revenue Share (%), by Country 2024 & 2032
- Figure 18: South America Water Automation And Instrumentation Market Volume Share (%), by Country 2024 & 2032
- Figure 19: North America Water Automation And Instrumentation Market Revenue (Million), by Country 2024 & 2032
- Figure 20: North America Water Automation And Instrumentation Market Volume (K Unit), by Country 2024 & 2032
- Figure 21: North America Water Automation And Instrumentation Market Revenue Share (%), by Country 2024 & 2032
- Figure 22: North America Water Automation And Instrumentation Market Volume Share (%), by Country 2024 & 2032
- Figure 23: MEA Water Automation And Instrumentation Market Revenue (Million), by Country 2024 & 2032
- Figure 24: MEA Water Automation And Instrumentation Market Volume (K Unit), by Country 2024 & 2032
- Figure 25: MEA Water Automation And Instrumentation Market Revenue Share (%), by Country 2024 & 2032
- Figure 26: MEA Water Automation And Instrumentation Market Volume Share (%), by Country 2024 & 2032
- Figure 27: North America Water Automation And Instrumentation Market Revenue (Million), by Water Automation Solution 2024 & 2032
- Figure 28: North America Water Automation And Instrumentation Market Volume (K Unit), by Water Automation Solution 2024 & 2032
- Figure 29: North America Water Automation And Instrumentation Market Revenue Share (%), by Water Automation Solution 2024 & 2032
- Figure 30: North America Water Automation And Instrumentation Market Volume Share (%), by Water Automation Solution 2024 & 2032
- Figure 31: North America Water Automation And Instrumentation Market Revenue (Million), by Water Instrumentation Solution 2024 & 2032
- Figure 32: North America Water Automation And Instrumentation Market Volume (K Unit), by Water Instrumentation Solution 2024 & 2032
- Figure 33: North America Water Automation And Instrumentation Market Revenue Share (%), by Water Instrumentation Solution 2024 & 2032
- Figure 34: North America Water Automation And Instrumentation Market Volume Share (%), by Water Instrumentation Solution 2024 & 2032
- Figure 35: North America Water Automation And Instrumentation Market Revenue (Million), by End-user Industry 2024 & 2032
- Figure 36: North America Water Automation And Instrumentation Market Volume (K Unit), by End-user Industry 2024 & 2032
- Figure 37: North America Water Automation And Instrumentation Market Revenue Share (%), by End-user Industry 2024 & 2032
- Figure 38: North America Water Automation And Instrumentation Market Volume Share (%), by End-user Industry 2024 & 2032
- Figure 39: North America Water Automation And Instrumentation Market Revenue (Million), by Country 2024 & 2032
- Figure 40: North America Water Automation And Instrumentation Market Volume (K Unit), by Country 2024 & 2032
- Figure 41: North America Water Automation And Instrumentation Market Revenue Share (%), by Country 2024 & 2032
- Figure 42: North America Water Automation And Instrumentation Market Volume Share (%), by Country 2024 & 2032
- Figure 43: Europe Water Automation And Instrumentation Market Revenue (Million), by Water Automation Solution 2024 & 2032
- Figure 44: Europe Water Automation And Instrumentation Market Volume (K Unit), by Water Automation Solution 2024 & 2032
- Figure 45: Europe Water Automation And Instrumentation Market Revenue Share (%), by Water Automation Solution 2024 & 2032
- Figure 46: Europe Water Automation And Instrumentation Market Volume Share (%), by Water Automation Solution 2024 & 2032
- Figure 47: Europe Water Automation And Instrumentation Market Revenue (Million), by Water Instrumentation Solution 2024 & 2032
- Figure 48: Europe Water Automation And Instrumentation Market Volume (K Unit), by Water Instrumentation Solution 2024 & 2032
- Figure 49: Europe Water Automation And Instrumentation Market Revenue Share (%), by Water Instrumentation Solution 2024 & 2032
- Figure 50: Europe Water Automation And Instrumentation Market Volume Share (%), by Water Instrumentation Solution 2024 & 2032
- Figure 51: Europe Water Automation And Instrumentation Market Revenue (Million), by End-user Industry 2024 & 2032
- Figure 52: Europe Water Automation And Instrumentation Market Volume (K Unit), by End-user Industry 2024 & 2032
- Figure 53: Europe Water Automation And Instrumentation Market Revenue Share (%), by End-user Industry 2024 & 2032
- Figure 54: Europe Water Automation And Instrumentation Market Volume Share (%), by End-user Industry 2024 & 2032
- Figure 55: Europe Water Automation And Instrumentation Market Revenue (Million), by Country 2024 & 2032
- Figure 56: Europe Water Automation And Instrumentation Market Volume (K Unit), by Country 2024 & 2032
- Figure 57: Europe Water Automation And Instrumentation Market Revenue Share (%), by Country 2024 & 2032
- Figure 58: Europe Water Automation And Instrumentation Market Volume Share (%), by Country 2024 & 2032
- Figure 59: Asia Pacific Water Automation And Instrumentation Market Revenue (Million), by Water Automation Solution 2024 & 2032
- Figure 60: Asia Pacific Water Automation And Instrumentation Market Volume (K Unit), by Water Automation Solution 2024 & 2032
- Figure 61: Asia Pacific Water Automation And Instrumentation Market Revenue Share (%), by Water Automation Solution 2024 & 2032
- Figure 62: Asia Pacific Water Automation And Instrumentation Market Volume Share (%), by Water Automation Solution 2024 & 2032
- Figure 63: Asia Pacific Water Automation And Instrumentation Market Revenue (Million), by Water Instrumentation Solution 2024 & 2032
- Figure 64: Asia Pacific Water Automation And Instrumentation Market Volume (K Unit), by Water Instrumentation Solution 2024 & 2032
- Figure 65: Asia Pacific Water Automation And Instrumentation Market Revenue Share (%), by Water Instrumentation Solution 2024 & 2032
- Figure 66: Asia Pacific Water Automation And Instrumentation Market Volume Share (%), by Water Instrumentation Solution 2024 & 2032
- Figure 67: Asia Pacific Water Automation And Instrumentation Market Revenue (Million), by End-user Industry 2024 & 2032
- Figure 68: Asia Pacific Water Automation And Instrumentation Market Volume (K Unit), by End-user Industry 2024 & 2032
- Figure 69: Asia Pacific Water Automation And Instrumentation Market Revenue Share (%), by End-user Industry 2024 & 2032
- Figure 70: Asia Pacific Water Automation And Instrumentation Market Volume Share (%), by End-user Industry 2024 & 2032
- Figure 71: Asia Pacific Water Automation And Instrumentation Market Revenue (Million), by Country 2024 & 2032
- Figure 72: Asia Pacific Water Automation And Instrumentation Market Volume (K Unit), by Country 2024 & 2032
- Figure 73: Asia Pacific Water Automation And Instrumentation Market Revenue Share (%), by Country 2024 & 2032
- Figure 74: Asia Pacific Water Automation And Instrumentation Market Volume Share (%), by Country 2024 & 2032
- Figure 75: Latin America Water Automation And Instrumentation Market Revenue (Million), by Water Automation Solution 2024 & 2032
- Figure 76: Latin America Water Automation And Instrumentation Market Volume (K Unit), by Water Automation Solution 2024 & 2032
- Figure 77: Latin America Water Automation And Instrumentation Market Revenue Share (%), by Water Automation Solution 2024 & 2032
- Figure 78: Latin America Water Automation And Instrumentation Market Volume Share (%), by Water Automation Solution 2024 & 2032
- Figure 79: Latin America Water Automation And Instrumentation Market Revenue (Million), by Water Instrumentation Solution 2024 & 2032
- Figure 80: Latin America Water Automation And Instrumentation Market Volume (K Unit), by Water Instrumentation Solution 2024 & 2032
- Figure 81: Latin America Water Automation And Instrumentation Market Revenue Share (%), by Water Instrumentation Solution 2024 & 2032
- Figure 82: Latin America Water Automation And Instrumentation Market Volume Share (%), by Water Instrumentation Solution 2024 & 2032
- Figure 83: Latin America Water Automation And Instrumentation Market Revenue (Million), by End-user Industry 2024 & 2032
- Figure 84: Latin America Water Automation And Instrumentation Market Volume (K Unit), by End-user Industry 2024 & 2032
- Figure 85: Latin America Water Automation And Instrumentation Market Revenue Share (%), by End-user Industry 2024 & 2032
- Figure 86: Latin America Water Automation And Instrumentation Market Volume Share (%), by End-user Industry 2024 & 2032
- Figure 87: Latin America Water Automation And Instrumentation Market Revenue (Million), by Country 2024 & 2032
- Figure 88: Latin America Water Automation And Instrumentation Market Volume (K Unit), by Country 2024 & 2032
- Figure 89: Latin America Water Automation And Instrumentation Market Revenue Share (%), by Country 2024 & 2032
- Figure 90: Latin America Water Automation And Instrumentation Market Volume Share (%), by Country 2024 & 2032
- Figure 91: Middle East and Africa Water Automation And Instrumentation Market Revenue (Million), by Water Automation Solution 2024 & 2032
- Figure 92: Middle East and Africa Water Automation And Instrumentation Market Volume (K Unit), by Water Automation Solution 2024 & 2032
- Figure 93: Middle East and Africa Water Automation And Instrumentation Market Revenue Share (%), by Water Automation Solution 2024 & 2032
- Figure 94: Middle East and Africa Water Automation And Instrumentation Market Volume Share (%), by Water Automation Solution 2024 & 2032
- Figure 95: Middle East and Africa Water Automation And Instrumentation Market Revenue (Million), by Water Instrumentation Solution 2024 & 2032
- Figure 96: Middle East and Africa Water Automation And Instrumentation Market Volume (K Unit), by Water Instrumentation Solution 2024 & 2032
- Figure 97: Middle East and Africa Water Automation And Instrumentation Market Revenue Share (%), by Water Instrumentation Solution 2024 & 2032
- Figure 98: Middle East and Africa Water Automation And Instrumentation Market Volume Share (%), by Water Instrumentation Solution 2024 & 2032
- Figure 99: Middle East and Africa Water Automation And Instrumentation Market Revenue (Million), by End-user Industry 2024 & 2032
- Figure 100: Middle East and Africa Water Automation And Instrumentation Market Volume (K Unit), by End-user Industry 2024 & 2032
- Figure 101: Middle East and Africa Water Automation And Instrumentation Market Revenue Share (%), by End-user Industry 2024 & 2032
- Figure 102: Middle East and Africa Water Automation And Instrumentation Market Volume Share (%), by End-user Industry 2024 & 2032
- Figure 103: Middle East and Africa Water Automation And Instrumentation Market Revenue (Million), by Country 2024 & 2032
- Figure 104: Middle East and Africa Water Automation And Instrumentation Market Volume (K Unit), by Country 2024 & 2032
- Figure 105: Middle East and Africa Water Automation And Instrumentation Market Revenue Share (%), by Country 2024 & 2032
- Figure 106: Middle East and Africa Water Automation And Instrumentation Market Volume Share (%), by Country 2024 & 2032
List of Tables
- Table 1: Global Water Automation And Instrumentation Market Revenue Million Forecast, by Region 2019 & 2032
- Table 2: Global Water Automation And Instrumentation Market Volume K Unit Forecast, by Region 2019 & 2032
- Table 3: Global Water Automation And Instrumentation Market Revenue Million Forecast, by Water Automation Solution 2019 & 2032
- Table 4: Global Water Automation And Instrumentation Market Volume K Unit Forecast, by Water Automation Solution 2019 & 2032
- Table 5: Global Water Automation And Instrumentation Market Revenue Million Forecast, by Water Instrumentation Solution 2019 & 2032
- Table 6: Global Water Automation And Instrumentation Market Volume K Unit Forecast, by Water Instrumentation Solution 2019 & 2032
- Table 7: Global Water Automation And Instrumentation Market Revenue Million Forecast, by End-user Industry 2019 & 2032
- Table 8: Global Water Automation And Instrumentation Market Volume K Unit Forecast, by End-user Industry 2019 & 2032
- Table 9: Global Water Automation And Instrumentation Market Revenue Million Forecast, by Region 2019 & 2032
- Table 10: Global Water Automation And Instrumentation Market Volume K Unit Forecast, by Region 2019 & 2032
- Table 11: Global Water Automation And Instrumentation Market Revenue Million Forecast, by Country 2019 & 2032
- Table 12: Global Water Automation And Instrumentation Market Volume K Unit Forecast, by Country 2019 & 2032
- Table 13: Global Water Automation And Instrumentation Market Revenue Million Forecast, by Country 2019 & 2032
- Table 14: Global Water Automation And Instrumentation Market Volume K Unit Forecast, by Country 2019 & 2032
- Table 15: Global Water Automation And Instrumentation Market Revenue Million Forecast, by Country 2019 & 2032
- Table 16: Global Water Automation And Instrumentation Market Volume K Unit Forecast, by Country 2019 & 2032
- Table 17: Global Water Automation And Instrumentation Market Revenue Million Forecast, by Country 2019 & 2032
- Table 18: Global Water Automation And Instrumentation Market Volume K Unit Forecast, by Country 2019 & 2032
- Table 19: Global Water Automation And Instrumentation Market Revenue Million Forecast, by Country 2019 & 2032
- Table 20: Global Water Automation And Instrumentation Market Volume K Unit Forecast, by Country 2019 & 2032
- Table 21: Global Water Automation And Instrumentation Market Revenue Million Forecast, by Country 2019 & 2032
- Table 22: Global Water Automation And Instrumentation Market Volume K Unit Forecast, by Country 2019 & 2032
- Table 23: Global Water Automation And Instrumentation Market Revenue Million Forecast, by Water Automation Solution 2019 & 2032
- Table 24: Global Water Automation And Instrumentation Market Volume K Unit Forecast, by Water Automation Solution 2019 & 2032
- Table 25: Global Water Automation And Instrumentation Market Revenue Million Forecast, by Water Instrumentation Solution 2019 & 2032
- Table 26: Global Water Automation And Instrumentation Market Volume K Unit Forecast, by Water Instrumentation Solution 2019 & 2032
- Table 27: Global Water Automation And Instrumentation Market Revenue Million Forecast, by End-user Industry 2019 & 2032
- Table 28: Global Water Automation And Instrumentation Market Volume K Unit Forecast, by End-user Industry 2019 & 2032
- Table 29: Global Water Automation And Instrumentation Market Revenue Million Forecast, by Country 2019 & 2032
- Table 30: Global Water Automation And Instrumentation Market Volume K Unit Forecast, by Country 2019 & 2032
- Table 31: United States Water Automation And Instrumentation Market Revenue (Million) Forecast, by Application 2019 & 2032
- Table 32: United States Water Automation And Instrumentation Market Volume (K Unit) Forecast, by Application 2019 & 2032
- Table 33: Canada Water Automation And Instrumentation Market Revenue (Million) Forecast, by Application 2019 & 2032
- Table 34: Canada Water Automation And Instrumentation Market Volume (K Unit) Forecast, by Application 2019 & 2032
- Table 35: Global Water Automation And Instrumentation Market Revenue Million Forecast, by Water Automation Solution 2019 & 2032
- Table 36: Global Water Automation And Instrumentation Market Volume K Unit Forecast, by Water Automation Solution 2019 & 2032
- Table 37: Global Water Automation And Instrumentation Market Revenue Million Forecast, by Water Instrumentation Solution 2019 & 2032
- Table 38: Global Water Automation And Instrumentation Market Volume K Unit Forecast, by Water Instrumentation Solution 2019 & 2032
- Table 39: Global Water Automation And Instrumentation Market Revenue Million Forecast, by End-user Industry 2019 & 2032
- Table 40: Global Water Automation And Instrumentation Market Volume K Unit Forecast, by End-user Industry 2019 & 2032
- Table 41: Global Water Automation And Instrumentation Market Revenue Million Forecast, by Country 2019 & 2032
- Table 42: Global Water Automation And Instrumentation Market Volume K Unit Forecast, by Country 2019 & 2032
- Table 43: Germany Water Automation And Instrumentation Market Revenue (Million) Forecast, by Application 2019 & 2032
- Table 44: Germany Water Automation And Instrumentation Market Volume (K Unit) Forecast, by Application 2019 & 2032
- Table 45: United Kingdom Water Automation And Instrumentation Market Revenue (Million) Forecast, by Application 2019 & 2032
- Table 46: United Kingdom Water Automation And Instrumentation Market Volume (K Unit) Forecast, by Application 2019 & 2032
- Table 47: France Water Automation And Instrumentation Market Revenue (Million) Forecast, by Application 2019 & 2032
- Table 48: France Water Automation And Instrumentation Market Volume (K Unit) Forecast, by Application 2019 & 2032
- Table 49: Italy Water Automation And Instrumentation Market Revenue (Million) Forecast, by Application 2019 & 2032
- Table 50: Italy Water Automation And Instrumentation Market Volume (K Unit) Forecast, by Application 2019 & 2032
- Table 51: Rest of Europe Water Automation And Instrumentation Market Revenue (Million) Forecast, by Application 2019 & 2032
- Table 52: Rest of Europe Water Automation And Instrumentation Market Volume (K Unit) Forecast, by Application 2019 & 2032
- Table 53: Global Water Automation And Instrumentation Market Revenue Million Forecast, by Water Automation Solution 2019 & 2032
- Table 54: Global Water Automation And Instrumentation Market Volume K Unit Forecast, by Water Automation Solution 2019 & 2032
- Table 55: Global Water Automation And Instrumentation Market Revenue Million Forecast, by Water Instrumentation Solution 2019 & 2032
- Table 56: Global Water Automation And Instrumentation Market Volume K Unit Forecast, by Water Instrumentation Solution 2019 & 2032
- Table 57: Global Water Automation And Instrumentation Market Revenue Million Forecast, by End-user Industry 2019 & 2032
- Table 58: Global Water Automation And Instrumentation Market Volume K Unit Forecast, by End-user Industry 2019 & 2032
- Table 59: Global Water Automation And Instrumentation Market Revenue Million Forecast, by Country 2019 & 2032
- Table 60: Global Water Automation And Instrumentation Market Volume K Unit Forecast, by Country 2019 & 2032
- Table 61: Australia Water Automation And Instrumentation Market Revenue (Million) Forecast, by Application 2019 & 2032
- Table 62: Australia Water Automation And Instrumentation Market Volume (K Unit) Forecast, by Application 2019 & 2032
- Table 63: China Water Automation And Instrumentation Market Revenue (Million) Forecast, by Application 2019 & 2032
- Table 64: China Water Automation And Instrumentation Market Volume (K Unit) Forecast, by Application 2019 & 2032
- Table 65: Japan Water Automation And Instrumentation Market Revenue (Million) Forecast, by Application 2019 & 2032
- Table 66: Japan Water Automation And Instrumentation Market Volume (K Unit) Forecast, by Application 2019 & 2032
- Table 67: India Water Automation And Instrumentation Market Revenue (Million) Forecast, by Application 2019 & 2032
- Table 68: India Water Automation And Instrumentation Market Volume (K Unit) Forecast, by Application 2019 & 2032
- Table 69: Rest of Asia Pacific Water Automation And Instrumentation Market Revenue (Million) Forecast, by Application 2019 & 2032
- Table 70: Rest of Asia Pacific Water Automation And Instrumentation Market Volume (K Unit) Forecast, by Application 2019 & 2032
- Table 71: Global Water Automation And Instrumentation Market Revenue Million Forecast, by Water Automation Solution 2019 & 2032
- Table 72: Global Water Automation And Instrumentation Market Volume K Unit Forecast, by Water Automation Solution 2019 & 2032
- Table 73: Global Water Automation And Instrumentation Market Revenue Million Forecast, by Water Instrumentation Solution 2019 & 2032
- Table 74: Global Water Automation And Instrumentation Market Volume K Unit Forecast, by Water Instrumentation Solution 2019 & 2032
- Table 75: Global Water Automation And Instrumentation Market Revenue Million Forecast, by End-user Industry 2019 & 2032
- Table 76: Global Water Automation And Instrumentation Market Volume K Unit Forecast, by End-user Industry 2019 & 2032
- Table 77: Global Water Automation And Instrumentation Market Revenue Million Forecast, by Country 2019 & 2032
- Table 78: Global Water Automation And Instrumentation Market Volume K Unit Forecast, by Country 2019 & 2032
- Table 79: Global Water Automation And Instrumentation Market Revenue Million Forecast, by Water Automation Solution 2019 & 2032
- Table 80: Global Water Automation And Instrumentation Market Volume K Unit Forecast, by Water Automation Solution 2019 & 2032
- Table 81: Global Water Automation And Instrumentation Market Revenue Million Forecast, by Water Instrumentation Solution 2019 & 2032
- Table 82: Global Water Automation And Instrumentation Market Volume K Unit Forecast, by Water Instrumentation Solution 2019 & 2032
- Table 83: Global Water Automation And Instrumentation Market Revenue Million Forecast, by End-user Industry 2019 & 2032
- Table 84: Global Water Automation And Instrumentation Market Volume K Unit Forecast, by End-user Industry 2019 & 2032
- Table 85: Global Water Automation And Instrumentation Market Revenue Million Forecast, by Country 2019 & 2032
- Table 86: Global Water Automation And Instrumentation Market Volume K Unit Forecast, by Country 2019 & 2032
- Table 87: Saudi Arabia Water Automation And Instrumentation Market Revenue (Million) Forecast, by Application 2019 & 2032
- Table 88: Saudi Arabia Water Automation And Instrumentation Market Volume (K Unit) Forecast, by Application 2019 & 2032
- Table 89: United Arab Emirates Water Automation And Instrumentation Market Revenue (Million) Forecast, by Application 2019 & 2032
- Table 90: United Arab Emirates Water Automation And Instrumentation Market Volume (K Unit) Forecast, by Application 2019 & 2032
- Table 91: Rest of Middle East and Africa Water Automation And Instrumentation Market Revenue (Million) Forecast, by Application 2019 & 2032
- Table 92: Rest of Middle East and Africa Water Automation And Instrumentation Market Volume (K Unit) Forecast, by Application 2019 & 2032
Frequently Asked Questions
1. What is the projected Compound Annual Growth Rate (CAGR) of the Water Automation And Instrumentation Market?
The projected CAGR is approximately 7.49%.
2. Which companies are prominent players in the Water Automation And Instrumentation Market?
Key companies in the market include NALCO, Phoenix Contact, Endress + Hauser Pvt Ltd, GE Corporation, KROHNE LT, MJK Automation, Siemens AG, Schneider Electric SE, Emerson Electric, ABB Group, Rockwell Automation Inc, Yokogawa Electric Corporation, Mitsubishi Motors Corporation, Eurotek India.
3. What are the main segments of the Water Automation And Instrumentation Market?
The market segments include Water Automation Solution, Water Instrumentation Solution, End-user Industry.
4. Can you provide details about the market size?
The market size is estimated to be USD 4.12 Million as of 2022.
5. What are some drivers contributing to market growth?
Government Regulation to Save Water Resources and Energy; Increase in Adoption of Smart Water Technologies.
6. What are the notable trends driving market growth?
Demand from Food and Beverage Industry to Witness a Significant Growth Rate.
7. Are there any restraints impacting market growth?
Lack of Skilled Personnel to Operate Instrumentation.
8. Can you provide examples of recent developments in the market?
May 2021 - Schneider Electric partnered with Roca Group to accelerate decarbonization. Roca Group, a world leader in the design, production, and commercialization of products, defines a new roadmap toward decarbonization, establishing a single, global strategy across the Group.
9. What pricing options are available for accessing the report?
Pricing options include single-user, multi-user, and enterprise licenses priced at USD 4750, USD 5250, and USD 8750 respectively.
10. Is the market size provided in terms of value or volume?
The market size is provided in terms of value, measured in Million and volume, measured in K Unit.
11. Are there any specific market keywords associated with the report?
Yes, the market keyword associated with the report is "Water Automation And Instrumentation Market," which aids in identifying and referencing the specific market segment covered.
12. How do I determine which pricing option suits my needs best?
The pricing options vary based on user requirements and access needs. Individual users may opt for single-user licenses, while businesses requiring broader access may choose multi-user or enterprise licenses for cost-effective access to the report.
13. Are there any additional resources or data provided in the Water Automation And Instrumentation Market report?
While the report offers comprehensive insights, it's advisable to review the specific contents or supplementary materials provided to ascertain if additional resources or data are available.
14. How can I stay updated on further developments or reports in the Water Automation And Instrumentation Market?
To stay informed about further developments, trends, and reports in the Water Automation And Instrumentation Market, consider subscribing to industry newsletters, following relevant companies and organizations, or regularly checking reputable industry news sources and publications.
Methodology
Step 1 - Identification of Relevant Samples Size from Population Database


Step 2 - Approaches for Defining Global Market Size (Value, Volume* & Price*)

Note*: In applicable scenarios
Step 3 - Data Sources
Primary Research
- Web Analytics
- Survey Reports
- Research Institute
- Latest Research Reports
- Opinion Leaders
Secondary Research
- Annual Reports
- White Paper
- Latest Press Release
- Industry Association
- Paid Database
- Investor Presentations

Step 4 - Data Triangulation
Involves using different sources of information in order to increase the validity of a study
These sources are likely to be stakeholders in a program - participants, other researchers, program staff, other community members, and so on.
Then we put all data in single framework & apply various statistical tools to find out the dynamic on the market.
During the analysis stage, feedback from the stakeholder groups would be compared to determine areas of agreement as well as areas of divergence


