

Key Insights
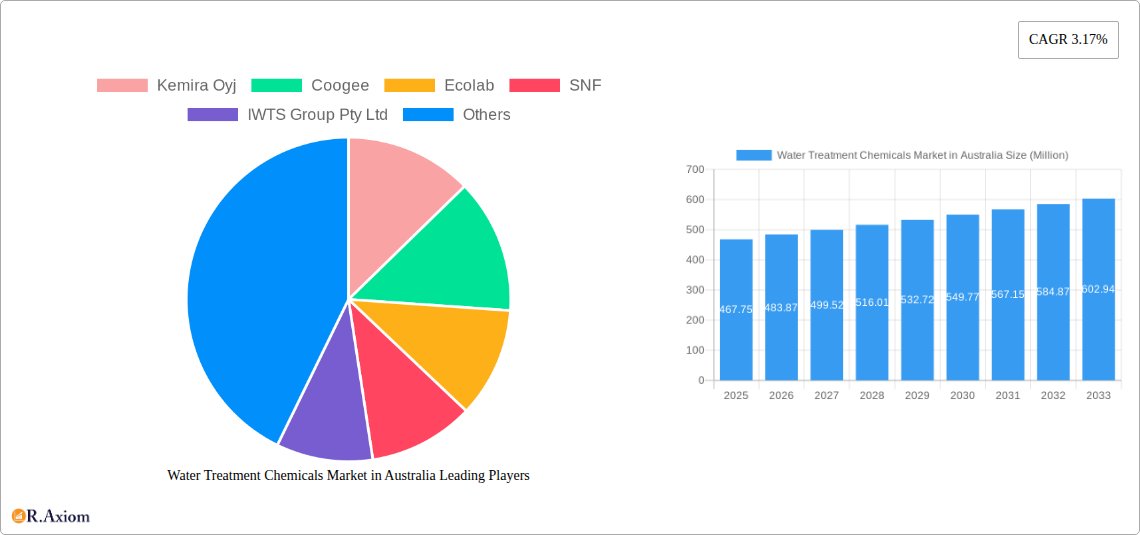
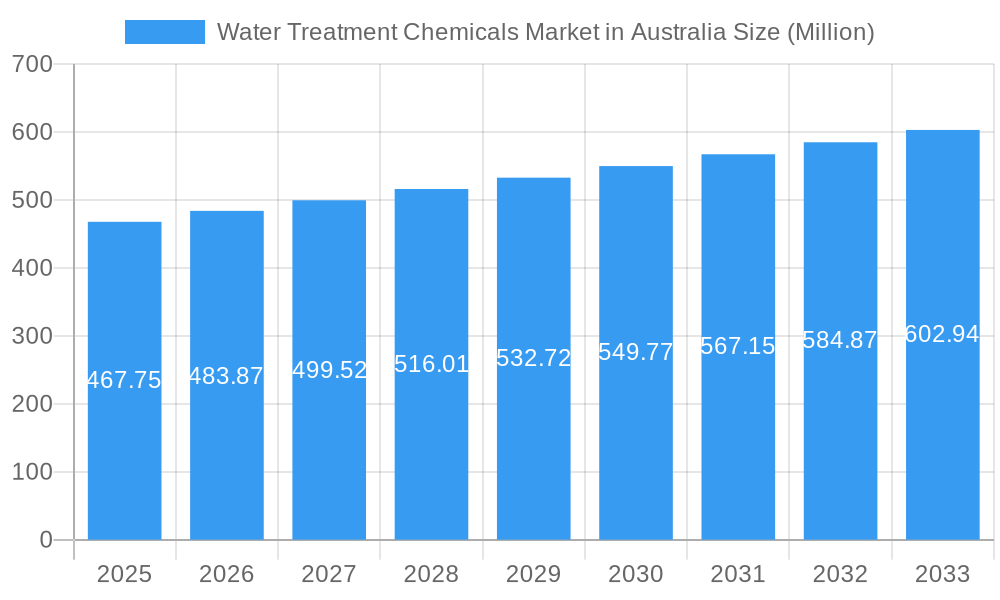
The Australian water treatment chemicals market, valued at $467.75 million in 2025, is projected to experience steady growth, driven by increasing urbanization, stringent environmental regulations, and the rising demand for potable water. The market's Compound Annual Growth Rate (CAGR) of 3.17% from 2019 to 2024 suggests a continued expansion through 2033. Key market segments include biocides and disinfectants, essential for maintaining water purity, and coagulants and flocculants, crucial for removing impurities. The power generation, oil and gas, and mining sectors are significant end-users, reflecting the vital role of water treatment in these industries. Growth is further propelled by advancements in chemical formulations leading to more efficient and environmentally friendly solutions. However, market expansion might face some restraints, including fluctuations in raw material prices and the potential for stricter environmental regulations impacting production costs. Leading companies like Kemira Oyj, Ecolab, and SNF are shaping market dynamics through technological innovation and strategic partnerships. The robust growth outlook indicates a promising investment opportunity for businesses involved in the supply and application of water treatment chemicals in Australia.
Water Treatment Chemicals Market in Australia Market Size (In Million)
The forecast period (2025-2033) is expected to see continued growth, albeit at a potentially moderated rate compared to the historical period, due to a leveling-off of some of the initial drivers. Factors such as government initiatives promoting water conservation and reuse, along with increasing adoption of advanced water treatment technologies, will continue to shape market trends. The competitive landscape remains dynamic, with both established multinational corporations and regional players vying for market share. Product innovation focusing on sustainable and cost-effective solutions will be critical for success in this evolving market. Specific regional variations within Australia might also influence market segmentation and growth patterns in the coming years. Further analysis focusing on specific sub-segments and regional breakdowns could provide a more detailed understanding of growth drivers and opportunities within this sector.
Water Treatment Chemicals Market in Australia Company Market Share
Water Treatment Chemicals Market in Australia: A Comprehensive Market Report (2019-2033)
This comprehensive report provides a detailed analysis of the Water Treatment Chemicals market in Australia, offering valuable insights for industry stakeholders, investors, and strategic decision-makers. The study period covers 2019-2033, with 2025 as the base year and a forecast period of 2025-2033. The report leverages extensive primary and secondary research to deliver a robust understanding of market dynamics, segmentation, growth drivers, challenges, and emerging opportunities.
Water Treatment Chemicals Market in Australia Market Concentration & Innovation
The Australian water treatment chemicals market exhibits a moderately concentrated landscape, with a handful of multinational corporations holding significant market share. Key players like Kemira Oyj, Ecolab, SNF, and Solvay compete intensely, often leveraging technological innovation and strategic partnerships to maintain their position. The market share of the top five players is estimated to be around xx% in 2025. Smaller, regional players such as IWTS Group Pty Ltd, Ixom, and Aquasol cater to niche segments and localized needs.
M&A activity has been relatively moderate in recent years, with deal values totaling approximately xx Million AUD in the period 2019-2024. However, increasing environmental regulations and the growing demand for sustainable water management solutions are expected to drive further consolidation in the coming years.
Innovation Drivers:
- Stringent environmental regulations pushing for advanced treatment technologies.
- Growing demand for cost-effective and efficient water treatment solutions.
- Advancements in chemical formulations leading to improved performance and reduced environmental impact.
Regulatory Framework: The market is subject to stringent environmental regulations at both the federal and state levels, influencing the choice of chemicals and treatment processes.
Product Substitutes: The market faces competition from alternative water treatment technologies, such as membrane filtration and advanced oxidation processes.
End-User Trends: Increasing industrialization, urbanization, and population growth contribute to heightened demand for water treatment chemicals across various end-user sectors.
Water Treatment Chemicals Market in Australia Industry Trends & Insights
The Australian water treatment chemicals market is projected to experience a CAGR of xx% during the forecast period (2025-2033). This growth is primarily driven by increasing concerns about water scarcity and water quality, coupled with stringent environmental regulations. The market penetration of advanced treatment technologies, particularly in the municipal and industrial sectors, remains relatively low, indicating significant growth potential. Technological disruptions, such as the development of bio-based and sustainable chemicals, are reshaping the competitive landscape. Consumer preference is shifting towards environmentally friendly and sustainable water treatment solutions. Furthermore, intense competition forces companies to continuously innovate and optimize their offerings. Market growth is also influenced by fluctuations in raw material prices and economic cycles. The increasing adoption of smart water management solutions, including real-time monitoring and control systems, further contributes to the growth.
Dominant Markets & Segments in Water Treatment Chemicals Market in Australia
The municipal segment is currently the largest end-user industry for water treatment chemicals in Australia, followed by the mining and mineral processing sector. The dominance of the municipal segment is driven by large-scale investments in water infrastructure development and upgrades, and the need to meet stringent water quality standards. The mining sector's contribution reflects the industry's high water usage and demand for effective water treatment solutions to minimize environmental impact and manage water scarcity. Within product types, coagulants and flocculants represent the largest segment, driven by their widespread application in various water treatment processes.
Key Drivers for Dominant Segments:
- Municipal: Stringent government regulations, rising urbanization, and investments in water infrastructure upgrades.
- Mining and Mineral Processing: High water consumption, need for effective wastewater treatment, and stringent environmental regulations.
- Coagulants and Flocculants: Wide applicability in various treatment processes, cost-effectiveness, and established market presence.
Water Treatment Chemicals Market in Australia Product Developments
Recent product developments focus on enhancing efficiency, reducing environmental impact, and meeting stringent regulatory requirements. Companies are increasingly focusing on developing bio-based and sustainable alternatives to traditional chemicals, along with advanced formulations offering improved performance and reduced dosage rates. The development of intelligent water treatment systems that utilize data analytics and automation technologies is a significant trend. This allows for more precise chemical dosing and optimized treatment processes, ultimately leading to improved efficiency and cost savings.
Report Scope & Segmentation Analysis
This report segments the Australian water treatment chemicals market by Product Type (Biocides and Disinfectants, Coagulants and Flocculants, Corrosion and Scale Inhibitors, Defoamers and Defoaming Agents, pH Conditioners/Adjusters, Other Product Types) and End-user Industry (Power Generation, Oil and Gas, Chemical Manufacturing, Mining and Mineral Processing, Municipal, Food and Beverage, Pulp and Paper, Other End-user Industries). Each segment's market size, growth projections, and competitive dynamics are analyzed in detail. Market size for each segment is expected to reach xx Million AUD by 2033. Competitive dynamics include pricing strategies, technological innovation, and market share.
Key Drivers of Water Treatment Chemicals Market in Australia Growth
Several factors are driving the market's growth, including:
- Stringent environmental regulations mandating improved water quality.
- Increasing water scarcity and the need for efficient water management strategies.
- Rising industrialization and urbanization leading to higher water consumption.
- Growing investments in water infrastructure development and modernization.
- Technological advancements leading to the development of more efficient and sustainable water treatment solutions.
Challenges in the Water Treatment Chemicals Market in Australia Sector
The market faces several challenges including:
- Fluctuations in raw material prices impacting production costs.
- Stringent environmental regulations requiring continuous innovation and compliance efforts.
- Intense competition from both domestic and international players.
- Potential supply chain disruptions impacting availability and cost of chemicals.
Emerging Opportunities in Water Treatment Chemicals Market in Australia
Emerging opportunities include:
- Growing demand for sustainable and environmentally friendly water treatment solutions.
- Increased adoption of advanced treatment technologies, such as membrane filtration and advanced oxidation processes.
- Expansion into new and emerging end-user segments, such as renewable energy.
- Development of smart water management systems integrating real-time monitoring and control capabilities.
Leading Players in the Water Treatment Chemicals Market in Australia Market
- Kemira Oyj
- Coogee
- Ecolab
- SNF
- IWTS Group Pty Ltd
- Solvay
- Buckman
- Aquasol
- Dow
- Solenis
- Ixom
- Albemarle Corporation
- Veolia (Veolia Water Technologies)
Key Developments in Water Treatment Chemicals Market in Australia Industry
- June 2022: Kemira Oyj announced a collaboration with Veolia to launch ViviMag technology for phosphorus recovery from sewage sludge.
- April 2022: Veolia Group partnered with Sydney Water to explore circular economy opportunities for sustainable water services.
Strategic Outlook for Water Treatment Chemicals Market in Australia Market
The Australian water treatment chemicals market holds significant growth potential driven by increasing water scarcity, stringent environmental regulations, and growing investments in water infrastructure. The focus on sustainable and environmentally friendly solutions, coupled with technological advancements, will continue to shape the market's future. Companies that invest in research and development, adopt sustainable practices, and build strategic partnerships are expected to gain a competitive advantage. The market is poised for continued growth, driven by both existing and emerging end-user sectors.
Water Treatment Chemicals Market in Australia Segmentation
-
1. Product Type
- 1.1. Biocides and Disinfectants
- 1.2. Coagulants and Flocculants
- 1.3. Corrosion and Scale Inhibitors
- 1.4. Defoamers and Defoaming Agents
- 1.5. pH Conditioners/Adjusters
- 1.6. Other Product Types
-
2. End-user Industry
- 2.1. Power Generation
- 2.2. Oil and Gas
- 2.3. Chemical Manufacturing
- 2.4. Mining and Mineral Processing
- 2.5. Municipal
- 2.6. Food and Beverage
- 2.7. Pulp and Paper
- 2.8. Other End-user Industries
Water Treatment Chemicals Market in Australia Segmentation By Geography
-
1. North America
- 1.1. United States
- 1.2. Canada
- 1.3. Mexico
-
2. South America
- 2.1. Brazil
- 2.2. Argentina
- 2.3. Rest of South America
-
3. Europe
- 3.1. United Kingdom
- 3.2. Germany
- 3.3. France
- 3.4. Italy
- 3.5. Spain
- 3.6. Russia
- 3.7. Benelux
- 3.8. Nordics
- 3.9. Rest of Europe
-
4. Middle East & Africa
- 4.1. Turkey
- 4.2. Israel
- 4.3. GCC
- 4.4. North Africa
- 4.5. South Africa
- 4.6. Rest of Middle East & Africa
-
5. Asia Pacific
- 5.1. China
- 5.2. India
- 5.3. Japan
- 5.4. South Korea
- 5.5. ASEAN
- 5.6. Oceania
- 5.7. Rest of Asia Pacific
Water Treatment Chemicals Market in Australia Regional Market Share
Geographic Coverage of Water Treatment Chemicals Market in Australia
Water Treatment Chemicals Market in Australia REPORT HIGHLIGHTS
| Aspects | Details |
|---|---|
| Study Period | 2020-2034 |
| Base Year | 2025 |
| Estimated Year | 2026 |
| Forecast Period | 2026-2034 |
| Historical Period | 2020-2025 |
| Growth Rate | CAGR of 3.17% from 2020-2034 |
| Segmentation |
|
Table of Contents
- 1. Introduction
- 1.1. Research Scope
- 1.2. Market Segmentation
- 1.3. Research Objective
- 1.4. Definitions and Assumptions
- 2. Executive Summary
- 2.1. Market Snapshot
- 3. Market Dynamics
- 3.1. Market Drivers
- 3.2. Market Restrains
- 3.3. Market Trends
- 3.4. Market Opportunities
- 4. Market Factor Analysis
- 4.1. Porters Five Forces
- 4.1.1. Bargaining Power of Suppliers
- 4.1.2. Bargaining Power of Buyers
- 4.1.3. Threat of New Entrants
- 4.1.4. Threat of Substitutes
- 4.1.5. Competitive Rivalry
- 4.2. PESTEL analysis
- 4.3. BCG Analysis
- 4.3.1. Stars (High Growth, High Market Share)
- 4.3.2. Cash Cows (Low Growth, High Market Share)
- 4.3.3. Question Mark (High Growth, Low Market Share)
- 4.3.4. Dogs (Low Growth, Low Market Share)
- 4.4. Ansoff Matrix Analysis
- 4.5. Supply Chain Analysis
- 4.6. Regulatory Landscape
- 4.7. Current Market Potential and Opportunity Assessment (TAM–SAM–SOM Framework)
- 4.8. RAX Analyst Note
- 4.1. Porters Five Forces
- 5. Market Analysis, Insights and Forecast 2021-2033
- 5.1. Market Analysis, Insights and Forecast - by Product Type
- 5.1.1. Biocides and Disinfectants
- 5.1.2. Coagulants and Flocculants
- 5.1.3. Corrosion and Scale Inhibitors
- 5.1.4. Defoamers and Defoaming Agents
- 5.1.5. pH Conditioners/Adjusters
- 5.1.6. Other Product Types
- 5.2. Market Analysis, Insights and Forecast - by End-user Industry
- 5.2.1. Power Generation
- 5.2.2. Oil and Gas
- 5.2.3. Chemical Manufacturing
- 5.2.4. Mining and Mineral Processing
- 5.2.5. Municipal
- 5.2.6. Food and Beverage
- 5.2.7. Pulp and Paper
- 5.2.8. Other End-user Industries
- 5.3. Market Analysis, Insights and Forecast - by Region
- 5.3.1. North America
- 5.3.2. South America
- 5.3.3. Europe
- 5.3.4. Middle East & Africa
- 5.3.5. Asia Pacific
- 5.1. Market Analysis, Insights and Forecast - by Product Type
- 6. Global Water Treatment Chemicals Market in Australia Analysis, Insights and Forecast, 2021-2033
- 6.1. Market Analysis, Insights and Forecast - by Product Type
- 6.1.1. Biocides and Disinfectants
- 6.1.2. Coagulants and Flocculants
- 6.1.3. Corrosion and Scale Inhibitors
- 6.1.4. Defoamers and Defoaming Agents
- 6.1.5. pH Conditioners/Adjusters
- 6.1.6. Other Product Types
- 6.2. Market Analysis, Insights and Forecast - by End-user Industry
- 6.2.1. Power Generation
- 6.2.2. Oil and Gas
- 6.2.3. Chemical Manufacturing
- 6.2.4. Mining and Mineral Processing
- 6.2.5. Municipal
- 6.2.6. Food and Beverage
- 6.2.7. Pulp and Paper
- 6.2.8. Other End-user Industries
- 6.1. Market Analysis, Insights and Forecast - by Product Type
- 7. North America Water Treatment Chemicals Market in Australia Analysis, Insights and Forecast, 2020-2032
- 7.1. Market Analysis, Insights and Forecast - by Product Type
- 7.1.1. Biocides and Disinfectants
- 7.1.2. Coagulants and Flocculants
- 7.1.3. Corrosion and Scale Inhibitors
- 7.1.4. Defoamers and Defoaming Agents
- 7.1.5. pH Conditioners/Adjusters
- 7.1.6. Other Product Types
- 7.2. Market Analysis, Insights and Forecast - by End-user Industry
- 7.2.1. Power Generation
- 7.2.2. Oil and Gas
- 7.2.3. Chemical Manufacturing
- 7.2.4. Mining and Mineral Processing
- 7.2.5. Municipal
- 7.2.6. Food and Beverage
- 7.2.7. Pulp and Paper
- 7.2.8. Other End-user Industries
- 7.1. Market Analysis, Insights and Forecast - by Product Type
- 8. South America Water Treatment Chemicals Market in Australia Analysis, Insights and Forecast, 2020-2032
- 8.1. Market Analysis, Insights and Forecast - by Product Type
- 8.1.1. Biocides and Disinfectants
- 8.1.2. Coagulants and Flocculants
- 8.1.3. Corrosion and Scale Inhibitors
- 8.1.4. Defoamers and Defoaming Agents
- 8.1.5. pH Conditioners/Adjusters
- 8.1.6. Other Product Types
- 8.2. Market Analysis, Insights and Forecast - by End-user Industry
- 8.2.1. Power Generation
- 8.2.2. Oil and Gas
- 8.2.3. Chemical Manufacturing
- 8.2.4. Mining and Mineral Processing
- 8.2.5. Municipal
- 8.2.6. Food and Beverage
- 8.2.7. Pulp and Paper
- 8.2.8. Other End-user Industries
- 8.1. Market Analysis, Insights and Forecast - by Product Type
- 9. Europe Water Treatment Chemicals Market in Australia Analysis, Insights and Forecast, 2020-2032
- 9.1. Market Analysis, Insights and Forecast - by Product Type
- 9.1.1. Biocides and Disinfectants
- 9.1.2. Coagulants and Flocculants
- 9.1.3. Corrosion and Scale Inhibitors
- 9.1.4. Defoamers and Defoaming Agents
- 9.1.5. pH Conditioners/Adjusters
- 9.1.6. Other Product Types
- 9.2. Market Analysis, Insights and Forecast - by End-user Industry
- 9.2.1. Power Generation
- 9.2.2. Oil and Gas
- 9.2.3. Chemical Manufacturing
- 9.2.4. Mining and Mineral Processing
- 9.2.5. Municipal
- 9.2.6. Food and Beverage
- 9.2.7. Pulp and Paper
- 9.2.8. Other End-user Industries
- 9.1. Market Analysis, Insights and Forecast - by Product Type
- 10. Middle East & Africa Water Treatment Chemicals Market in Australia Analysis, Insights and Forecast, 2020-2032
- 10.1. Market Analysis, Insights and Forecast - by Product Type
- 10.1.1. Biocides and Disinfectants
- 10.1.2. Coagulants and Flocculants
- 10.1.3. Corrosion and Scale Inhibitors
- 10.1.4. Defoamers and Defoaming Agents
- 10.1.5. pH Conditioners/Adjusters
- 10.1.6. Other Product Types
- 10.2. Market Analysis, Insights and Forecast - by End-user Industry
- 10.2.1. Power Generation
- 10.2.2. Oil and Gas
- 10.2.3. Chemical Manufacturing
- 10.2.4. Mining and Mineral Processing
- 10.2.5. Municipal
- 10.2.6. Food and Beverage
- 10.2.7. Pulp and Paper
- 10.2.8. Other End-user Industries
- 10.1. Market Analysis, Insights and Forecast - by Product Type
- 11. Asia Pacific Water Treatment Chemicals Market in Australia Analysis, Insights and Forecast, 2020-2032
- 11.1. Market Analysis, Insights and Forecast - by Product Type
- 11.1.1. Biocides and Disinfectants
- 11.1.2. Coagulants and Flocculants
- 11.1.3. Corrosion and Scale Inhibitors
- 11.1.4. Defoamers and Defoaming Agents
- 11.1.5. pH Conditioners/Adjusters
- 11.1.6. Other Product Types
- 11.2. Market Analysis, Insights and Forecast - by End-user Industry
- 11.2.1. Power Generation
- 11.2.2. Oil and Gas
- 11.2.3. Chemical Manufacturing
- 11.2.4. Mining and Mineral Processing
- 11.2.5. Municipal
- 11.2.6. Food and Beverage
- 11.2.7. Pulp and Paper
- 11.2.8. Other End-user Industries
- 11.1. Market Analysis, Insights and Forecast - by Product Type
- 12. Competitive Analysis
- 12.1. Company Profiles
- 12.1.1 Kemira Oyj
- 12.1.1.1. Company Overview
- 12.1.1.2. Products
- 12.1.1.3. Company Financials
- 12.1.1.4. SWOT Analysis
- 12.1.2 Coogee
- 12.1.2.1. Company Overview
- 12.1.2.2. Products
- 12.1.2.3. Company Financials
- 12.1.2.4. SWOT Analysis
- 12.1.3 Ecolab
- 12.1.3.1. Company Overview
- 12.1.3.2. Products
- 12.1.3.3. Company Financials
- 12.1.3.4. SWOT Analysis
- 12.1.4 SNF
- 12.1.4.1. Company Overview
- 12.1.4.2. Products
- 12.1.4.3. Company Financials
- 12.1.4.4. SWOT Analysis
- 12.1.5 IWTS Group Pty Ltd
- 12.1.5.1. Company Overview
- 12.1.5.2. Products
- 12.1.5.3. Company Financials
- 12.1.5.4. SWOT Analysis
- 12.1.6 Solvay
- 12.1.6.1. Company Overview
- 12.1.6.2. Products
- 12.1.6.3. Company Financials
- 12.1.6.4. SWOT Analysis
- 12.1.7 Buckman
- 12.1.7.1. Company Overview
- 12.1.7.2. Products
- 12.1.7.3. Company Financials
- 12.1.7.4. SWOT Analysis
- 12.1.8 Aquasol
- 12.1.8.1. Company Overview
- 12.1.8.2. Products
- 12.1.8.3. Company Financials
- 12.1.8.4. SWOT Analysis
- 12.1.9 Dow
- 12.1.9.1. Company Overview
- 12.1.9.2. Products
- 12.1.9.3. Company Financials
- 12.1.9.4. SWOT Analysis
- 12.1.10 Solenis
- 12.1.10.1. Company Overview
- 12.1.10.2. Products
- 12.1.10.3. Company Financials
- 12.1.10.4. SWOT Analysis
- 12.1.11 Ixom
- 12.1.11.1. Company Overview
- 12.1.11.2. Products
- 12.1.11.3. Company Financials
- 12.1.11.4. SWOT Analysis
- 12.1.12 Albemarle Corporation
- 12.1.12.1. Company Overview
- 12.1.12.2. Products
- 12.1.12.3. Company Financials
- 12.1.12.4. SWOT Analysis
- 12.1.13 Veolia (Veolia Water Technologies)
- 12.1.13.1. Company Overview
- 12.1.13.2. Products
- 12.1.13.3. Company Financials
- 12.1.13.4. SWOT Analysis
- 12.1.1 Kemira Oyj
- 12.2. Market Entropy
- 12.2.1 Company's Key Areas Served
- 12.2.2 Recent Developments
- 12.3. Company Market Share Analysis 2025
- 12.3.1 Top 5 Companies Market Share Analysis
- 12.3.2 Top 3 Companies Market Share Analysis
- 12.4. List of Potential Customers
- 13. Research Methodology
List of Figures
- Figure 1: Global Water Treatment Chemicals Market in Australia Revenue Breakdown (Million, %) by Region 2025 & 2033
- Figure 2: Global Water Treatment Chemicals Market in Australia Volume Breakdown (K Tons, %) by Region 2025 & 2033
- Figure 3: North America Water Treatment Chemicals Market in Australia Revenue (Million), by Product Type 2025 & 2033
- Figure 4: North America Water Treatment Chemicals Market in Australia Volume (K Tons), by Product Type 2025 & 2033
- Figure 5: North America Water Treatment Chemicals Market in Australia Revenue Share (%), by Product Type 2025 & 2033
- Figure 6: North America Water Treatment Chemicals Market in Australia Volume Share (%), by Product Type 2025 & 2033
- Figure 7: North America Water Treatment Chemicals Market in Australia Revenue (Million), by End-user Industry 2025 & 2033
- Figure 8: North America Water Treatment Chemicals Market in Australia Volume (K Tons), by End-user Industry 2025 & 2033
- Figure 9: North America Water Treatment Chemicals Market in Australia Revenue Share (%), by End-user Industry 2025 & 2033
- Figure 10: North America Water Treatment Chemicals Market in Australia Volume Share (%), by End-user Industry 2025 & 2033
- Figure 11: North America Water Treatment Chemicals Market in Australia Revenue (Million), by Country 2025 & 2033
- Figure 12: North America Water Treatment Chemicals Market in Australia Volume (K Tons), by Country 2025 & 2033
- Figure 13: North America Water Treatment Chemicals Market in Australia Revenue Share (%), by Country 2025 & 2033
- Figure 14: North America Water Treatment Chemicals Market in Australia Volume Share (%), by Country 2025 & 2033
- Figure 15: South America Water Treatment Chemicals Market in Australia Revenue (Million), by Product Type 2025 & 2033
- Figure 16: South America Water Treatment Chemicals Market in Australia Volume (K Tons), by Product Type 2025 & 2033
- Figure 17: South America Water Treatment Chemicals Market in Australia Revenue Share (%), by Product Type 2025 & 2033
- Figure 18: South America Water Treatment Chemicals Market in Australia Volume Share (%), by Product Type 2025 & 2033
- Figure 19: South America Water Treatment Chemicals Market in Australia Revenue (Million), by End-user Industry 2025 & 2033
- Figure 20: South America Water Treatment Chemicals Market in Australia Volume (K Tons), by End-user Industry 2025 & 2033
- Figure 21: South America Water Treatment Chemicals Market in Australia Revenue Share (%), by End-user Industry 2025 & 2033
- Figure 22: South America Water Treatment Chemicals Market in Australia Volume Share (%), by End-user Industry 2025 & 2033
- Figure 23: South America Water Treatment Chemicals Market in Australia Revenue (Million), by Country 2025 & 2033
- Figure 24: South America Water Treatment Chemicals Market in Australia Volume (K Tons), by Country 2025 & 2033
- Figure 25: South America Water Treatment Chemicals Market in Australia Revenue Share (%), by Country 2025 & 2033
- Figure 26: South America Water Treatment Chemicals Market in Australia Volume Share (%), by Country 2025 & 2033
- Figure 27: Europe Water Treatment Chemicals Market in Australia Revenue (Million), by Product Type 2025 & 2033
- Figure 28: Europe Water Treatment Chemicals Market in Australia Volume (K Tons), by Product Type 2025 & 2033
- Figure 29: Europe Water Treatment Chemicals Market in Australia Revenue Share (%), by Product Type 2025 & 2033
- Figure 30: Europe Water Treatment Chemicals Market in Australia Volume Share (%), by Product Type 2025 & 2033
- Figure 31: Europe Water Treatment Chemicals Market in Australia Revenue (Million), by End-user Industry 2025 & 2033
- Figure 32: Europe Water Treatment Chemicals Market in Australia Volume (K Tons), by End-user Industry 2025 & 2033
- Figure 33: Europe Water Treatment Chemicals Market in Australia Revenue Share (%), by End-user Industry 2025 & 2033
- Figure 34: Europe Water Treatment Chemicals Market in Australia Volume Share (%), by End-user Industry 2025 & 2033
- Figure 35: Europe Water Treatment Chemicals Market in Australia Revenue (Million), by Country 2025 & 2033
- Figure 36: Europe Water Treatment Chemicals Market in Australia Volume (K Tons), by Country 2025 & 2033
- Figure 37: Europe Water Treatment Chemicals Market in Australia Revenue Share (%), by Country 2025 & 2033
- Figure 38: Europe Water Treatment Chemicals Market in Australia Volume Share (%), by Country 2025 & 2033
- Figure 39: Middle East & Africa Water Treatment Chemicals Market in Australia Revenue (Million), by Product Type 2025 & 2033
- Figure 40: Middle East & Africa Water Treatment Chemicals Market in Australia Volume (K Tons), by Product Type 2025 & 2033
- Figure 41: Middle East & Africa Water Treatment Chemicals Market in Australia Revenue Share (%), by Product Type 2025 & 2033
- Figure 42: Middle East & Africa Water Treatment Chemicals Market in Australia Volume Share (%), by Product Type 2025 & 2033
- Figure 43: Middle East & Africa Water Treatment Chemicals Market in Australia Revenue (Million), by End-user Industry 2025 & 2033
- Figure 44: Middle East & Africa Water Treatment Chemicals Market in Australia Volume (K Tons), by End-user Industry 2025 & 2033
- Figure 45: Middle East & Africa Water Treatment Chemicals Market in Australia Revenue Share (%), by End-user Industry 2025 & 2033
- Figure 46: Middle East & Africa Water Treatment Chemicals Market in Australia Volume Share (%), by End-user Industry 2025 & 2033
- Figure 47: Middle East & Africa Water Treatment Chemicals Market in Australia Revenue (Million), by Country 2025 & 2033
- Figure 48: Middle East & Africa Water Treatment Chemicals Market in Australia Volume (K Tons), by Country 2025 & 2033
- Figure 49: Middle East & Africa Water Treatment Chemicals Market in Australia Revenue Share (%), by Country 2025 & 2033
- Figure 50: Middle East & Africa Water Treatment Chemicals Market in Australia Volume Share (%), by Country 2025 & 2033
- Figure 51: Asia Pacific Water Treatment Chemicals Market in Australia Revenue (Million), by Product Type 2025 & 2033
- Figure 52: Asia Pacific Water Treatment Chemicals Market in Australia Volume (K Tons), by Product Type 2025 & 2033
- Figure 53: Asia Pacific Water Treatment Chemicals Market in Australia Revenue Share (%), by Product Type 2025 & 2033
- Figure 54: Asia Pacific Water Treatment Chemicals Market in Australia Volume Share (%), by Product Type 2025 & 2033
- Figure 55: Asia Pacific Water Treatment Chemicals Market in Australia Revenue (Million), by End-user Industry 2025 & 2033
- Figure 56: Asia Pacific Water Treatment Chemicals Market in Australia Volume (K Tons), by End-user Industry 2025 & 2033
- Figure 57: Asia Pacific Water Treatment Chemicals Market in Australia Revenue Share (%), by End-user Industry 2025 & 2033
- Figure 58: Asia Pacific Water Treatment Chemicals Market in Australia Volume Share (%), by End-user Industry 2025 & 2033
- Figure 59: Asia Pacific Water Treatment Chemicals Market in Australia Revenue (Million), by Country 2025 & 2033
- Figure 60: Asia Pacific Water Treatment Chemicals Market in Australia Volume (K Tons), by Country 2025 & 2033
- Figure 61: Asia Pacific Water Treatment Chemicals Market in Australia Revenue Share (%), by Country 2025 & 2033
- Figure 62: Asia Pacific Water Treatment Chemicals Market in Australia Volume Share (%), by Country 2025 & 2033
List of Tables
- Table 1: Global Water Treatment Chemicals Market in Australia Revenue Million Forecast, by Product Type 2020 & 2033
- Table 2: Global Water Treatment Chemicals Market in Australia Volume K Tons Forecast, by Product Type 2020 & 2033
- Table 3: Global Water Treatment Chemicals Market in Australia Revenue Million Forecast, by End-user Industry 2020 & 2033
- Table 4: Global Water Treatment Chemicals Market in Australia Volume K Tons Forecast, by End-user Industry 2020 & 2033
- Table 5: Global Water Treatment Chemicals Market in Australia Revenue Million Forecast, by Region 2020 & 2033
- Table 6: Global Water Treatment Chemicals Market in Australia Volume K Tons Forecast, by Region 2020 & 2033
- Table 7: Global Water Treatment Chemicals Market in Australia Revenue Million Forecast, by Product Type 2020 & 2033
- Table 8: Global Water Treatment Chemicals Market in Australia Volume K Tons Forecast, by Product Type 2020 & 2033
- Table 9: Global Water Treatment Chemicals Market in Australia Revenue Million Forecast, by End-user Industry 2020 & 2033
- Table 10: Global Water Treatment Chemicals Market in Australia Volume K Tons Forecast, by End-user Industry 2020 & 2033
- Table 11: Global Water Treatment Chemicals Market in Australia Revenue Million Forecast, by Country 2020 & 2033
- Table 12: Global Water Treatment Chemicals Market in Australia Volume K Tons Forecast, by Country 2020 & 2033
- Table 13: United States Water Treatment Chemicals Market in Australia Revenue (Million) Forecast, by Application 2020 & 2033
- Table 14: United States Water Treatment Chemicals Market in Australia Volume (K Tons) Forecast, by Application 2020 & 2033
- Table 15: Canada Water Treatment Chemicals Market in Australia Revenue (Million) Forecast, by Application 2020 & 2033
- Table 16: Canada Water Treatment Chemicals Market in Australia Volume (K Tons) Forecast, by Application 2020 & 2033
- Table 17: Mexico Water Treatment Chemicals Market in Australia Revenue (Million) Forecast, by Application 2020 & 2033
- Table 18: Mexico Water Treatment Chemicals Market in Australia Volume (K Tons) Forecast, by Application 2020 & 2033
- Table 19: Global Water Treatment Chemicals Market in Australia Revenue Million Forecast, by Product Type 2020 & 2033
- Table 20: Global Water Treatment Chemicals Market in Australia Volume K Tons Forecast, by Product Type 2020 & 2033
- Table 21: Global Water Treatment Chemicals Market in Australia Revenue Million Forecast, by End-user Industry 2020 & 2033
- Table 22: Global Water Treatment Chemicals Market in Australia Volume K Tons Forecast, by End-user Industry 2020 & 2033
- Table 23: Global Water Treatment Chemicals Market in Australia Revenue Million Forecast, by Country 2020 & 2033
- Table 24: Global Water Treatment Chemicals Market in Australia Volume K Tons Forecast, by Country 2020 & 2033
- Table 25: Brazil Water Treatment Chemicals Market in Australia Revenue (Million) Forecast, by Application 2020 & 2033
- Table 26: Brazil Water Treatment Chemicals Market in Australia Volume (K Tons) Forecast, by Application 2020 & 2033
- Table 27: Argentina Water Treatment Chemicals Market in Australia Revenue (Million) Forecast, by Application 2020 & 2033
- Table 28: Argentina Water Treatment Chemicals Market in Australia Volume (K Tons) Forecast, by Application 2020 & 2033
- Table 29: Rest of South America Water Treatment Chemicals Market in Australia Revenue (Million) Forecast, by Application 2020 & 2033
- Table 30: Rest of South America Water Treatment Chemicals Market in Australia Volume (K Tons) Forecast, by Application 2020 & 2033
- Table 31: Global Water Treatment Chemicals Market in Australia Revenue Million Forecast, by Product Type 2020 & 2033
- Table 32: Global Water Treatment Chemicals Market in Australia Volume K Tons Forecast, by Product Type 2020 & 2033
- Table 33: Global Water Treatment Chemicals Market in Australia Revenue Million Forecast, by End-user Industry 2020 & 2033
- Table 34: Global Water Treatment Chemicals Market in Australia Volume K Tons Forecast, by End-user Industry 2020 & 2033
- Table 35: Global Water Treatment Chemicals Market in Australia Revenue Million Forecast, by Country 2020 & 2033
- Table 36: Global Water Treatment Chemicals Market in Australia Volume K Tons Forecast, by Country 2020 & 2033
- Table 37: United Kingdom Water Treatment Chemicals Market in Australia Revenue (Million) Forecast, by Application 2020 & 2033
- Table 38: United Kingdom Water Treatment Chemicals Market in Australia Volume (K Tons) Forecast, by Application 2020 & 2033
- Table 39: Germany Water Treatment Chemicals Market in Australia Revenue (Million) Forecast, by Application 2020 & 2033
- Table 40: Germany Water Treatment Chemicals Market in Australia Volume (K Tons) Forecast, by Application 2020 & 2033
- Table 41: France Water Treatment Chemicals Market in Australia Revenue (Million) Forecast, by Application 2020 & 2033
- Table 42: France Water Treatment Chemicals Market in Australia Volume (K Tons) Forecast, by Application 2020 & 2033
- Table 43: Italy Water Treatment Chemicals Market in Australia Revenue (Million) Forecast, by Application 2020 & 2033
- Table 44: Italy Water Treatment Chemicals Market in Australia Volume (K Tons) Forecast, by Application 2020 & 2033
- Table 45: Spain Water Treatment Chemicals Market in Australia Revenue (Million) Forecast, by Application 2020 & 2033
- Table 46: Spain Water Treatment Chemicals Market in Australia Volume (K Tons) Forecast, by Application 2020 & 2033
- Table 47: Russia Water Treatment Chemicals Market in Australia Revenue (Million) Forecast, by Application 2020 & 2033
- Table 48: Russia Water Treatment Chemicals Market in Australia Volume (K Tons) Forecast, by Application 2020 & 2033
- Table 49: Benelux Water Treatment Chemicals Market in Australia Revenue (Million) Forecast, by Application 2020 & 2033
- Table 50: Benelux Water Treatment Chemicals Market in Australia Volume (K Tons) Forecast, by Application 2020 & 2033
- Table 51: Nordics Water Treatment Chemicals Market in Australia Revenue (Million) Forecast, by Application 2020 & 2033
- Table 52: Nordics Water Treatment Chemicals Market in Australia Volume (K Tons) Forecast, by Application 2020 & 2033
- Table 53: Rest of Europe Water Treatment Chemicals Market in Australia Revenue (Million) Forecast, by Application 2020 & 2033
- Table 54: Rest of Europe Water Treatment Chemicals Market in Australia Volume (K Tons) Forecast, by Application 2020 & 2033
- Table 55: Global Water Treatment Chemicals Market in Australia Revenue Million Forecast, by Product Type 2020 & 2033
- Table 56: Global Water Treatment Chemicals Market in Australia Volume K Tons Forecast, by Product Type 2020 & 2033
- Table 57: Global Water Treatment Chemicals Market in Australia Revenue Million Forecast, by End-user Industry 2020 & 2033
- Table 58: Global Water Treatment Chemicals Market in Australia Volume K Tons Forecast, by End-user Industry 2020 & 2033
- Table 59: Global Water Treatment Chemicals Market in Australia Revenue Million Forecast, by Country 2020 & 2033
- Table 60: Global Water Treatment Chemicals Market in Australia Volume K Tons Forecast, by Country 2020 & 2033
- Table 61: Turkey Water Treatment Chemicals Market in Australia Revenue (Million) Forecast, by Application 2020 & 2033
- Table 62: Turkey Water Treatment Chemicals Market in Australia Volume (K Tons) Forecast, by Application 2020 & 2033
- Table 63: Israel Water Treatment Chemicals Market in Australia Revenue (Million) Forecast, by Application 2020 & 2033
- Table 64: Israel Water Treatment Chemicals Market in Australia Volume (K Tons) Forecast, by Application 2020 & 2033
- Table 65: GCC Water Treatment Chemicals Market in Australia Revenue (Million) Forecast, by Application 2020 & 2033
- Table 66: GCC Water Treatment Chemicals Market in Australia Volume (K Tons) Forecast, by Application 2020 & 2033
- Table 67: North Africa Water Treatment Chemicals Market in Australia Revenue (Million) Forecast, by Application 2020 & 2033
- Table 68: North Africa Water Treatment Chemicals Market in Australia Volume (K Tons) Forecast, by Application 2020 & 2033
- Table 69: South Africa Water Treatment Chemicals Market in Australia Revenue (Million) Forecast, by Application 2020 & 2033
- Table 70: South Africa Water Treatment Chemicals Market in Australia Volume (K Tons) Forecast, by Application 2020 & 2033
- Table 71: Rest of Middle East & Africa Water Treatment Chemicals Market in Australia Revenue (Million) Forecast, by Application 2020 & 2033
- Table 72: Rest of Middle East & Africa Water Treatment Chemicals Market in Australia Volume (K Tons) Forecast, by Application 2020 & 2033
- Table 73: Global Water Treatment Chemicals Market in Australia Revenue Million Forecast, by Product Type 2020 & 2033
- Table 74: Global Water Treatment Chemicals Market in Australia Volume K Tons Forecast, by Product Type 2020 & 2033
- Table 75: Global Water Treatment Chemicals Market in Australia Revenue Million Forecast, by End-user Industry 2020 & 2033
- Table 76: Global Water Treatment Chemicals Market in Australia Volume K Tons Forecast, by End-user Industry 2020 & 2033
- Table 77: Global Water Treatment Chemicals Market in Australia Revenue Million Forecast, by Country 2020 & 2033
- Table 78: Global Water Treatment Chemicals Market in Australia Volume K Tons Forecast, by Country 2020 & 2033
- Table 79: China Water Treatment Chemicals Market in Australia Revenue (Million) Forecast, by Application 2020 & 2033
- Table 80: China Water Treatment Chemicals Market in Australia Volume (K Tons) Forecast, by Application 2020 & 2033
- Table 81: India Water Treatment Chemicals Market in Australia Revenue (Million) Forecast, by Application 2020 & 2033
- Table 82: India Water Treatment Chemicals Market in Australia Volume (K Tons) Forecast, by Application 2020 & 2033
- Table 83: Japan Water Treatment Chemicals Market in Australia Revenue (Million) Forecast, by Application 2020 & 2033
- Table 84: Japan Water Treatment Chemicals Market in Australia Volume (K Tons) Forecast, by Application 2020 & 2033
- Table 85: South Korea Water Treatment Chemicals Market in Australia Revenue (Million) Forecast, by Application 2020 & 2033
- Table 86: South Korea Water Treatment Chemicals Market in Australia Volume (K Tons) Forecast, by Application 2020 & 2033
- Table 87: ASEAN Water Treatment Chemicals Market in Australia Revenue (Million) Forecast, by Application 2020 & 2033
- Table 88: ASEAN Water Treatment Chemicals Market in Australia Volume (K Tons) Forecast, by Application 2020 & 2033
- Table 89: Oceania Water Treatment Chemicals Market in Australia Revenue (Million) Forecast, by Application 2020 & 2033
- Table 90: Oceania Water Treatment Chemicals Market in Australia Volume (K Tons) Forecast, by Application 2020 & 2033
- Table 91: Rest of Asia Pacific Water Treatment Chemicals Market in Australia Revenue (Million) Forecast, by Application 2020 & 2033
- Table 92: Rest of Asia Pacific Water Treatment Chemicals Market in Australia Volume (K Tons) Forecast, by Application 2020 & 2033
Frequently Asked Questions
1. What is the projected Compound Annual Growth Rate (CAGR) of the Water Treatment Chemicals Market in Australia?
The projected CAGR is approximately 3.17%.
2. Which companies are prominent players in the Water Treatment Chemicals Market in Australia?
Key companies in the market include Kemira Oyj, Coogee, Ecolab, SNF, IWTS Group Pty Ltd, Solvay, Buckman, Aquasol, Dow, Solenis, Ixom, Albemarle Corporation, Veolia (Veolia Water Technologies).
3. What are the main segments of the Water Treatment Chemicals Market in Australia?
The market segments include Product Type, End-user Industry.
4. Can you provide details about the market size?
The market size is estimated to be USD 467.75 Million as of 2022.
5. What are some drivers contributing to market growth?
Rising Groundwater and Surface Water Pollution; Growing Demand From Power and Industrial Applications; Increasing Government Intervention in Reliable Wastewater Management.
6. What are the notable trends driving market growth?
Municipal End-user Industry to Dominate the Market.
7. Are there any restraints impacting market growth?
Hazardous Nature of Hydrazine; Emerging Alternatives to Water Treatment Chemicals.
8. Can you provide examples of recent developments in the market?
In June 2022, Kemira Oyj announced a new collaboration with a France-based company, Veolia, to launch a new technology named ViviMag. This technology can recover phosphorus and other valuable resources, such as iron, from sewage sludge. Phosphorus causes the overfertilization of the surface waters if not removed properly, causing a major environmental problem. This new technology will help Kemira OYJ strengthen its position in the water treatment sector.
9. What pricing options are available for accessing the report?
Pricing options include single-user, multi-user, and enterprise licenses priced at USD 3,950, USD 4,950, and USD 6,950 respectively.
10. Is the market size provided in terms of value or volume?
The market size is provided in terms of value, measured in Million and volume, measured in K Tons.
11. Are there any specific market keywords associated with the report?
Yes, the market keyword associated with the report is "Water Treatment Chemicals Market in Australia," which aids in identifying and referencing the specific market segment covered.
12. How do I determine which pricing option suits my needs best?
The pricing options vary based on user requirements and access needs. Individual users may opt for single-user licenses, while businesses requiring broader access may choose multi-user or enterprise licenses for cost-effective access to the report.
13. Are there any additional resources or data provided in the Water Treatment Chemicals Market in Australia report?
While the report offers comprehensive insights, it's advisable to review the specific contents or supplementary materials provided to ascertain if additional resources or data are available.
14. How can I stay updated on further developments or reports in the Water Treatment Chemicals Market in Australia?
To stay informed about further developments, trends, and reports in the Water Treatment Chemicals Market in Australia, consider subscribing to industry newsletters, following relevant companies and organizations, or regularly checking reputable industry news sources and publications.
Methodology
Step 1 - Identification of Relevant Samples Size from Population Database


Step 2 - Approaches for Defining Global Market Size (Value, Volume* & Price*)

Note*: In applicable scenarios
Step 3 - Data Sources
Primary Research
- Web Analytics
- Survey Reports
- Research Institute
- Latest Research Reports
- Opinion Leaders
Secondary Research
- Annual Reports
- White Paper
- Latest Press Release
- Industry Association
- Paid Database
- Investor Presentations

Step 4 - Data Triangulation
Involves using different sources of information in order to increase the validity of a study
These sources are likely to be stakeholders in a program - participants, other researchers, program staff, other community members, and so on.
Then we put all data in single framework & apply various statistical tools to find out the dynamic on the market.
During the analysis stage, feedback from the stakeholder groups would be compared to determine areas of agreement as well as areas of divergence