

Key Insights
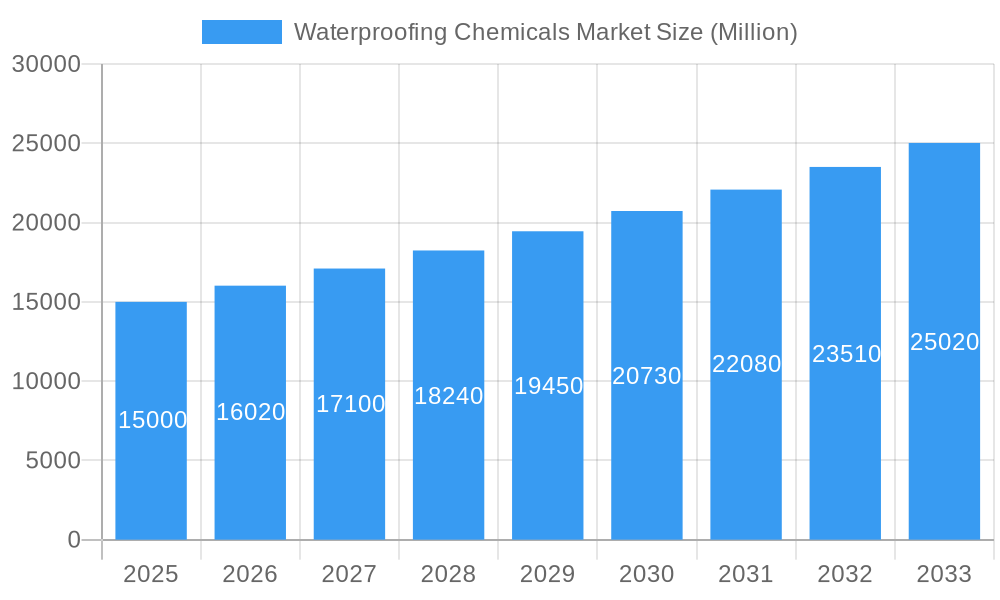
The global waterproofing chemicals market is poised for significant expansion, projecting a substantial market size driven by escalating infrastructure development, particularly in rapidly urbanizing Asia-Pacific and North America. With a projected Compound Annual Growth Rate (CAGR) of 9.2% from 2025 to 2033, the market demonstrates a strong upward trajectory. Key growth catalysts include increased construction activities, stringent building codes mandating water resistance, and a growing preference for sustainable and eco-friendly building materials. Advancements in epoxy-based, polyurethane-based, and water-based solutions are further propelling market growth, with water-based options gaining prominence for their environmental benefits and enhanced performance. The market is segmented by end-use (commercial, industrial & institutional, infrastructure, residential) and technology, highlighting diverse applications across various construction projects. Despite challenges such as raw material price volatility, the market outlook remains optimistic, fueled by sustained infrastructure investment and heightened awareness of building durability and longevity.
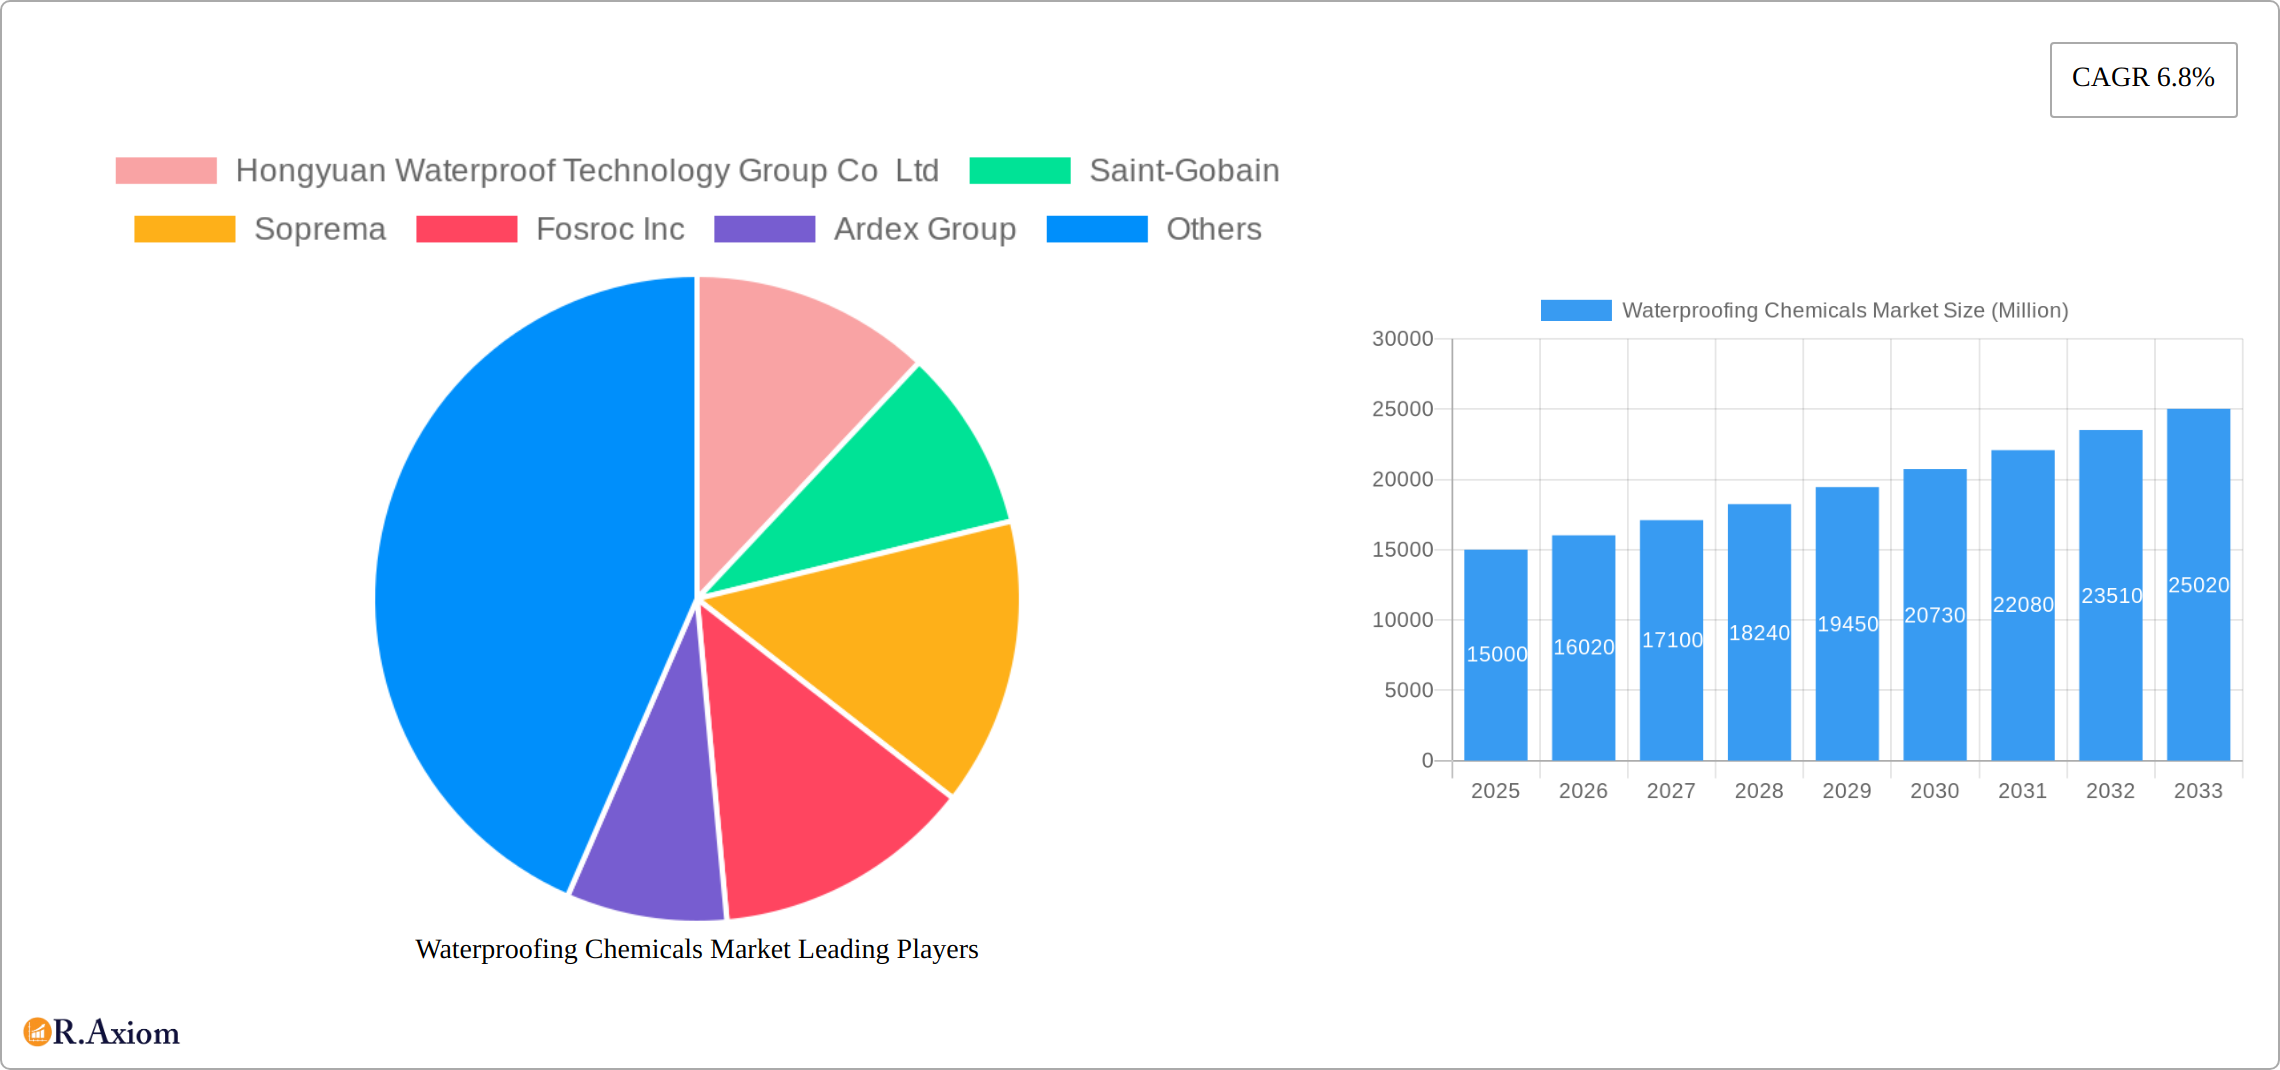
Waterproofing Chemicals Market Market Size (In Billion)
The competitive landscape features both international corporations and regional players. Future growth will be shaped by technological innovation, government initiatives promoting sustainable construction, and evolving regional infrastructure spending priorities. The focus will be on developing high-performance, cost-effective, and environmentally sound waterproofing solutions to meet the dynamic demands of the construction industry and address sustainability concerns.
Waterproofing Chemicals Market Company Market Share
This comprehensive report offers an in-depth analysis of the global Waterproofing Chemicals market, covering the period 2025-2033, with 2025 as the base year. The market is segmented by end-use sector (Commercial, Industrial and Institutional, Infrastructure, Residential) and technology (Epoxy-based, Polyurethane-based, Water-based, Other Technologies). The report projects a market size of 79.82 billion by 2033, driven by several key factors explored in detail.
Waterproofing Chemicals Market Concentration & Innovation
The Waterproofing Chemicals market exhibits a moderately concentrated landscape, with a few major players holding significant market share. However, the presence of several regional and specialized players indicates a dynamic competitive environment. Market share data for 2024 reveals that the top 5 players collectively hold approximately xx% of the market, indicating opportunities for both growth and consolidation. Innovation is a key driver, with companies focusing on developing sustainable, high-performance, and user-friendly waterproofing solutions. Regulatory frameworks, particularly those focused on environmental protection and building codes, significantly influence product development and adoption. The market witnesses continuous innovation in terms of novel chemistries, improved application methods, and enhanced durability. Product substitutes, such as membranes and coatings, pose competition, driving innovation towards improved cost-effectiveness and performance. End-user trends, such as the preference for sustainable and green building practices, are shaping product development and market demand.
Mergers and acquisitions (M&A) activities play a pivotal role in shaping the market landscape. Recent significant deals include:
- May 2022: Sika AG's acquisition of United Gilsonite Laboratories strengthened its US market position (Deal Value: xx Million).
- November 2022: MAPEI's investment in Sopro Bauchemie expanded its production and R&D capabilities (Investment Value: xx Million).
These M&A activities highlight the strategic importance of expanding product portfolios and geographical reach in this competitive market.
Waterproofing Chemicals Market Industry Trends & Insights
The global Waterproofing Chemicals market is experiencing robust growth, driven by several factors. The increasing focus on infrastructure development globally, particularly in emerging economies, is a key driver. The rising demand for sustainable and energy-efficient buildings further fuels market growth, as waterproofing is crucial for building longevity and energy efficiency. The construction industry's ongoing recovery from the pandemic, coupled with rising urbanization, contributes to increased demand. Technological advancements, such as the development of self-healing and smart waterproofing solutions, are transforming the market. The market is witnessing a shift towards eco-friendly, low-VOC (volatile organic compound) products in line with stricter environmental regulations. Competitive dynamics are intense, with companies focusing on product differentiation, cost optimization, and strategic partnerships to maintain their market position. The market is projected to grow at a CAGR of xx% during the forecast period (2025-2033), with market penetration steadily increasing in both developed and developing nations. Consumer preference for durable, long-lasting, and easy-to-apply solutions drives innovation.
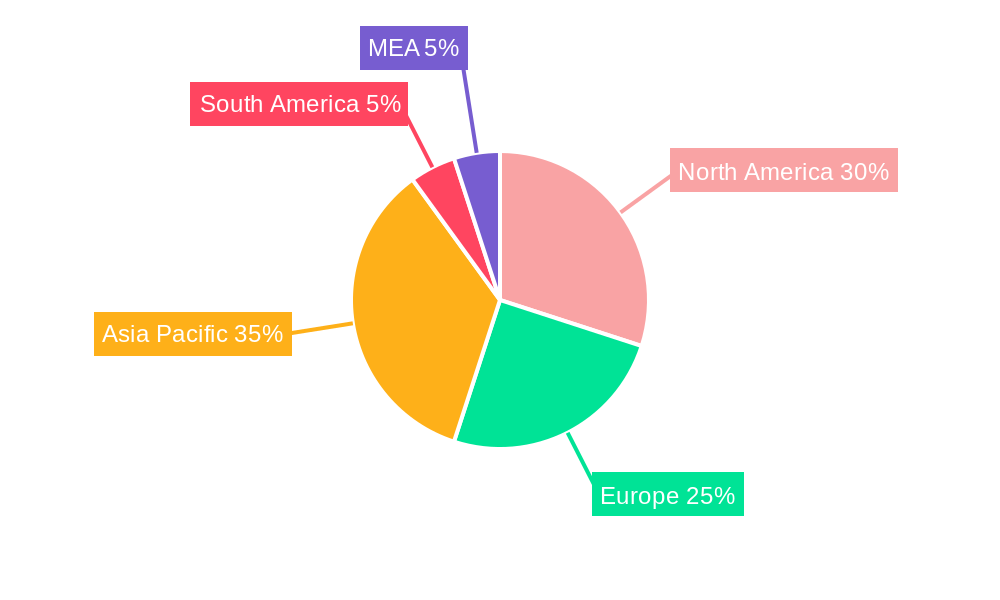
Dominant Markets & Segments in Waterproofing Chemicals Market
The global waterproofing chemicals market is experiencing robust growth, driven primarily by the Infrastructure segment. This sector's expansion is fueled by significant investments in large-scale projects across transportation, energy, and water management worldwide. Geographically, the Asia-Pacific region holds a leading position, attributable to its vigorous infrastructure development and rapid urbanization. However, growth is observed across all regions, reflecting a global need for effective waterproofing solutions in diverse construction applications.
Key Market Drivers:
- Unprecedented Infrastructure Development: Massive and sustained investments in global infrastructure projects are creating a consistently high demand for waterproofing chemicals.
- Accelerated Urbanization: The rapid pace of urbanization in developing and developed nations necessitates increased construction activity, significantly impacting the demand for waterproofing materials.
- Robust Economic Growth (with Regional Variations): Strong economic growth, while exhibiting regional disparities, broadly supports increased spending on construction and infrastructure projects, boosting the market.
- Government Initiatives & Policy Support: Governments worldwide are increasingly implementing supportive policies and initiatives promoting infrastructure development and sustainable construction practices, further stimulating market growth.
- Stringent Building Codes & Regulations: The implementation of stricter building codes and regulations emphasizing water resistance and durability is driving adoption of advanced waterproofing technologies.
Market Segmentation Analysis:
The Infrastructure segment is anticipated to maintain its dominant market share throughout the forecast period, propelled by the aforementioned factors. The Asia-Pacific region is projected to remain the leading geographical market due to its ongoing economic expansion and urbanization. Within the technology segment, Epoxy-based solutions hold a significant market share due to their superior durability and performance. However, Water-based alternatives are gaining considerable traction, driven by their environmentally friendly nature and growing demand for sustainable building materials. The Polyurethane-based segment also contributes significantly, offering unique properties suitable for specific applications. Furthermore, the market is witnessing the emergence of innovative hybrid technologies combining the advantages of different approaches.
Waterproofing Chemicals Market Product Developments
Recent advancements in waterproofing chemicals are characterized by a focus on improved performance, ease of application, and environmental sustainability. Manufacturers are developing self-healing, high-performance materials with enhanced UV resistance, crack-bridging capabilities, and improved longevity. The integration of nanotechnology and other advanced materials is enhancing product properties, leading to more durable and reliable solutions. These innovations address the market's demand for cost-effective and environmentally responsible waterproofing solutions tailored to specific application needs. The trend toward ready-to-use formulations continues to gain momentum, simplifying application processes and reducing labor costs.
Report Scope & Segmentation Analysis
End-Use Sector Segmentation: The market is segmented by end-use sector into Commercial, Industrial and Institutional, Infrastructure, and Residential. A detailed analysis assesses each segment's growth trajectory, considering factors such as construction activity, prevalent building codes, and consumer preferences. The Infrastructure segment is projected to exhibit the fastest growth due to substantial global investments in infrastructure projects. The Residential sector also displays significant potential due to rising housing demand.
Technology Segmentation: The market is segmented by technology into Epoxy-based, Polyurethane-based, Water-based, and Other Technologies (including hybrid solutions). The Epoxy-based segment maintains a substantial market share, renowned for its durability and performance. The Water-based segment is experiencing rapid growth due to its environmentally friendly profile and increasing regulatory pressures. Polyurethane-based solutions cater to specific application requirements where flexibility and elasticity are critical. A comprehensive analysis of each technology segment's market size, growth rate, and competitive landscape is provided.
Key Drivers of Waterproofing Chemicals Market Growth
The Waterproofing Chemicals market is propelled by factors such as:
- Rising Infrastructure Spending: Global investment in infrastructure projects drives significant demand.
- Urbanization and Construction Boom: Rapid urbanization in emerging economies fuels market expansion.
- Stringent Building Codes: Increased focus on energy efficiency and building longevity necessitates effective waterproofing.
- Technological Advancements: Innovations in materials science and application technologies contribute to higher performance and durability.
Challenges in the Waterproofing Chemicals Market Sector
Several challenges impede market growth:
- Fluctuating Raw Material Prices: Raw material price volatility impacts production costs and profitability.
- Environmental Regulations: Stricter environmental regulations necessitate the development of eco-friendly products.
- Competition: Intense competition among established players and new entrants impacts market dynamics.
- Supply Chain Disruptions: Global supply chain vulnerabilities can impact product availability and costs. These challenges are projected to cause a xx% decrease in growth for the market in 2026
Emerging Opportunities in Waterproofing Chemicals Market
Emerging opportunities lie in:
- Green Building Materials: Growing demand for sustainable and eco-friendly waterproofing solutions.
- Smart Waterproofing Technologies: Development of self-healing and sensor-integrated systems.
- Emerging Markets: Expansion into high-growth regions with significant infrastructure development.
- Specialized Applications: Development of tailored solutions for niche applications such as tunnels and bridges.
Leading Players in the Waterproofing Chemicals Market Market
- Hongyuan Waterproof Technology Group Co Ltd
- Saint-Gobain
- Soprema
- Fosroc Inc
- Ardex Group
- MAPEI S p A
- Sika AG
- Keshun Waterproof Technology Co ltd
- Standard Industries Inc
- Oriental Yuhong
Key Developments in Waterproofing Chemicals Market Industry
- January 2022: SOPREMA launched Alsan Flashing Neo, a next-generation primerless waterproofing chemical.
- May 2022: Sika AG acquired United Gilsonite Laboratories, expanding its US market presence.
- November 2022: MAPEI invested in Sopro Bauchemie to boost production and R&D.
Strategic Outlook for Waterproofing Chemicals Market Market
The Waterproofing Chemicals market is poised for continued growth, driven by sustained infrastructure development, urbanization, and technological advancements. The focus on sustainability and eco-friendly solutions will shape future market dynamics. Companies are expected to focus on innovation, strategic partnerships, and geographic expansion to maintain their competitiveness. The increasing adoption of smart building technologies presents significant growth opportunities. The market is expected to witness further consolidation through M&A activity, as larger players seek to expand their product portfolios and market share.
Waterproofing Chemicals Market Segmentation
-
1. End Use Sector
- 1.1. Commercial
- 1.2. Industrial and Institutional
- 1.3. Infrastructure
- 1.4. Residential
-
2. Technology
- 2.1. Epoxy-based
- 2.2. Polyurethane-based
- 2.3. Water-based
- 2.4. Other Technologies
Waterproofing Chemicals Market Segmentation By Geography
-
1. North America
- 1.1. United States
- 1.2. Canada
- 1.3. Mexico
-
2. South America
- 2.1. Brazil
- 2.2. Argentina
- 2.3. Rest of South America
-
3. Europe
- 3.1. United Kingdom
- 3.2. Germany
- 3.3. France
- 3.4. Italy
- 3.5. Spain
- 3.6. Russia
- 3.7. Benelux
- 3.8. Nordics
- 3.9. Rest of Europe
-
4. Middle East & Africa
- 4.1. Turkey
- 4.2. Israel
- 4.3. GCC
- 4.4. North Africa
- 4.5. South Africa
- 4.6. Rest of Middle East & Africa
-
5. Asia Pacific
- 5.1. China
- 5.2. India
- 5.3. Japan
- 5.4. South Korea
- 5.5. ASEAN
- 5.6. Oceania
- 5.7. Rest of Asia Pacific
Waterproofing Chemicals Market Regional Market Share
Geographic Coverage of Waterproofing Chemicals Market
Waterproofing Chemicals Market REPORT HIGHLIGHTS
| Aspects | Details |
|---|---|
| Study Period | 2020-2034 |
| Base Year | 2025 |
| Estimated Year | 2026 |
| Forecast Period | 2026-2034 |
| Historical Period | 2020-2025 |
| Growth Rate | CAGR of 9.88% from 2020-2034 |
| Segmentation |
|
Table of Contents
- 1. Introduction
- 1.1. Research Scope
- 1.2. Market Segmentation
- 1.3. Research Objective
- 1.4. Definitions and Assumptions
- 2. Executive Summary
- 2.1. Market Snapshot
- 3. Market Dynamics
- 3.1. Market Drivers
- 3.2. Market Restrains
- 3.3. Market Trends
- 3.4. Market Opportunities
- 4. Market Factor Analysis
- 4.1. Porters Five Forces
- 4.1.1. Bargaining Power of Suppliers
- 4.1.2. Bargaining Power of Buyers
- 4.1.3. Threat of New Entrants
- 4.1.4. Threat of Substitutes
- 4.1.5. Competitive Rivalry
- 4.2. PESTEL analysis
- 4.3. BCG Analysis
- 4.3.1. Stars (High Growth, High Market Share)
- 4.3.2. Cash Cows (Low Growth, High Market Share)
- 4.3.3. Question Mark (High Growth, Low Market Share)
- 4.3.4. Dogs (Low Growth, Low Market Share)
- 4.4. Ansoff Matrix Analysis
- 4.5. Supply Chain Analysis
- 4.6. Regulatory Landscape
- 4.7. Current Market Potential and Opportunity Assessment (TAM–SAM–SOM Framework)
- 4.8. RAX Analyst Note
- 4.1. Porters Five Forces
- 5. Market Analysis, Insights and Forecast 2021-2033
- 5.1. Market Analysis, Insights and Forecast - by End Use Sector
- 5.1.1. Commercial
- 5.1.2. Industrial and Institutional
- 5.1.3. Infrastructure
- 5.1.4. Residential
- 5.2. Market Analysis, Insights and Forecast - by Technology
- 5.2.1. Epoxy-based
- 5.2.2. Polyurethane-based
- 5.2.3. Water-based
- 5.2.4. Other Technologies
- 5.3. Market Analysis, Insights and Forecast - by Region
- 5.3.1. North America
- 5.3.2. South America
- 5.3.3. Europe
- 5.3.4. Middle East & Africa
- 5.3.5. Asia Pacific
- 5.1. Market Analysis, Insights and Forecast - by End Use Sector
- 6. Global Waterproofing Chemicals Market Analysis, Insights and Forecast, 2021-2033
- 6.1. Market Analysis, Insights and Forecast - by End Use Sector
- 6.1.1. Commercial
- 6.1.2. Industrial and Institutional
- 6.1.3. Infrastructure
- 6.1.4. Residential
- 6.2. Market Analysis, Insights and Forecast - by Technology
- 6.2.1. Epoxy-based
- 6.2.2. Polyurethane-based
- 6.2.3. Water-based
- 6.2.4. Other Technologies
- 6.1. Market Analysis, Insights and Forecast - by End Use Sector
- 7. North America Waterproofing Chemicals Market Analysis, Insights and Forecast, 2020-2032
- 7.1. Market Analysis, Insights and Forecast - by End Use Sector
- 7.1.1. Commercial
- 7.1.2. Industrial and Institutional
- 7.1.3. Infrastructure
- 7.1.4. Residential
- 7.2. Market Analysis, Insights and Forecast - by Technology
- 7.2.1. Epoxy-based
- 7.2.2. Polyurethane-based
- 7.2.3. Water-based
- 7.2.4. Other Technologies
- 7.1. Market Analysis, Insights and Forecast - by End Use Sector
- 8. South America Waterproofing Chemicals Market Analysis, Insights and Forecast, 2020-2032
- 8.1. Market Analysis, Insights and Forecast - by End Use Sector
- 8.1.1. Commercial
- 8.1.2. Industrial and Institutional
- 8.1.3. Infrastructure
- 8.1.4. Residential
- 8.2. Market Analysis, Insights and Forecast - by Technology
- 8.2.1. Epoxy-based
- 8.2.2. Polyurethane-based
- 8.2.3. Water-based
- 8.2.4. Other Technologies
- 8.1. Market Analysis, Insights and Forecast - by End Use Sector
- 9. Europe Waterproofing Chemicals Market Analysis, Insights and Forecast, 2020-2032
- 9.1. Market Analysis, Insights and Forecast - by End Use Sector
- 9.1.1. Commercial
- 9.1.2. Industrial and Institutional
- 9.1.3. Infrastructure
- 9.1.4. Residential
- 9.2. Market Analysis, Insights and Forecast - by Technology
- 9.2.1. Epoxy-based
- 9.2.2. Polyurethane-based
- 9.2.3. Water-based
- 9.2.4. Other Technologies
- 9.1. Market Analysis, Insights and Forecast - by End Use Sector
- 10. Middle East & Africa Waterproofing Chemicals Market Analysis, Insights and Forecast, 2020-2032
- 10.1. Market Analysis, Insights and Forecast - by End Use Sector
- 10.1.1. Commercial
- 10.1.2. Industrial and Institutional
- 10.1.3. Infrastructure
- 10.1.4. Residential
- 10.2. Market Analysis, Insights and Forecast - by Technology
- 10.2.1. Epoxy-based
- 10.2.2. Polyurethane-based
- 10.2.3. Water-based
- 10.2.4. Other Technologies
- 10.1. Market Analysis, Insights and Forecast - by End Use Sector
- 11. Asia Pacific Waterproofing Chemicals Market Analysis, Insights and Forecast, 2020-2032
- 11.1. Market Analysis, Insights and Forecast - by End Use Sector
- 11.1.1. Commercial
- 11.1.2. Industrial and Institutional
- 11.1.3. Infrastructure
- 11.1.4. Residential
- 11.2. Market Analysis, Insights and Forecast - by Technology
- 11.2.1. Epoxy-based
- 11.2.2. Polyurethane-based
- 11.2.3. Water-based
- 11.2.4. Other Technologies
- 11.1. Market Analysis, Insights and Forecast - by End Use Sector
- 12. Competitive Analysis
- 12.1. Company Profiles
- 12.1.1 Hongyuan Waterproof Technology Group Co Ltd
- 12.1.1.1. Company Overview
- 12.1.1.2. Products
- 12.1.1.3. Company Financials
- 12.1.1.4. SWOT Analysis
- 12.1.2 Saint-Gobain
- 12.1.2.1. Company Overview
- 12.1.2.2. Products
- 12.1.2.3. Company Financials
- 12.1.2.4. SWOT Analysis
- 12.1.3 Soprema
- 12.1.3.1. Company Overview
- 12.1.3.2. Products
- 12.1.3.3. Company Financials
- 12.1.3.4. SWOT Analysis
- 12.1.4 Fosroc Inc
- 12.1.4.1. Company Overview
- 12.1.4.2. Products
- 12.1.4.3. Company Financials
- 12.1.4.4. SWOT Analysis
- 12.1.5 Ardex Group
- 12.1.5.1. Company Overview
- 12.1.5.2. Products
- 12.1.5.3. Company Financials
- 12.1.5.4. SWOT Analysis
- 12.1.6 MAPEI S p A
- 12.1.6.1. Company Overview
- 12.1.6.2. Products
- 12.1.6.3. Company Financials
- 12.1.6.4. SWOT Analysis
- 12.1.7 Sika AG
- 12.1.7.1. Company Overview
- 12.1.7.2. Products
- 12.1.7.3. Company Financials
- 12.1.7.4. SWOT Analysis
- 12.1.8 Keshun Waterproof Technology Co ltd
- 12.1.8.1. Company Overview
- 12.1.8.2. Products
- 12.1.8.3. Company Financials
- 12.1.8.4. SWOT Analysis
- 12.1.9 Standard Industries Inc
- 12.1.9.1. Company Overview
- 12.1.9.2. Products
- 12.1.9.3. Company Financials
- 12.1.9.4. SWOT Analysis
- 12.1.10 Oriental Yuhong
- 12.1.10.1. Company Overview
- 12.1.10.2. Products
- 12.1.10.3. Company Financials
- 12.1.10.4. SWOT Analysis
- 12.1.1 Hongyuan Waterproof Technology Group Co Ltd
- 12.2. Market Entropy
- 12.2.1 Company's Key Areas Served
- 12.2.2 Recent Developments
- 12.3. Company Market Share Analysis 2025
- 12.3.1 Top 5 Companies Market Share Analysis
- 12.3.2 Top 3 Companies Market Share Analysis
- 12.4. List of Potential Customers
- 13. Research Methodology
List of Figures
- Figure 1: Global Waterproofing Chemicals Market Revenue Breakdown (billion, %) by Region 2025 & 2033
- Figure 2: Global Waterproofing Chemicals Market Volume Breakdown (K Tons, %) by Region 2025 & 2033
- Figure 3: North America Waterproofing Chemicals Market Revenue (billion), by End Use Sector 2025 & 2033
- Figure 4: North America Waterproofing Chemicals Market Volume (K Tons), by End Use Sector 2025 & 2033
- Figure 5: North America Waterproofing Chemicals Market Revenue Share (%), by End Use Sector 2025 & 2033
- Figure 6: North America Waterproofing Chemicals Market Volume Share (%), by End Use Sector 2025 & 2033
- Figure 7: North America Waterproofing Chemicals Market Revenue (billion), by Technology 2025 & 2033
- Figure 8: North America Waterproofing Chemicals Market Volume (K Tons), by Technology 2025 & 2033
- Figure 9: North America Waterproofing Chemicals Market Revenue Share (%), by Technology 2025 & 2033
- Figure 10: North America Waterproofing Chemicals Market Volume Share (%), by Technology 2025 & 2033
- Figure 11: North America Waterproofing Chemicals Market Revenue (billion), by Country 2025 & 2033
- Figure 12: North America Waterproofing Chemicals Market Volume (K Tons), by Country 2025 & 2033
- Figure 13: North America Waterproofing Chemicals Market Revenue Share (%), by Country 2025 & 2033
- Figure 14: North America Waterproofing Chemicals Market Volume Share (%), by Country 2025 & 2033
- Figure 15: South America Waterproofing Chemicals Market Revenue (billion), by End Use Sector 2025 & 2033
- Figure 16: South America Waterproofing Chemicals Market Volume (K Tons), by End Use Sector 2025 & 2033
- Figure 17: South America Waterproofing Chemicals Market Revenue Share (%), by End Use Sector 2025 & 2033
- Figure 18: South America Waterproofing Chemicals Market Volume Share (%), by End Use Sector 2025 & 2033
- Figure 19: South America Waterproofing Chemicals Market Revenue (billion), by Technology 2025 & 2033
- Figure 20: South America Waterproofing Chemicals Market Volume (K Tons), by Technology 2025 & 2033
- Figure 21: South America Waterproofing Chemicals Market Revenue Share (%), by Technology 2025 & 2033
- Figure 22: South America Waterproofing Chemicals Market Volume Share (%), by Technology 2025 & 2033
- Figure 23: South America Waterproofing Chemicals Market Revenue (billion), by Country 2025 & 2033
- Figure 24: South America Waterproofing Chemicals Market Volume (K Tons), by Country 2025 & 2033
- Figure 25: South America Waterproofing Chemicals Market Revenue Share (%), by Country 2025 & 2033
- Figure 26: South America Waterproofing Chemicals Market Volume Share (%), by Country 2025 & 2033
- Figure 27: Europe Waterproofing Chemicals Market Revenue (billion), by End Use Sector 2025 & 2033
- Figure 28: Europe Waterproofing Chemicals Market Volume (K Tons), by End Use Sector 2025 & 2033
- Figure 29: Europe Waterproofing Chemicals Market Revenue Share (%), by End Use Sector 2025 & 2033
- Figure 30: Europe Waterproofing Chemicals Market Volume Share (%), by End Use Sector 2025 & 2033
- Figure 31: Europe Waterproofing Chemicals Market Revenue (billion), by Technology 2025 & 2033
- Figure 32: Europe Waterproofing Chemicals Market Volume (K Tons), by Technology 2025 & 2033
- Figure 33: Europe Waterproofing Chemicals Market Revenue Share (%), by Technology 2025 & 2033
- Figure 34: Europe Waterproofing Chemicals Market Volume Share (%), by Technology 2025 & 2033
- Figure 35: Europe Waterproofing Chemicals Market Revenue (billion), by Country 2025 & 2033
- Figure 36: Europe Waterproofing Chemicals Market Volume (K Tons), by Country 2025 & 2033
- Figure 37: Europe Waterproofing Chemicals Market Revenue Share (%), by Country 2025 & 2033
- Figure 38: Europe Waterproofing Chemicals Market Volume Share (%), by Country 2025 & 2033
- Figure 39: Middle East & Africa Waterproofing Chemicals Market Revenue (billion), by End Use Sector 2025 & 2033
- Figure 40: Middle East & Africa Waterproofing Chemicals Market Volume (K Tons), by End Use Sector 2025 & 2033
- Figure 41: Middle East & Africa Waterproofing Chemicals Market Revenue Share (%), by End Use Sector 2025 & 2033
- Figure 42: Middle East & Africa Waterproofing Chemicals Market Volume Share (%), by End Use Sector 2025 & 2033
- Figure 43: Middle East & Africa Waterproofing Chemicals Market Revenue (billion), by Technology 2025 & 2033
- Figure 44: Middle East & Africa Waterproofing Chemicals Market Volume (K Tons), by Technology 2025 & 2033
- Figure 45: Middle East & Africa Waterproofing Chemicals Market Revenue Share (%), by Technology 2025 & 2033
- Figure 46: Middle East & Africa Waterproofing Chemicals Market Volume Share (%), by Technology 2025 & 2033
- Figure 47: Middle East & Africa Waterproofing Chemicals Market Revenue (billion), by Country 2025 & 2033
- Figure 48: Middle East & Africa Waterproofing Chemicals Market Volume (K Tons), by Country 2025 & 2033
- Figure 49: Middle East & Africa Waterproofing Chemicals Market Revenue Share (%), by Country 2025 & 2033
- Figure 50: Middle East & Africa Waterproofing Chemicals Market Volume Share (%), by Country 2025 & 2033
- Figure 51: Asia Pacific Waterproofing Chemicals Market Revenue (billion), by End Use Sector 2025 & 2033
- Figure 52: Asia Pacific Waterproofing Chemicals Market Volume (K Tons), by End Use Sector 2025 & 2033
- Figure 53: Asia Pacific Waterproofing Chemicals Market Revenue Share (%), by End Use Sector 2025 & 2033
- Figure 54: Asia Pacific Waterproofing Chemicals Market Volume Share (%), by End Use Sector 2025 & 2033
- Figure 55: Asia Pacific Waterproofing Chemicals Market Revenue (billion), by Technology 2025 & 2033
- Figure 56: Asia Pacific Waterproofing Chemicals Market Volume (K Tons), by Technology 2025 & 2033
- Figure 57: Asia Pacific Waterproofing Chemicals Market Revenue Share (%), by Technology 2025 & 2033
- Figure 58: Asia Pacific Waterproofing Chemicals Market Volume Share (%), by Technology 2025 & 2033
- Figure 59: Asia Pacific Waterproofing Chemicals Market Revenue (billion), by Country 2025 & 2033
- Figure 60: Asia Pacific Waterproofing Chemicals Market Volume (K Tons), by Country 2025 & 2033
- Figure 61: Asia Pacific Waterproofing Chemicals Market Revenue Share (%), by Country 2025 & 2033
- Figure 62: Asia Pacific Waterproofing Chemicals Market Volume Share (%), by Country 2025 & 2033
List of Tables
- Table 1: Global Waterproofing Chemicals Market Revenue billion Forecast, by End Use Sector 2020 & 2033
- Table 2: Global Waterproofing Chemicals Market Volume K Tons Forecast, by End Use Sector 2020 & 2033
- Table 3: Global Waterproofing Chemicals Market Revenue billion Forecast, by Technology 2020 & 2033
- Table 4: Global Waterproofing Chemicals Market Volume K Tons Forecast, by Technology 2020 & 2033
- Table 5: Global Waterproofing Chemicals Market Revenue billion Forecast, by Region 2020 & 2033
- Table 6: Global Waterproofing Chemicals Market Volume K Tons Forecast, by Region 2020 & 2033
- Table 7: Global Waterproofing Chemicals Market Revenue billion Forecast, by End Use Sector 2020 & 2033
- Table 8: Global Waterproofing Chemicals Market Volume K Tons Forecast, by End Use Sector 2020 & 2033
- Table 9: Global Waterproofing Chemicals Market Revenue billion Forecast, by Technology 2020 & 2033
- Table 10: Global Waterproofing Chemicals Market Volume K Tons Forecast, by Technology 2020 & 2033
- Table 11: Global Waterproofing Chemicals Market Revenue billion Forecast, by Country 2020 & 2033
- Table 12: Global Waterproofing Chemicals Market Volume K Tons Forecast, by Country 2020 & 2033
- Table 13: United States Waterproofing Chemicals Market Revenue (billion) Forecast, by Application 2020 & 2033
- Table 14: United States Waterproofing Chemicals Market Volume (K Tons) Forecast, by Application 2020 & 2033
- Table 15: Canada Waterproofing Chemicals Market Revenue (billion) Forecast, by Application 2020 & 2033
- Table 16: Canada Waterproofing Chemicals Market Volume (K Tons) Forecast, by Application 2020 & 2033
- Table 17: Mexico Waterproofing Chemicals Market Revenue (billion) Forecast, by Application 2020 & 2033
- Table 18: Mexico Waterproofing Chemicals Market Volume (K Tons) Forecast, by Application 2020 & 2033
- Table 19: Global Waterproofing Chemicals Market Revenue billion Forecast, by End Use Sector 2020 & 2033
- Table 20: Global Waterproofing Chemicals Market Volume K Tons Forecast, by End Use Sector 2020 & 2033
- Table 21: Global Waterproofing Chemicals Market Revenue billion Forecast, by Technology 2020 & 2033
- Table 22: Global Waterproofing Chemicals Market Volume K Tons Forecast, by Technology 2020 & 2033
- Table 23: Global Waterproofing Chemicals Market Revenue billion Forecast, by Country 2020 & 2033
- Table 24: Global Waterproofing Chemicals Market Volume K Tons Forecast, by Country 2020 & 2033
- Table 25: Brazil Waterproofing Chemicals Market Revenue (billion) Forecast, by Application 2020 & 2033
- Table 26: Brazil Waterproofing Chemicals Market Volume (K Tons) Forecast, by Application 2020 & 2033
- Table 27: Argentina Waterproofing Chemicals Market Revenue (billion) Forecast, by Application 2020 & 2033
- Table 28: Argentina Waterproofing Chemicals Market Volume (K Tons) Forecast, by Application 2020 & 2033
- Table 29: Rest of South America Waterproofing Chemicals Market Revenue (billion) Forecast, by Application 2020 & 2033
- Table 30: Rest of South America Waterproofing Chemicals Market Volume (K Tons) Forecast, by Application 2020 & 2033
- Table 31: Global Waterproofing Chemicals Market Revenue billion Forecast, by End Use Sector 2020 & 2033
- Table 32: Global Waterproofing Chemicals Market Volume K Tons Forecast, by End Use Sector 2020 & 2033
- Table 33: Global Waterproofing Chemicals Market Revenue billion Forecast, by Technology 2020 & 2033
- Table 34: Global Waterproofing Chemicals Market Volume K Tons Forecast, by Technology 2020 & 2033
- Table 35: Global Waterproofing Chemicals Market Revenue billion Forecast, by Country 2020 & 2033
- Table 36: Global Waterproofing Chemicals Market Volume K Tons Forecast, by Country 2020 & 2033
- Table 37: United Kingdom Waterproofing Chemicals Market Revenue (billion) Forecast, by Application 2020 & 2033
- Table 38: United Kingdom Waterproofing Chemicals Market Volume (K Tons) Forecast, by Application 2020 & 2033
- Table 39: Germany Waterproofing Chemicals Market Revenue (billion) Forecast, by Application 2020 & 2033
- Table 40: Germany Waterproofing Chemicals Market Volume (K Tons) Forecast, by Application 2020 & 2033
- Table 41: France Waterproofing Chemicals Market Revenue (billion) Forecast, by Application 2020 & 2033
- Table 42: France Waterproofing Chemicals Market Volume (K Tons) Forecast, by Application 2020 & 2033
- Table 43: Italy Waterproofing Chemicals Market Revenue (billion) Forecast, by Application 2020 & 2033
- Table 44: Italy Waterproofing Chemicals Market Volume (K Tons) Forecast, by Application 2020 & 2033
- Table 45: Spain Waterproofing Chemicals Market Revenue (billion) Forecast, by Application 2020 & 2033
- Table 46: Spain Waterproofing Chemicals Market Volume (K Tons) Forecast, by Application 2020 & 2033
- Table 47: Russia Waterproofing Chemicals Market Revenue (billion) Forecast, by Application 2020 & 2033
- Table 48: Russia Waterproofing Chemicals Market Volume (K Tons) Forecast, by Application 2020 & 2033
- Table 49: Benelux Waterproofing Chemicals Market Revenue (billion) Forecast, by Application 2020 & 2033
- Table 50: Benelux Waterproofing Chemicals Market Volume (K Tons) Forecast, by Application 2020 & 2033
- Table 51: Nordics Waterproofing Chemicals Market Revenue (billion) Forecast, by Application 2020 & 2033
- Table 52: Nordics Waterproofing Chemicals Market Volume (K Tons) Forecast, by Application 2020 & 2033
- Table 53: Rest of Europe Waterproofing Chemicals Market Revenue (billion) Forecast, by Application 2020 & 2033
- Table 54: Rest of Europe Waterproofing Chemicals Market Volume (K Tons) Forecast, by Application 2020 & 2033
- Table 55: Global Waterproofing Chemicals Market Revenue billion Forecast, by End Use Sector 2020 & 2033
- Table 56: Global Waterproofing Chemicals Market Volume K Tons Forecast, by End Use Sector 2020 & 2033
- Table 57: Global Waterproofing Chemicals Market Revenue billion Forecast, by Technology 2020 & 2033
- Table 58: Global Waterproofing Chemicals Market Volume K Tons Forecast, by Technology 2020 & 2033
- Table 59: Global Waterproofing Chemicals Market Revenue billion Forecast, by Country 2020 & 2033
- Table 60: Global Waterproofing Chemicals Market Volume K Tons Forecast, by Country 2020 & 2033
- Table 61: Turkey Waterproofing Chemicals Market Revenue (billion) Forecast, by Application 2020 & 2033
- Table 62: Turkey Waterproofing Chemicals Market Volume (K Tons) Forecast, by Application 2020 & 2033
- Table 63: Israel Waterproofing Chemicals Market Revenue (billion) Forecast, by Application 2020 & 2033
- Table 64: Israel Waterproofing Chemicals Market Volume (K Tons) Forecast, by Application 2020 & 2033
- Table 65: GCC Waterproofing Chemicals Market Revenue (billion) Forecast, by Application 2020 & 2033
- Table 66: GCC Waterproofing Chemicals Market Volume (K Tons) Forecast, by Application 2020 & 2033
- Table 67: North Africa Waterproofing Chemicals Market Revenue (billion) Forecast, by Application 2020 & 2033
- Table 68: North Africa Waterproofing Chemicals Market Volume (K Tons) Forecast, by Application 2020 & 2033
- Table 69: South Africa Waterproofing Chemicals Market Revenue (billion) Forecast, by Application 2020 & 2033
- Table 70: South Africa Waterproofing Chemicals Market Volume (K Tons) Forecast, by Application 2020 & 2033
- Table 71: Rest of Middle East & Africa Waterproofing Chemicals Market Revenue (billion) Forecast, by Application 2020 & 2033
- Table 72: Rest of Middle East & Africa Waterproofing Chemicals Market Volume (K Tons) Forecast, by Application 2020 & 2033
- Table 73: Global Waterproofing Chemicals Market Revenue billion Forecast, by End Use Sector 2020 & 2033
- Table 74: Global Waterproofing Chemicals Market Volume K Tons Forecast, by End Use Sector 2020 & 2033
- Table 75: Global Waterproofing Chemicals Market Revenue billion Forecast, by Technology 2020 & 2033
- Table 76: Global Waterproofing Chemicals Market Volume K Tons Forecast, by Technology 2020 & 2033
- Table 77: Global Waterproofing Chemicals Market Revenue billion Forecast, by Country 2020 & 2033
- Table 78: Global Waterproofing Chemicals Market Volume K Tons Forecast, by Country 2020 & 2033
- Table 79: China Waterproofing Chemicals Market Revenue (billion) Forecast, by Application 2020 & 2033
- Table 80: China Waterproofing Chemicals Market Volume (K Tons) Forecast, by Application 2020 & 2033
- Table 81: India Waterproofing Chemicals Market Revenue (billion) Forecast, by Application 2020 & 2033
- Table 82: India Waterproofing Chemicals Market Volume (K Tons) Forecast, by Application 2020 & 2033
- Table 83: Japan Waterproofing Chemicals Market Revenue (billion) Forecast, by Application 2020 & 2033
- Table 84: Japan Waterproofing Chemicals Market Volume (K Tons) Forecast, by Application 2020 & 2033
- Table 85: South Korea Waterproofing Chemicals Market Revenue (billion) Forecast, by Application 2020 & 2033
- Table 86: South Korea Waterproofing Chemicals Market Volume (K Tons) Forecast, by Application 2020 & 2033
- Table 87: ASEAN Waterproofing Chemicals Market Revenue (billion) Forecast, by Application 2020 & 2033
- Table 88: ASEAN Waterproofing Chemicals Market Volume (K Tons) Forecast, by Application 2020 & 2033
- Table 89: Oceania Waterproofing Chemicals Market Revenue (billion) Forecast, by Application 2020 & 2033
- Table 90: Oceania Waterproofing Chemicals Market Volume (K Tons) Forecast, by Application 2020 & 2033
- Table 91: Rest of Asia Pacific Waterproofing Chemicals Market Revenue (billion) Forecast, by Application 2020 & 2033
- Table 92: Rest of Asia Pacific Waterproofing Chemicals Market Volume (K Tons) Forecast, by Application 2020 & 2033
Frequently Asked Questions
1. What is the projected Compound Annual Growth Rate (CAGR) of the Waterproofing Chemicals Market?
The projected CAGR is approximately 9.88%.
2. Which companies are prominent players in the Waterproofing Chemicals Market?
Key companies in the market include Hongyuan Waterproof Technology Group Co Ltd, Saint-Gobain, Soprema, Fosroc Inc, Ardex Group, MAPEI S p A, Sika AG, Keshun Waterproof Technology Co ltd, Standard Industries Inc, Oriental Yuhong.
3. What are the main segments of the Waterproofing Chemicals Market?
The market segments include End Use Sector, Technology.
4. Can you provide details about the market size?
The market size is estimated to be USD 22.58 billion as of 2022.
5. What are some drivers contributing to market growth?
; Banning/ Limiting Use of Plastics used in packaging applications.
6. What are the notable trends driving market growth?
OTHER KEY INDUSTRY TRENDS COVERED IN THE REPORT.
7. Are there any restraints impacting market growth?
; Harmful Amines in Dyes; Paperless Green Initiatives.
8. Can you provide examples of recent developments in the market?
November 2022: MAPEI invested in its German subsidiary, Sopro Bauchemie, which manufactures concrete admixtures, anchors & grouts, dry-mix mortars, and waterproofing solutions, to expand its production capacity and upgrade its research and development facilities.May 2022: Sika AG recently completed its acquisition of United Gilsonite Laboratories, a company based in the United States. This move was aimed at bolstering Sika AG's range of waterproofing solutions within the US market.January 2022: SOPREMA has developed a next-generation waterproofing chemical called Alsan Flashing Neo, which can waterproof any substrate without a primer.
9. What pricing options are available for accessing the report?
Pricing options include single-user, multi-user, and enterprise licenses priced at USD 3800, USD 4500, and USD 5800 respectively.
10. Is the market size provided in terms of value or volume?
The market size is provided in terms of value, measured in billion and volume, measured in K Tons.
11. Are there any specific market keywords associated with the report?
Yes, the market keyword associated with the report is "Waterproofing Chemicals Market," which aids in identifying and referencing the specific market segment covered.
12. How do I determine which pricing option suits my needs best?
The pricing options vary based on user requirements and access needs. Individual users may opt for single-user licenses, while businesses requiring broader access may choose multi-user or enterprise licenses for cost-effective access to the report.
13. Are there any additional resources or data provided in the Waterproofing Chemicals Market report?
While the report offers comprehensive insights, it's advisable to review the specific contents or supplementary materials provided to ascertain if additional resources or data are available.
14. How can I stay updated on further developments or reports in the Waterproofing Chemicals Market?
To stay informed about further developments, trends, and reports in the Waterproofing Chemicals Market, consider subscribing to industry newsletters, following relevant companies and organizations, or regularly checking reputable industry news sources and publications.
Methodology
Step 1 - Identification of Relevant Samples Size from Population Database


Step 2 - Approaches for Defining Global Market Size (Value, Volume* & Price*)

Note*: In applicable scenarios
Step 3 - Data Sources
Primary Research
- Web Analytics
- Survey Reports
- Research Institute
- Latest Research Reports
- Opinion Leaders
Secondary Research
- Annual Reports
- White Paper
- Latest Press Release
- Industry Association
- Paid Database
- Investor Presentations

Step 4 - Data Triangulation
Involves using different sources of information in order to increase the validity of a study
These sources are likely to be stakeholders in a program - participants, other researchers, program staff, other community members, and so on.
Then we put all data in single framework & apply various statistical tools to find out the dynamic on the market.
During the analysis stage, feedback from the stakeholder groups would be compared to determine areas of agreement as well as areas of divergence