

Key Insights
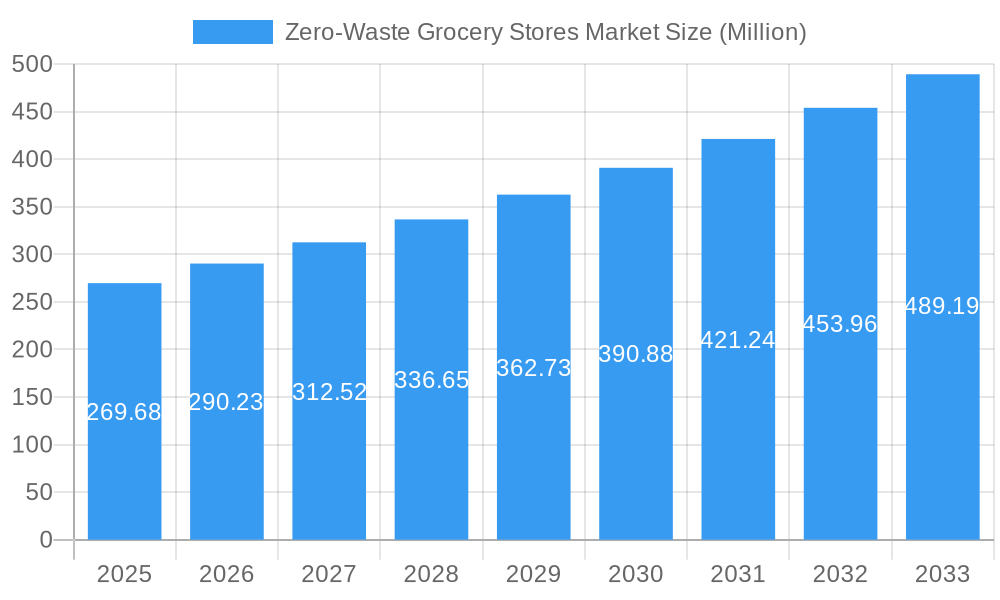
The zero-waste grocery store market is experiencing robust growth, projected to reach $269.68 million in 2025 and exhibiting a Compound Annual Growth Rate (CAGR) of 7.87% from 2025 to 2033. This expansion is fueled by several key drivers. Increasing consumer awareness of environmental sustainability and the desire to reduce plastic waste are significantly impacting purchasing decisions. A growing preference for locally sourced, organic, and unpackaged products further contributes to market growth. Furthermore, the rise of eco-conscious millennials and Gen Z, actively seeking sustainable lifestyle choices, is a crucial demographic driver. The market also benefits from innovative business models, such as refill stations and bulk purchasing options, offering cost-effective alternatives to traditional grocery shopping. While challenges remain, such as potential higher initial costs for consumers and the need for robust supply chain infrastructure to support zero-waste practices, these are being actively addressed by market participants through technological advancements and increased consumer education.
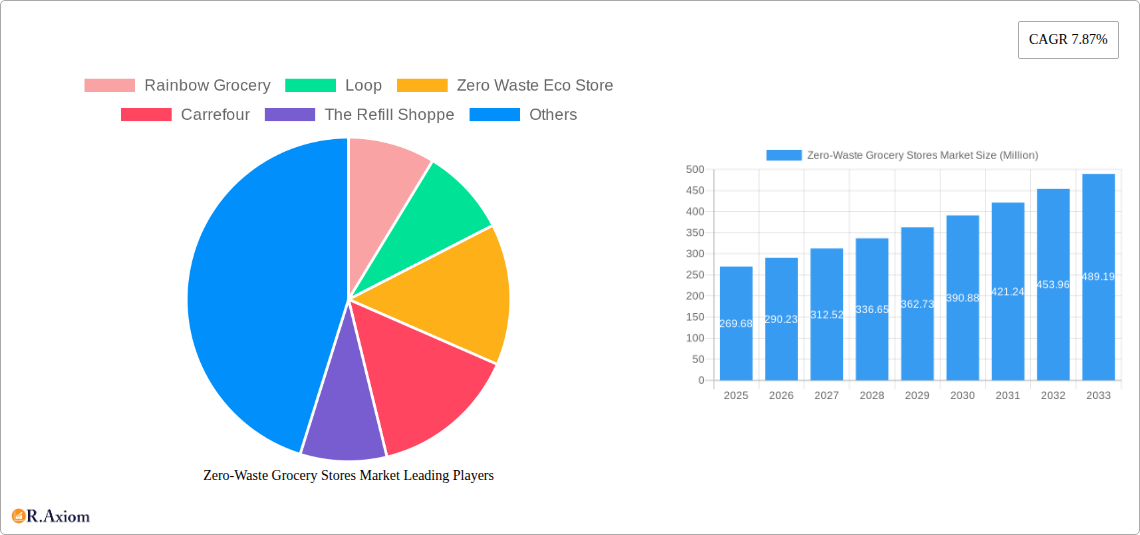
Zero-Waste Grocery Stores Market Market Size (In Million)
Competition in the zero-waste grocery store market is currently fragmented, with a mix of established players like Carrefour and Lidl alongside smaller, independent stores like Rainbow Grocery and The Refill Shoppe. The competitive landscape is characterized by a focus on differentiation through unique product offerings, community engagement, and strong branding. The market is expected to see further consolidation as larger retailers integrate zero-waste options into their existing business models, leading to increased competition and potentially driving innovation and affordability. Expansion into new geographical regions, particularly those with a strong environmental consciousness and a growing middle class, will also contribute to the overall market growth. The ongoing evolution of sustainable packaging solutions and advancements in waste management technologies are also key factors shaping the future trajectory of this dynamic market.
Zero-Waste Grocery Stores Market Company Market Share
Zero-Waste Grocery Stores Market: A Comprehensive Report (2019-2033)
This comprehensive report provides an in-depth analysis of the Zero-Waste Grocery Stores market, offering valuable insights for industry stakeholders, investors, and businesses seeking to capitalize on the burgeoning demand for sustainable and environmentally conscious grocery shopping experiences. The report covers the period 2019-2033, with a focus on the forecast period 2025-2033 and a base year of 2025. The market is expected to reach xx Million by 2033, exhibiting a CAGR of xx% during the forecast period.
Zero-Waste Grocery Stores Market Concentration & Innovation
The Zero-Waste Grocery Stores market is characterized by a fragmented landscape with a mix of large established players like Carrefour and Lidl, and smaller, specialized businesses such as Rainbow Grocery and The Refill Shoppe. Market concentration is relatively low, with no single dominant player controlling a significant share. However, the market is witnessing increasing consolidation through mergers and acquisitions (M&A), with deal values averaging xx Million in recent years. Innovation is a key driver, with companies focusing on enhancing the customer experience through technology integration (e.g., refill stations, online ordering with reusable containers), improved supply chain management, and the expansion of product offerings. Regulatory frameworks focusing on waste reduction and environmental sustainability are further driving innovation and market growth. The introduction of product substitutes, such as reusable packaging systems and alternative delivery models, presents both opportunities and challenges. End-user trends indicate a growing preference for sustainable practices, fueling demand for zero-waste grocery options.
- Market Share (2024): Carrefour (xx%), Lidl (xx%), Rainbow Grocery (xx%), Others (xx%)
- Average M&A Deal Value (2019-2024): xx Million
- Key Innovation Drivers: Technological advancements, regulatory pressures, consumer demand for sustainability.
Zero-Waste Grocery Stores Market Industry Trends & Insights
The Zero-Waste Grocery Stores market is experiencing significant growth, driven by increasing consumer awareness of environmental issues, a growing preference for sustainable products, and stricter government regulations on waste management. Technological disruptions, such as online ordering platforms with reusable packaging and smart inventory management systems, are streamlining operations and improving efficiency. Changing consumer preferences, with a focus on ethically sourced and locally produced goods, further contribute to market expansion. Competitive dynamics are intense, with companies competing on price, product differentiation, and brand reputation. The market penetration of zero-waste grocery stores is increasing steadily, particularly in urban areas with high concentrations of environmentally conscious consumers. The overall market growth is projected to continue at a healthy pace, driven by a combination of these factors, resulting in a compound annual growth rate (CAGR) of xx% during the forecast period.
Dominant Markets & Segments in Zero-Waste Grocery Stores Market
While data on specific geographic dominance is not yet fully available, the North American and European markets are currently considered to be the most developed segments for zero-waste grocery stores. These regions have a higher concentration of environmentally conscious consumers and supportive regulatory frameworks. Specific countries within these regions, like the USA, UK, Germany and France, have witnessed significant growth.
- Key Drivers in Dominant Markets:
- Strong consumer demand for sustainable products.
- Government incentives and regulations promoting waste reduction.
- Growing availability of infrastructure (e.g., collection points for reusable containers).
- Increased availability of locally produced food
Zero-Waste Grocery Stores Market Product Developments
Recent product developments in the zero-waste grocery sector focus heavily on optimizing packaging and delivery models. Innovative reusable container systems, integrated with online ordering platforms, minimize packaging waste while enhancing customer convenience. The emergence of refill stations for staples and household goods reduces single-use plastic consumption. Competition among providers focuses on creating a seamless and user-friendly experience, combined with a wide selection of products. Technological trends are geared toward efficiency and sustainability through smart inventory management and supply chain optimization.
Report Scope & Segmentation Analysis
This report segments the Zero-Waste Grocery Stores market based on several key parameters, including store type (independent, chain), product type (packaged goods, fresh produce, bulk), and region. The growth projections for each segment vary depending on specific market factors, and competitive dynamics are highly variable. Market sizes are currently under development.
Key Drivers of Zero-Waste Grocery Stores Market Growth
The Zero-Waste Grocery Stores market is experiencing significant growth due to a confluence of factors. Increasing consumer awareness of environmental issues and a growing preference for sustainable products are significant drivers. Stricter government regulations on waste management and incentives for sustainable practices are also contributing to market expansion. Technological advancements, such as online platforms for ordering and delivery using reusable containers, are further fueling growth.
Challenges in the Zero-Waste Grocery Stores Market Sector
Several challenges hinder the growth of the zero-waste grocery stores market. Supply chain complexities associated with managing reusable packaging and minimizing waste throughout the supply chain present significant logistical hurdles. Competition from traditional grocery stores offering comparable products at lower prices is a major constraint. Furthermore, regulatory hurdles related to food safety and waste disposal regulations can impact market expansion. The high initial investment needed for infrastructure like refill stations and reusable container systems poses a challenge for smaller businesses.
Emerging Opportunities in Zero-Waste Grocery Stores Market
Significant opportunities exist in expanding into new markets, particularly in developing economies where awareness of environmental issues is increasing. The development of innovative technologies, such as smart packaging and advanced waste management solutions, presents significant opportunities for growth. The rising demand for convenient, sustainable grocery solutions creates a niche for businesses focusing on delivering fresh produce and locally sourced products using efficient delivery models and reusable packaging.
Leading Players in the Zero-Waste Grocery Stores Market Market
- Rainbow Grocery
- Loop
- Zero Waste Eco Store
- Carrefour
- The Refill Shoppe
- Just Gaia
- Zero Muda
- EcoRefill
- ecoTopia
- Lidl
Key Developments in Zero-Waste Grocery Stores Market Industry
- July 2024: Carrefour partnered with GreenYellow to install solar panels at 350 hypermarkets and supermarkets in France, Spain, and Brazil, demonstrating a commitment to sustainability.
- November 2023: Carrefour formed a partnership with Czech Group JIP Retail, expanding its product reach significantly.
- January 2023: Good Earth Natural Foods partnered with USEFULL to reduce single-use packaging waste, introducing reusable cups in its cafes.
Strategic Outlook for Zero-Waste Grocery Stores Market Market
The Zero-Waste Grocery Stores market is poised for significant growth, driven by accelerating consumer demand, supportive government policies, and technological advancements. Opportunities abound for companies that can effectively manage supply chains, innovate with packaging solutions, and create convenient and affordable zero-waste shopping experiences. Continued market expansion is expected, with a focus on technology integration, sustainable packaging, and efficient delivery models.
Zero-Waste Grocery Stores Market Segmentation
-
1. Distribution Channel
- 1.1. Supermarkets/Hypermarkets
- 1.2. Speciality Stores
- 1.3. Online Stores
Zero-Waste Grocery Stores Market Segmentation By Geography
-
1. North America
- 1.1. United States
- 1.2. Canada
- 1.3. Rest of North America
-
2. Europe
- 2.1. United Kingdom
- 2.2. Germany
- 2.3. France
- 2.4. Russia
- 2.5. Italy
- 2.6. Spain
- 2.7. Rest of Europe
-
3. Asia Pacific
- 3.1. India
- 3.2. China
- 3.3. Japan
- 3.4. Australia
- 3.5. Rest of Asia Pacific
-
4. South America
- 4.1. Brazil
- 4.2. Argentina
- 4.3. Rest of South America
-
5. Middle East and Africa
- 5.1. United Arab Emirates
- 5.2. South Africa
- 5.3. Rest of Middle East and Africa

Zero-Waste Grocery Stores Market Regional Market Share
Geographic Coverage of Zero-Waste Grocery Stores Market
Zero-Waste Grocery Stores Market REPORT HIGHLIGHTS
| Aspects | Details |
|---|---|
| Study Period | 2020-2034 |
| Base Year | 2025 |
| Estimated Year | 2026 |
| Forecast Period | 2026-2034 |
| Historical Period | 2020-2025 |
| Growth Rate | CAGR of 7.87% from 2020-2034 |
| Segmentation |
|
Table of Contents
- 1. Introduction
- 1.1. Research Scope
- 1.2. Market Segmentation
- 1.3. Research Objective
- 1.4. Definitions and Assumptions
- 2. Executive Summary
- 2.1. Market Snapshot
- 3. Market Dynamics
- 3.1. Market Drivers
- 3.2. Market Restrains
- 3.3. Market Trends
- 3.4. Market Opportunities
- 4. Market Factor Analysis
- 4.1. Porters Five Forces
- 4.1.1. Bargaining Power of Suppliers
- 4.1.2. Bargaining Power of Buyers
- 4.1.3. Threat of New Entrants
- 4.1.4. Threat of Substitutes
- 4.1.5. Competitive Rivalry
- 4.2. PESTEL analysis
- 4.3. BCG Analysis
- 4.3.1. Stars (High Growth, High Market Share)
- 4.3.2. Cash Cows (Low Growth, High Market Share)
- 4.3.3. Question Mark (High Growth, Low Market Share)
- 4.3.4. Dogs (Low Growth, Low Market Share)
- 4.4. Ansoff Matrix Analysis
- 4.5. Supply Chain Analysis
- 4.6. Regulatory Landscape
- 4.7. Current Market Potential and Opportunity Assessment (TAM–SAM–SOM Framework)
- 4.8. RAX Analyst Note
- 4.1. Porters Five Forces
- 5. Market Analysis, Insights and Forecast 2021-2033
- 5.1. Market Analysis, Insights and Forecast - by Distribution Channel
- 5.1.1. Supermarkets/Hypermarkets
- 5.1.2. Speciality Stores
- 5.1.3. Online Stores
- 5.2. Market Analysis, Insights and Forecast - by Region
- 5.2.1. North America
- 5.2.2. Europe
- 5.2.3. Asia Pacific
- 5.2.4. South America
- 5.2.5. Middle East and Africa
- 5.1. Market Analysis, Insights and Forecast - by Distribution Channel
- 6. Global Zero-Waste Grocery Stores Market Analysis, Insights and Forecast, 2021-2033
- 6.1. Market Analysis, Insights and Forecast - by Distribution Channel
- 6.1.1. Supermarkets/Hypermarkets
- 6.1.2. Speciality Stores
- 6.1.3. Online Stores
- 6.1. Market Analysis, Insights and Forecast - by Distribution Channel
- 7. North America Zero-Waste Grocery Stores Market Analysis, Insights and Forecast, 2020-2032
- 7.1. Market Analysis, Insights and Forecast - by Distribution Channel
- 7.1.1. Supermarkets/Hypermarkets
- 7.1.2. Speciality Stores
- 7.1.3. Online Stores
- 7.1. Market Analysis, Insights and Forecast - by Distribution Channel
- 8. Europe Zero-Waste Grocery Stores Market Analysis, Insights and Forecast, 2020-2032
- 8.1. Market Analysis, Insights and Forecast - by Distribution Channel
- 8.1.1. Supermarkets/Hypermarkets
- 8.1.2. Speciality Stores
- 8.1.3. Online Stores
- 8.1. Market Analysis, Insights and Forecast - by Distribution Channel
- 9. Asia Pacific Zero-Waste Grocery Stores Market Analysis, Insights and Forecast, 2020-2032
- 9.1. Market Analysis, Insights and Forecast - by Distribution Channel
- 9.1.1. Supermarkets/Hypermarkets
- 9.1.2. Speciality Stores
- 9.1.3. Online Stores
- 9.1. Market Analysis, Insights and Forecast - by Distribution Channel
- 10. South America Zero-Waste Grocery Stores Market Analysis, Insights and Forecast, 2020-2032
- 10.1. Market Analysis, Insights and Forecast - by Distribution Channel
- 10.1.1. Supermarkets/Hypermarkets
- 10.1.2. Speciality Stores
- 10.1.3. Online Stores
- 10.1. Market Analysis, Insights and Forecast - by Distribution Channel
- 11. Middle East and Africa Zero-Waste Grocery Stores Market Analysis, Insights and Forecast, 2020-2032
- 11.1. Market Analysis, Insights and Forecast - by Distribution Channel
- 11.1.1. Supermarkets/Hypermarkets
- 11.1.2. Speciality Stores
- 11.1.3. Online Stores
- 11.1. Market Analysis, Insights and Forecast - by Distribution Channel
- 12. Competitive Analysis
- 12.1. Company Profiles
- 12.1.1 Rainbow Grocery
- 12.1.1.1. Company Overview
- 12.1.1.2. Products
- 12.1.1.3. Company Financials
- 12.1.1.4. SWOT Analysis
- 12.1.2 Loop
- 12.1.2.1. Company Overview
- 12.1.2.2. Products
- 12.1.2.3. Company Financials
- 12.1.2.4. SWOT Analysis
- 12.1.3 Zero Waste Eco Store
- 12.1.3.1. Company Overview
- 12.1.3.2. Products
- 12.1.3.3. Company Financials
- 12.1.3.4. SWOT Analysis
- 12.1.4 Carrefour
- 12.1.4.1. Company Overview
- 12.1.4.2. Products
- 12.1.4.3. Company Financials
- 12.1.4.4. SWOT Analysis
- 12.1.5 The Refill Shoppe
- 12.1.5.1. Company Overview
- 12.1.5.2. Products
- 12.1.5.3. Company Financials
- 12.1.5.4. SWOT Analysis
- 12.1.6 Just Gaia
- 12.1.6.1. Company Overview
- 12.1.6.2. Products
- 12.1.6.3. Company Financials
- 12.1.6.4. SWOT Analysis
- 12.1.7 Zero Muda
- 12.1.7.1. Company Overview
- 12.1.7.2. Products
- 12.1.7.3. Company Financials
- 12.1.7.4. SWOT Analysis
- 12.1.8 EcoRefill
- 12.1.8.1. Company Overview
- 12.1.8.2. Products
- 12.1.8.3. Company Financials
- 12.1.8.4. SWOT Analysis
- 12.1.9 ecoTopia
- 12.1.9.1. Company Overview
- 12.1.9.2. Products
- 12.1.9.3. Company Financials
- 12.1.9.4. SWOT Analysis
- 12.1.10 Lidl**List Not Exhaustive
- 12.1.10.1. Company Overview
- 12.1.10.2. Products
- 12.1.10.3. Company Financials
- 12.1.10.4. SWOT Analysis
- 12.1.1 Rainbow Grocery
- 12.2. Market Entropy
- 12.2.1 Company's Key Areas Served
- 12.2.2 Recent Developments
- 12.3. Company Market Share Analysis 2025
- 12.3.1 Top 5 Companies Market Share Analysis
- 12.3.2 Top 3 Companies Market Share Analysis
- 12.4. List of Potential Customers
- 13. Research Methodology
List of Figures
- Figure 1: Global Zero-Waste Grocery Stores Market Revenue Breakdown (Million, %) by Region 2025 & 2033
- Figure 2: Global Zero-Waste Grocery Stores Market Volume Breakdown (Billion, %) by Region 2025 & 2033
- Figure 3: North America Zero-Waste Grocery Stores Market Revenue (Million), by Distribution Channel 2025 & 2033
- Figure 4: North America Zero-Waste Grocery Stores Market Volume (Billion), by Distribution Channel 2025 & 2033
- Figure 5: North America Zero-Waste Grocery Stores Market Revenue Share (%), by Distribution Channel 2025 & 2033
- Figure 6: North America Zero-Waste Grocery Stores Market Volume Share (%), by Distribution Channel 2025 & 2033
- Figure 7: North America Zero-Waste Grocery Stores Market Revenue (Million), by Country 2025 & 2033
- Figure 8: North America Zero-Waste Grocery Stores Market Volume (Billion), by Country 2025 & 2033
- Figure 9: North America Zero-Waste Grocery Stores Market Revenue Share (%), by Country 2025 & 2033
- Figure 10: North America Zero-Waste Grocery Stores Market Volume Share (%), by Country 2025 & 2033
- Figure 11: Europe Zero-Waste Grocery Stores Market Revenue (Million), by Distribution Channel 2025 & 2033
- Figure 12: Europe Zero-Waste Grocery Stores Market Volume (Billion), by Distribution Channel 2025 & 2033
- Figure 13: Europe Zero-Waste Grocery Stores Market Revenue Share (%), by Distribution Channel 2025 & 2033
- Figure 14: Europe Zero-Waste Grocery Stores Market Volume Share (%), by Distribution Channel 2025 & 2033
- Figure 15: Europe Zero-Waste Grocery Stores Market Revenue (Million), by Country 2025 & 2033
- Figure 16: Europe Zero-Waste Grocery Stores Market Volume (Billion), by Country 2025 & 2033
- Figure 17: Europe Zero-Waste Grocery Stores Market Revenue Share (%), by Country 2025 & 2033
- Figure 18: Europe Zero-Waste Grocery Stores Market Volume Share (%), by Country 2025 & 2033
- Figure 19: Asia Pacific Zero-Waste Grocery Stores Market Revenue (Million), by Distribution Channel 2025 & 2033
- Figure 20: Asia Pacific Zero-Waste Grocery Stores Market Volume (Billion), by Distribution Channel 2025 & 2033
- Figure 21: Asia Pacific Zero-Waste Grocery Stores Market Revenue Share (%), by Distribution Channel 2025 & 2033
- Figure 22: Asia Pacific Zero-Waste Grocery Stores Market Volume Share (%), by Distribution Channel 2025 & 2033
- Figure 23: Asia Pacific Zero-Waste Grocery Stores Market Revenue (Million), by Country 2025 & 2033
- Figure 24: Asia Pacific Zero-Waste Grocery Stores Market Volume (Billion), by Country 2025 & 2033
- Figure 25: Asia Pacific Zero-Waste Grocery Stores Market Revenue Share (%), by Country 2025 & 2033
- Figure 26: Asia Pacific Zero-Waste Grocery Stores Market Volume Share (%), by Country 2025 & 2033
- Figure 27: South America Zero-Waste Grocery Stores Market Revenue (Million), by Distribution Channel 2025 & 2033
- Figure 28: South America Zero-Waste Grocery Stores Market Volume (Billion), by Distribution Channel 2025 & 2033
- Figure 29: South America Zero-Waste Grocery Stores Market Revenue Share (%), by Distribution Channel 2025 & 2033
- Figure 30: South America Zero-Waste Grocery Stores Market Volume Share (%), by Distribution Channel 2025 & 2033
- Figure 31: South America Zero-Waste Grocery Stores Market Revenue (Million), by Country 2025 & 2033
- Figure 32: South America Zero-Waste Grocery Stores Market Volume (Billion), by Country 2025 & 2033
- Figure 33: South America Zero-Waste Grocery Stores Market Revenue Share (%), by Country 2025 & 2033
- Figure 34: South America Zero-Waste Grocery Stores Market Volume Share (%), by Country 2025 & 2033
- Figure 35: Middle East and Africa Zero-Waste Grocery Stores Market Revenue (Million), by Distribution Channel 2025 & 2033
- Figure 36: Middle East and Africa Zero-Waste Grocery Stores Market Volume (Billion), by Distribution Channel 2025 & 2033
- Figure 37: Middle East and Africa Zero-Waste Grocery Stores Market Revenue Share (%), by Distribution Channel 2025 & 2033
- Figure 38: Middle East and Africa Zero-Waste Grocery Stores Market Volume Share (%), by Distribution Channel 2025 & 2033
- Figure 39: Middle East and Africa Zero-Waste Grocery Stores Market Revenue (Million), by Country 2025 & 2033
- Figure 40: Middle East and Africa Zero-Waste Grocery Stores Market Volume (Billion), by Country 2025 & 2033
- Figure 41: Middle East and Africa Zero-Waste Grocery Stores Market Revenue Share (%), by Country 2025 & 2033
- Figure 42: Middle East and Africa Zero-Waste Grocery Stores Market Volume Share (%), by Country 2025 & 2033
List of Tables
- Table 1: Global Zero-Waste Grocery Stores Market Revenue Million Forecast, by Distribution Channel 2020 & 2033
- Table 2: Global Zero-Waste Grocery Stores Market Volume Billion Forecast, by Distribution Channel 2020 & 2033
- Table 3: Global Zero-Waste Grocery Stores Market Revenue Million Forecast, by Region 2020 & 2033
- Table 4: Global Zero-Waste Grocery Stores Market Volume Billion Forecast, by Region 2020 & 2033
- Table 5: Global Zero-Waste Grocery Stores Market Revenue Million Forecast, by Distribution Channel 2020 & 2033
- Table 6: Global Zero-Waste Grocery Stores Market Volume Billion Forecast, by Distribution Channel 2020 & 2033
- Table 7: Global Zero-Waste Grocery Stores Market Revenue Million Forecast, by Country 2020 & 2033
- Table 8: Global Zero-Waste Grocery Stores Market Volume Billion Forecast, by Country 2020 & 2033
- Table 9: United States Zero-Waste Grocery Stores Market Revenue (Million) Forecast, by Application 2020 & 2033
- Table 10: United States Zero-Waste Grocery Stores Market Volume (Billion) Forecast, by Application 2020 & 2033
- Table 11: Canada Zero-Waste Grocery Stores Market Revenue (Million) Forecast, by Application 2020 & 2033
- Table 12: Canada Zero-Waste Grocery Stores Market Volume (Billion) Forecast, by Application 2020 & 2033
- Table 13: Rest of North America Zero-Waste Grocery Stores Market Revenue (Million) Forecast, by Application 2020 & 2033
- Table 14: Rest of North America Zero-Waste Grocery Stores Market Volume (Billion) Forecast, by Application 2020 & 2033
- Table 15: Global Zero-Waste Grocery Stores Market Revenue Million Forecast, by Distribution Channel 2020 & 2033
- Table 16: Global Zero-Waste Grocery Stores Market Volume Billion Forecast, by Distribution Channel 2020 & 2033
- Table 17: Global Zero-Waste Grocery Stores Market Revenue Million Forecast, by Country 2020 & 2033
- Table 18: Global Zero-Waste Grocery Stores Market Volume Billion Forecast, by Country 2020 & 2033
- Table 19: United Kingdom Zero-Waste Grocery Stores Market Revenue (Million) Forecast, by Application 2020 & 2033
- Table 20: United Kingdom Zero-Waste Grocery Stores Market Volume (Billion) Forecast, by Application 2020 & 2033
- Table 21: Germany Zero-Waste Grocery Stores Market Revenue (Million) Forecast, by Application 2020 & 2033
- Table 22: Germany Zero-Waste Grocery Stores Market Volume (Billion) Forecast, by Application 2020 & 2033
- Table 23: France Zero-Waste Grocery Stores Market Revenue (Million) Forecast, by Application 2020 & 2033
- Table 24: France Zero-Waste Grocery Stores Market Volume (Billion) Forecast, by Application 2020 & 2033
- Table 25: Russia Zero-Waste Grocery Stores Market Revenue (Million) Forecast, by Application 2020 & 2033
- Table 26: Russia Zero-Waste Grocery Stores Market Volume (Billion) Forecast, by Application 2020 & 2033
- Table 27: Italy Zero-Waste Grocery Stores Market Revenue (Million) Forecast, by Application 2020 & 2033
- Table 28: Italy Zero-Waste Grocery Stores Market Volume (Billion) Forecast, by Application 2020 & 2033
- Table 29: Spain Zero-Waste Grocery Stores Market Revenue (Million) Forecast, by Application 2020 & 2033
- Table 30: Spain Zero-Waste Grocery Stores Market Volume (Billion) Forecast, by Application 2020 & 2033
- Table 31: Rest of Europe Zero-Waste Grocery Stores Market Revenue (Million) Forecast, by Application 2020 & 2033
- Table 32: Rest of Europe Zero-Waste Grocery Stores Market Volume (Billion) Forecast, by Application 2020 & 2033
- Table 33: Global Zero-Waste Grocery Stores Market Revenue Million Forecast, by Distribution Channel 2020 & 2033
- Table 34: Global Zero-Waste Grocery Stores Market Volume Billion Forecast, by Distribution Channel 2020 & 2033
- Table 35: Global Zero-Waste Grocery Stores Market Revenue Million Forecast, by Country 2020 & 2033
- Table 36: Global Zero-Waste Grocery Stores Market Volume Billion Forecast, by Country 2020 & 2033
- Table 37: India Zero-Waste Grocery Stores Market Revenue (Million) Forecast, by Application 2020 & 2033
- Table 38: India Zero-Waste Grocery Stores Market Volume (Billion) Forecast, by Application 2020 & 2033
- Table 39: China Zero-Waste Grocery Stores Market Revenue (Million) Forecast, by Application 2020 & 2033
- Table 40: China Zero-Waste Grocery Stores Market Volume (Billion) Forecast, by Application 2020 & 2033
- Table 41: Japan Zero-Waste Grocery Stores Market Revenue (Million) Forecast, by Application 2020 & 2033
- Table 42: Japan Zero-Waste Grocery Stores Market Volume (Billion) Forecast, by Application 2020 & 2033
- Table 43: Australia Zero-Waste Grocery Stores Market Revenue (Million) Forecast, by Application 2020 & 2033
- Table 44: Australia Zero-Waste Grocery Stores Market Volume (Billion) Forecast, by Application 2020 & 2033
- Table 45: Rest of Asia Pacific Zero-Waste Grocery Stores Market Revenue (Million) Forecast, by Application 2020 & 2033
- Table 46: Rest of Asia Pacific Zero-Waste Grocery Stores Market Volume (Billion) Forecast, by Application 2020 & 2033
- Table 47: Global Zero-Waste Grocery Stores Market Revenue Million Forecast, by Distribution Channel 2020 & 2033
- Table 48: Global Zero-Waste Grocery Stores Market Volume Billion Forecast, by Distribution Channel 2020 & 2033
- Table 49: Global Zero-Waste Grocery Stores Market Revenue Million Forecast, by Country 2020 & 2033
- Table 50: Global Zero-Waste Grocery Stores Market Volume Billion Forecast, by Country 2020 & 2033
- Table 51: Brazil Zero-Waste Grocery Stores Market Revenue (Million) Forecast, by Application 2020 & 2033
- Table 52: Brazil Zero-Waste Grocery Stores Market Volume (Billion) Forecast, by Application 2020 & 2033
- Table 53: Argentina Zero-Waste Grocery Stores Market Revenue (Million) Forecast, by Application 2020 & 2033
- Table 54: Argentina Zero-Waste Grocery Stores Market Volume (Billion) Forecast, by Application 2020 & 2033
- Table 55: Rest of South America Zero-Waste Grocery Stores Market Revenue (Million) Forecast, by Application 2020 & 2033
- Table 56: Rest of South America Zero-Waste Grocery Stores Market Volume (Billion) Forecast, by Application 2020 & 2033
- Table 57: Global Zero-Waste Grocery Stores Market Revenue Million Forecast, by Distribution Channel 2020 & 2033
- Table 58: Global Zero-Waste Grocery Stores Market Volume Billion Forecast, by Distribution Channel 2020 & 2033
- Table 59: Global Zero-Waste Grocery Stores Market Revenue Million Forecast, by Country 2020 & 2033
- Table 60: Global Zero-Waste Grocery Stores Market Volume Billion Forecast, by Country 2020 & 2033
- Table 61: United Arab Emirates Zero-Waste Grocery Stores Market Revenue (Million) Forecast, by Application 2020 & 2033
- Table 62: United Arab Emirates Zero-Waste Grocery Stores Market Volume (Billion) Forecast, by Application 2020 & 2033
- Table 63: South Africa Zero-Waste Grocery Stores Market Revenue (Million) Forecast, by Application 2020 & 2033
- Table 64: South Africa Zero-Waste Grocery Stores Market Volume (Billion) Forecast, by Application 2020 & 2033
- Table 65: Rest of Middle East and Africa Zero-Waste Grocery Stores Market Revenue (Million) Forecast, by Application 2020 & 2033
- Table 66: Rest of Middle East and Africa Zero-Waste Grocery Stores Market Volume (Billion) Forecast, by Application 2020 & 2033
Frequently Asked Questions
1. What is the projected Compound Annual Growth Rate (CAGR) of the Zero-Waste Grocery Stores Market?
The projected CAGR is approximately 7.87%.
2. Which companies are prominent players in the Zero-Waste Grocery Stores Market?
Key companies in the market include Rainbow Grocery, Loop, Zero Waste Eco Store, Carrefour, The Refill Shoppe, Just Gaia, Zero Muda, EcoRefill, ecoTopia, Lidl**List Not Exhaustive.
3. What are the main segments of the Zero-Waste Grocery Stores Market?
The market segments include Distribution Channel.
4. Can you provide details about the market size?
The market size is estimated to be USD 269.68 Million as of 2022.
5. What are some drivers contributing to market growth?
Rising Environmental Consciousness Driving the Market; Consumer Demand for Eco-friendly Options Fuels Growth of the Market.
6. What are the notable trends driving market growth?
Zero-Waste Grocery Stores Proliferate in Supermarkets and Hypermarkets. Propelling Growth.
7. Are there any restraints impacting market growth?
Rising Environmental Consciousness Driving the Market; Consumer Demand for Eco-friendly Options Fuels Growth of the Market.
8. Can you provide examples of recent developments in the market?
July 2024: Carrefour, a prominent supermarket chain, partnered with GreenYellow, a key player in France's energy transition, to install solar panels across its national store network. This joint effort focuses on installing photovoltaic units in the parking lots of 350 hypermarkets and supermarkets in France, Spain, and Brazil.November 2023: Carrefour into a new partnership with Czech Group JIP Retail. All stores of the chain’s network started selling a large range of Carrefour products.January 2023: Good Earth Natural Foods partnered with USEFULL to reduce single-use packaging waste. As part of its commitment to sustainability, Good Earth began offering USEFULL’s tech-enabled, insulated stainless steel cups in its in-store cafes.
9. What pricing options are available for accessing the report?
Pricing options include single-user, multi-user, and enterprise licenses priced at USD 4750, USD 5250, and USD 8750 respectively.
10. Is the market size provided in terms of value or volume?
The market size is provided in terms of value, measured in Million and volume, measured in Billion.
11. Are there any specific market keywords associated with the report?
Yes, the market keyword associated with the report is "Zero-Waste Grocery Stores Market," which aids in identifying and referencing the specific market segment covered.
12. How do I determine which pricing option suits my needs best?
The pricing options vary based on user requirements and access needs. Individual users may opt for single-user licenses, while businesses requiring broader access may choose multi-user or enterprise licenses for cost-effective access to the report.
13. Are there any additional resources or data provided in the Zero-Waste Grocery Stores Market report?
While the report offers comprehensive insights, it's advisable to review the specific contents or supplementary materials provided to ascertain if additional resources or data are available.
14. How can I stay updated on further developments or reports in the Zero-Waste Grocery Stores Market?
To stay informed about further developments, trends, and reports in the Zero-Waste Grocery Stores Market, consider subscribing to industry newsletters, following relevant companies and organizations, or regularly checking reputable industry news sources and publications.
Methodology
Step 1 - Identification of Relevant Samples Size from Population Database


Step 2 - Approaches for Defining Global Market Size (Value, Volume* & Price*)

Note*: In applicable scenarios
Step 3 - Data Sources
Primary Research
- Web Analytics
- Survey Reports
- Research Institute
- Latest Research Reports
- Opinion Leaders
Secondary Research
- Annual Reports
- White Paper
- Latest Press Release
- Industry Association
- Paid Database
- Investor Presentations

Step 4 - Data Triangulation
Involves using different sources of information in order to increase the validity of a study
These sources are likely to be stakeholders in a program - participants, other researchers, program staff, other community members, and so on.
Then we put all data in single framework & apply various statistical tools to find out the dynamic on the market.
During the analysis stage, feedback from the stakeholder groups would be compared to determine areas of agreement as well as areas of divergence