Key Insights
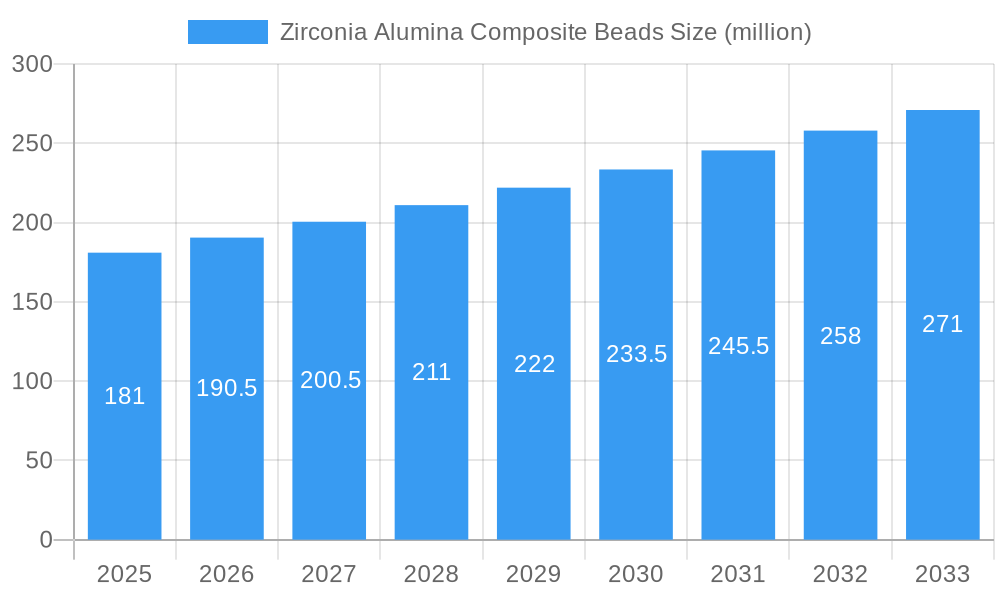
The global Zirconia Alumina Composite Beads market is experiencing robust growth, driven by the increasing demand for high-performance grinding and dispersion media across various industrial applications. Valued at an estimated $181 million in 2025, the market is projected to expand at a Compound Annual Growth Rate (CAGR) of 5.3% during the forecast period of 2025-2033. This growth is primarily fueled by the superior properties of these composite beads, such as exceptional hardness, wear resistance, and chemical inertness, making them ideal for demanding processes in ceramics, coatings, electronics, and pharmaceuticals. The growing sophistication of manufacturing techniques and the continuous need for finer particle sizes and improved product quality in these sectors are significant tailwinds for market expansion. Furthermore, technological advancements in bead manufacturing are leading to enhanced product performance and cost-effectiveness, further stimulating market adoption.
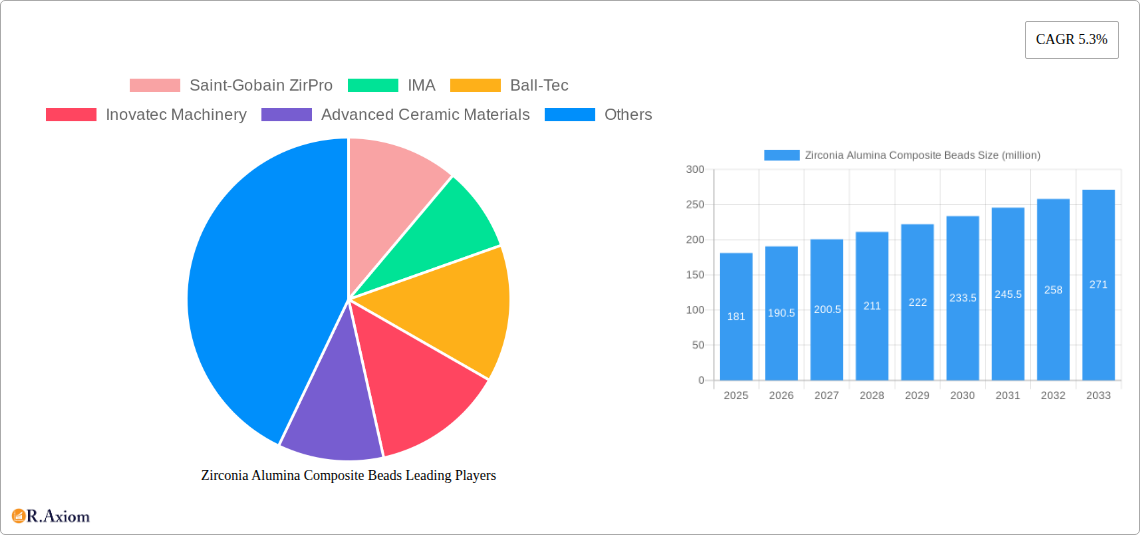
Zirconia Alumina Composite Beads Market Size (In Million)
The market is segmented by application, with Ceramics and Coatings emerging as dominant segments due to their extensive use of Zirconia Alumina Composite Beads for grinding pigments, glazes, and raw materials. The Electronics and Semiconductors sector also presents substantial growth opportunities, driven by the miniaturization trends and the need for ultra-fine particle processing in advanced electronic components. In terms of composition, beads with 50%-80% zirconia content are likely to witness the highest demand, offering the optimal balance of hardness and toughness for aggressive grinding applications. While the market benefits from strong growth drivers, potential restraints include the initial cost of high-performance composite beads compared to traditional grinding media and the availability of alternative materials. However, the long-term performance benefits and reduced processing times often outweigh the upfront investment, positioning the market for sustained positive momentum.
Zirconia Alumina Composite Beads Company Market Share
This comprehensive market research report provides an in-depth analysis of the global Zirconia Alumina Composite Beads market, offering critical insights for industry stakeholders. Covering the historical period from 2019 to 2024, the base year of 2025, and an extensive forecast period from 2025 to 2033, this report delves into market dynamics, key trends, dominant segments, and strategic outlooks. With a focus on high-traffic keywords such as "zirconia alumina beads," "composite grinding media," "high-performance ceramics," and "advanced milling solutions," this report aims to maximize search visibility and provide actionable intelligence for decision-makers.
Zirconia Alumina Composite Beads Market Concentration & Innovation
The Zirconia Alumina Composite Beads market exhibits a moderate level of concentration, with a few key players dominating a significant portion of the market share. Innovation is a primary driver, fueled by the demand for enhanced grinding efficiency, reduced wear, and improved product purity across various end-use industries. Companies are heavily investing in research and development to create composite beads with tailored properties, such as higher density, superior toughness, and exceptional chemical inertness. Regulatory frameworks, particularly concerning environmental impact and material safety, are increasingly influencing product development and manufacturing processes. Product substitutes, such as high-purity alumina beads and Yttria-stabilized zirconia beads, present competition, but the unique synergistic properties of zirconia-alumina composites often offer a distinct advantage. End-user trends lean towards miniaturization in electronics, increased demand for ultra-fine particles in pharmaceuticals, and more efficient processing in ceramics and coatings. Mergers and Acquisitions (M&A) activities are observed as companies seek to expand their product portfolios, gain access to new technologies, and consolidate market positions. Estimated M&A deal values are in the tens of millions of dollars.
- Market Concentration: Moderate, with key players holding significant market share.
- Innovation Drivers: Enhanced grinding efficiency, reduced wear, product purity, tailored material properties.
- Regulatory Frameworks: Focus on environmental impact and material safety.
- Product Substitutes: High-purity alumina beads, YSZ beads.
- End-User Trends: Miniaturization (Electronics), ultra-fine particles (Pharmaceuticals), efficient processing (Ceramics, Coatings).
- M&A Activities: Strategic acquisitions to expand portfolios and market access.
Zirconia Alumina Composite Beads Industry Trends & Insights
The Zirconia Alumina Composite Beads industry is poised for robust growth, driven by escalating demand across its diverse application spectrum. The CAGR for the forecast period is estimated at a healthy xx%. Key growth drivers include the increasing adoption of advanced milling technologies in the ceramics sector, where these beads facilitate the production of ultra-fine powders essential for high-performance ceramics used in automotive, aerospace, and industrial applications. In the coatings industry, zirconia alumina composite beads are crucial for achieving uniform dispersion of pigments and additives, leading to superior paint and ink quality. The electronics and semiconductor industry leverages these beads for precise grinding and polishing of sensitive materials, ensuring the integrity of microelectronic components. Furthermore, the pharmaceutical sector relies on these inert and wear-resistant grinding media for the micronization of active pharmaceutical ingredients (APIs), enhancing bioavailability and efficacy. Technological disruptions, such as advancements in sintering techniques and novel composite material formulations, are enabling the creation of beads with even higher performance characteristics. Consumer preferences are shifting towards products that offer greater sustainability and efficiency, which aligns well with the benefits provided by these advanced composite beads. Competitive dynamics are characterized by a blend of established players and emerging manufacturers, all striving to innovate and capture market share through product differentiation and cost-effectiveness. Market penetration of advanced composite beads is steadily increasing as industries recognize their superior performance over traditional grinding media.
Dominant Markets & Segments in Zirconia Alumina Composite Beads
The Zirconia Alumina Composite Beads market showcases distinct regional and application dominance, offering strategic insights for market players.
Leading Region/Country: Asia Pacific, particularly China, is a dominant region due to its substantial manufacturing base in ceramics, coatings, and electronics. The country's robust industrial infrastructure and supportive government policies for advanced materials contribute significantly to market growth. Significant investments in infrastructure development and a growing middle class further fuel demand across various applications.
Dominant Application Segment:
- Ceramics: This segment holds the largest market share. The demand for advanced ceramics in industries like automotive (catalytic converters, sensors), electronics (dielectric materials), and industrial (wear-resistant parts) drives the need for high-quality grinding media that can achieve finer particle sizes and higher purity.
- Key Drivers: Growing automotive production, demand for high-performance electronic components, increasing use of advanced ceramics in industrial machinery.
- Coatings: The coatings industry is another significant segment, utilizing these beads for efficient pigment dispersion in paints, inks, and protective coatings. The drive for enhanced durability, aesthetic appeal, and specialized functionalities in coatings fuels demand.
- Key Drivers: Growth in construction and infrastructure projects, increasing demand for high-quality printing inks, expansion of the automotive refinish market.
- Electronics and Semiconductors: This segment is experiencing rapid growth. The precision required in manufacturing semiconductors and electronic components necessitates highly uniform and wear-resistant grinding media for polishing and material processing.
- Key Drivers: Miniaturization of electronic devices, increasing demand for advanced semiconductors, growth of the 5G infrastructure and consumer electronics markets.
- Pharmaceuticals: While smaller in volume compared to ceramics and coatings, the pharmaceutical segment represents a high-value application. The need for inert, non-contaminating, and highly effective grinding media for API micronization to improve drug efficacy and bioavailability is a key driver.
- Key Drivers: Increasing global healthcare spending, rising demand for generic and novel drug formulations, stringent quality control requirements in pharmaceutical manufacturing.
Dominant Type Segment:
- 50% - 80% Zirconia Content: This category often represents the highest performance tier, offering superior density, hardness, and wear resistance. It caters to demanding applications requiring maximum efficiency and minimal contamination.
- Key Drivers: Need for ultra-fine grinding, demanding wear resistance in harsh environments, desire for optimal milling throughput.
- 30% - 50% Zirconia Content: This segment strikes a balance between performance and cost, making it suitable for a wider range of general-purpose grinding applications across various industries.
- Key Drivers: Cost-effectiveness for bulk grinding, versatile performance across diverse materials, broad applicability in industrial milling.
- 10% - 30% Zirconia Content: These beads offer good performance at a more economical price point, serving applications where extreme grinding efficiency is not paramount.
- Key Drivers: Cost-sensitive applications, general grinding needs, use in less demanding milling processes.
Zirconia Alumina Composite Beads Product Developments
Recent product developments in Zirconia Alumina Composite Beads focus on enhancing wear resistance, improving grinding efficiency, and reducing contamination. Innovations include advanced sintering processes that create denser, more homogeneous bead structures with finer grain sizes, leading to superior performance and longer lifespan. New formulations are being explored to offer tailored properties for specific applications, such as increased toughness for high-impact grinding or enhanced chemical inertness for sensitive pharmaceutical processing. These advancements translate into competitive advantages by enabling manufacturers to offer products that deliver higher throughput, reduce energy consumption, and improve the quality of the final ground product. The market fit for these evolved products is strong, as industries continuously seek more efficient and cost-effective milling solutions.
Report Scope & Segmentation Analysis
This report meticulously segments the Zirconia Alumina Composite Beads market based on key parameters to provide a granular understanding of market dynamics. The segmentation includes:
- Application:
- Ceramics: Expected to maintain its leading position with significant growth driven by the automotive and electronics sectors.
- Coatings: Demonstrating steady growth fueled by the construction and printing industries.
- Electronics and Semiconductors: Poised for rapid expansion due to the increasing demand for advanced microelectronic components.
- Pharmaceuticals: A high-value niche market with consistent growth driven by the need for precise API micronization.
- Type:
- 50% - 80% Zirconia Content: Projected for robust growth, catering to high-performance demanding applications.
- 30% - 50% Zirconia Content: Expected to witness steady expansion due to its versatility and cost-effectiveness.
- 10% - 30% Zirconia Content: Anticipated to see moderate growth, serving cost-sensitive applications.
Each segment's market size, growth projections, and competitive landscape are analyzed in detail within the report.
Key Drivers of Zirconia Alumina Composite Beads Growth
The growth of the Zirconia Alumina Composite Beads market is propelled by several key factors. Technologically, advancements in material science and manufacturing processes are leading to the development of beads with superior grinding performance, increased durability, and enhanced chemical inertness. Economically, the expanding industrial base in emerging economies, particularly in Asia Pacific, coupled with increased global demand for advanced materials in sectors like automotive, electronics, and pharmaceuticals, creates a significant market push. Regulatory factors, such as stricter quality control standards in pharmaceuticals and the push for more efficient and environmentally friendly industrial processes, also indirectly drive the adoption of high-performance grinding media.
Challenges in the Zirconia Alumina Composite Beads Sector
Despite its growth potential, the Zirconia Alumina Composite Beads sector faces certain challenges. Regulatory hurdles, particularly concerning the sourcing of raw materials and compliance with evolving environmental standards, can impact manufacturing costs and product availability. Supply chain disruptions, as evidenced by recent global events, can affect the availability and pricing of key raw materials like zirconia and alumina. Competitive pressures from established players and the potential for disruptive technologies also pose challenges, requiring continuous innovation and strategic pricing. The cost of high-performance composite beads can also be a barrier for some price-sensitive applications, limiting immediate adoption.
Emerging Opportunities in Zirconia Alumina Composite Beads
The Zirconia Alumina Composite Beads market presents numerous emerging opportunities. The growing trend towards sustainable manufacturing and circular economy principles opens avenues for developing beads with enhanced recyclability and reduced environmental footprint. The increasing demand for ultra-fine particle sizes in advanced materials, such as nanomaterials and specialized catalysts, creates new market segments. Furthermore, the expansion of research and development in fields like additive manufacturing and advanced battery technologies offers potential new applications for these high-performance composite beads. Emerging markets in developing regions, with their rapidly industrializing economies, represent significant untapped potential for market expansion.
Leading Players in the Zirconia Alumina Composite Beads Market
- Saint-Gobain ZirPro
- IMA
- Ball-Tec
- Inovatec Machinery
- Advanced Ceramic Materials
- Synco Industries Limited
- Titan Industrial Ceramic
- ZIBO ASAHI GLASS ALUMINA MATERIALS
- Ruitai Materials Technology
- Henan Sicheng Abrasives Tech
- Sheng Tai Gao Ye
Key Developments in Zirconia Alumina Composite Beads Industry
- 2023: Launch of new high-density zirconia alumina composite beads offering enhanced wear resistance.
- 2022: Strategic partnership formed to develop advanced composite beads for pharmaceutical micronization.
- 2021: Significant investment in R&D for novel composite formulations with improved thermal shock resistance.
- 2020: Introduction of eco-friendly manufacturing processes for composite beads.
- 2019: Acquisition of a smaller competitor to expand product portfolio and market reach.
Strategic Outlook for Zirconia Alumina Composite Beads Market
The strategic outlook for the Zirconia Alumina Composite Beads market is highly optimistic, driven by persistent demand for high-performance grinding solutions across diverse industries. Future growth catalysts include continued innovation in material science to develop even more efficient and specialized composite beads, particularly for niche applications like nanotechnology and advanced electronics. The expansion of manufacturing capabilities in emerging economies and the increasing focus on process optimization and sustainability will further fuel market penetration. Companies that can effectively address the evolving needs of end-users, invest in research and development, and navigate the global supply chain will be well-positioned for sustained success and market leadership.
Zirconia Alumina Composite Beads Segmentation
-
1. Application
- 1.1. Ceramics
- 1.2. Coatings
- 1.3. Electronics and Semiconductors
- 1.4. Pharmaceuticals
-
2. Type
- 2.1. 50% - 80%
- 2.2. 30% - 50%
- 2.3. 10% - 30%
Zirconia Alumina Composite Beads Segmentation By Geography
-
1. North America
- 1.1. United States
- 1.2. Canada
- 1.3. Mexico
-
2. South America
- 2.1. Brazil
- 2.2. Argentina
- 2.3. Rest of South America
-
3. Europe
- 3.1. United Kingdom
- 3.2. Germany
- 3.3. France
- 3.4. Italy
- 3.5. Spain
- 3.6. Russia
- 3.7. Benelux
- 3.8. Nordics
- 3.9. Rest of Europe
-
4. Middle East & Africa
- 4.1. Turkey
- 4.2. Israel
- 4.3. GCC
- 4.4. North Africa
- 4.5. South Africa
- 4.6. Rest of Middle East & Africa
-
5. Asia Pacific
- 5.1. China
- 5.2. India
- 5.3. Japan
- 5.4. South Korea
- 5.5. ASEAN
- 5.6. Oceania
- 5.7. Rest of Asia Pacific
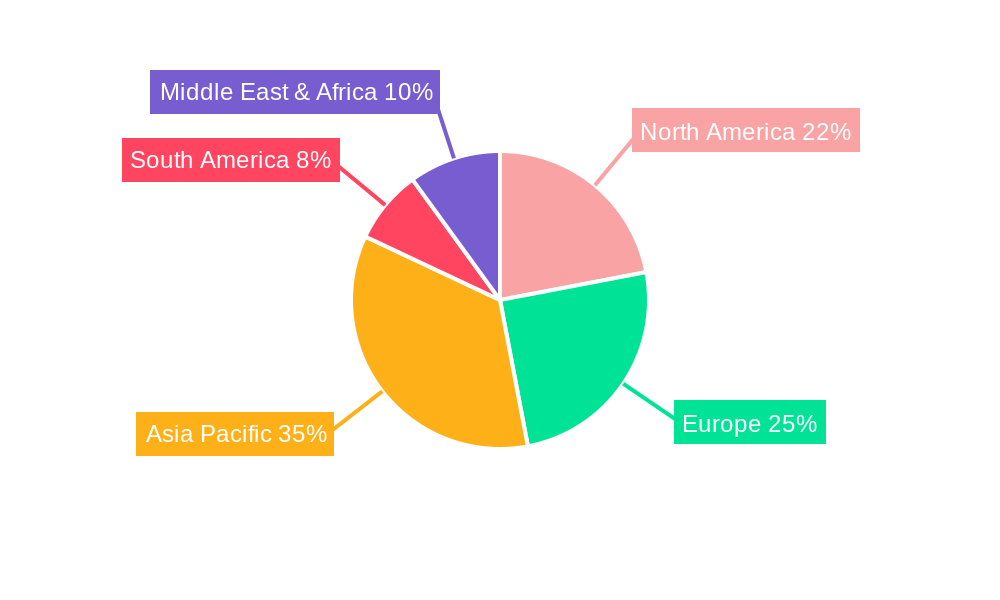
Zirconia Alumina Composite Beads Regional Market Share
Geographic Coverage of Zirconia Alumina Composite Beads
Zirconia Alumina Composite Beads REPORT HIGHLIGHTS
| Aspects | Details |
|---|---|
| Study Period | 2020-2034 |
| Base Year | 2025 |
| Estimated Year | 2026 |
| Forecast Period | 2026-2034 |
| Historical Period | 2020-2025 |
| Growth Rate | CAGR of 5.3% from 2020-2034 |
| Segmentation |
|
Table of Contents
- 1. Introduction
- 1.1. Research Scope
- 1.2. Market Segmentation
- 1.3. Research Objective
- 1.4. Definitions and Assumptions
- 2. Executive Summary
- 2.1. Market Snapshot
- 3. Market Dynamics
- 3.1. Market Drivers
- 3.2. Market Restrains
- 3.3. Market Trends
- 3.4. Market Opportunities
- 4. Market Factor Analysis
- 4.1. Porters Five Forces
- 4.1.1. Bargaining Power of Suppliers
- 4.1.2. Bargaining Power of Buyers
- 4.1.3. Threat of New Entrants
- 4.1.4. Threat of Substitutes
- 4.1.5. Competitive Rivalry
- 4.2. PESTEL analysis
- 4.3. BCG Analysis
- 4.3.1. Stars (High Growth, High Market Share)
- 4.3.2. Cash Cows (Low Growth, High Market Share)
- 4.3.3. Question Mark (High Growth, Low Market Share)
- 4.3.4. Dogs (Low Growth, Low Market Share)
- 4.4. Ansoff Matrix Analysis
- 4.5. Supply Chain Analysis
- 4.6. Regulatory Landscape
- 4.7. Current Market Potential and Opportunity Assessment (TAM–SAM–SOM Framework)
- 4.8. RAX Analyst Note
- 4.1. Porters Five Forces
- 5. Market Analysis, Insights and Forecast 2021-2033
- 5.1. Market Analysis, Insights and Forecast - by Application
- 5.1.1. Ceramics
- 5.1.2. Coatings
- 5.1.3. Electronics and Semiconductors
- 5.1.4. Pharmaceuticals
- 5.2. Market Analysis, Insights and Forecast - by Type
- 5.2.1. 50% - 80%
- 5.2.2. 30% - 50%
- 5.2.3. 10% - 30%
- 5.3. Market Analysis, Insights and Forecast - by Region
- 5.3.1. North America
- 5.3.2. South America
- 5.3.3. Europe
- 5.3.4. Middle East & Africa
- 5.3.5. Asia Pacific
- 5.1. Market Analysis, Insights and Forecast - by Application
- 6. Global Zirconia Alumina Composite Beads Analysis, Insights and Forecast, 2021-2033
- 6.1. Market Analysis, Insights and Forecast - by Application
- 6.1.1. Ceramics
- 6.1.2. Coatings
- 6.1.3. Electronics and Semiconductors
- 6.1.4. Pharmaceuticals
- 6.2. Market Analysis, Insights and Forecast - by Type
- 6.2.1. 50% - 80%
- 6.2.2. 30% - 50%
- 6.2.3. 10% - 30%
- 6.1. Market Analysis, Insights and Forecast - by Application
- 7. North America Zirconia Alumina Composite Beads Analysis, Insights and Forecast, 2020-2032
- 7.1. Market Analysis, Insights and Forecast - by Application
- 7.1.1. Ceramics
- 7.1.2. Coatings
- 7.1.3. Electronics and Semiconductors
- 7.1.4. Pharmaceuticals
- 7.2. Market Analysis, Insights and Forecast - by Type
- 7.2.1. 50% - 80%
- 7.2.2. 30% - 50%
- 7.2.3. 10% - 30%
- 7.1. Market Analysis, Insights and Forecast - by Application
- 8. South America Zirconia Alumina Composite Beads Analysis, Insights and Forecast, 2020-2032
- 8.1. Market Analysis, Insights and Forecast - by Application
- 8.1.1. Ceramics
- 8.1.2. Coatings
- 8.1.3. Electronics and Semiconductors
- 8.1.4. Pharmaceuticals
- 8.2. Market Analysis, Insights and Forecast - by Type
- 8.2.1. 50% - 80%
- 8.2.2. 30% - 50%
- 8.2.3. 10% - 30%
- 8.1. Market Analysis, Insights and Forecast - by Application
- 9. Europe Zirconia Alumina Composite Beads Analysis, Insights and Forecast, 2020-2032
- 9.1. Market Analysis, Insights and Forecast - by Application
- 9.1.1. Ceramics
- 9.1.2. Coatings
- 9.1.3. Electronics and Semiconductors
- 9.1.4. Pharmaceuticals
- 9.2. Market Analysis, Insights and Forecast - by Type
- 9.2.1. 50% - 80%
- 9.2.2. 30% - 50%
- 9.2.3. 10% - 30%
- 9.1. Market Analysis, Insights and Forecast - by Application
- 10. Middle East & Africa Zirconia Alumina Composite Beads Analysis, Insights and Forecast, 2020-2032
- 10.1. Market Analysis, Insights and Forecast - by Application
- 10.1.1. Ceramics
- 10.1.2. Coatings
- 10.1.3. Electronics and Semiconductors
- 10.1.4. Pharmaceuticals
- 10.2. Market Analysis, Insights and Forecast - by Type
- 10.2.1. 50% - 80%
- 10.2.2. 30% - 50%
- 10.2.3. 10% - 30%
- 10.1. Market Analysis, Insights and Forecast - by Application
- 11. Asia Pacific Zirconia Alumina Composite Beads Analysis, Insights and Forecast, 2020-2032
- 11.1. Market Analysis, Insights and Forecast - by Application
- 11.1.1. Ceramics
- 11.1.2. Coatings
- 11.1.3. Electronics and Semiconductors
- 11.1.4. Pharmaceuticals
- 11.2. Market Analysis, Insights and Forecast - by Type
- 11.2.1. 50% - 80%
- 11.2.2. 30% - 50%
- 11.2.3. 10% - 30%
- 11.1. Market Analysis, Insights and Forecast - by Application
- 12. Competitive Analysis
- 12.1. Company Profiles
- 12.1.1 Saint-Gobain ZirPro
- 12.1.1.1. Company Overview
- 12.1.1.2. Products
- 12.1.1.3. Company Financials
- 12.1.1.4. SWOT Analysis
- 12.1.2 IMA
- 12.1.2.1. Company Overview
- 12.1.2.2. Products
- 12.1.2.3. Company Financials
- 12.1.2.4. SWOT Analysis
- 12.1.3 Ball-Tec
- 12.1.3.1. Company Overview
- 12.1.3.2. Products
- 12.1.3.3. Company Financials
- 12.1.3.4. SWOT Analysis
- 12.1.4 Inovatec Machinery
- 12.1.4.1. Company Overview
- 12.1.4.2. Products
- 12.1.4.3. Company Financials
- 12.1.4.4. SWOT Analysis
- 12.1.5 Advanced Ceramic Materials
- 12.1.5.1. Company Overview
- 12.1.5.2. Products
- 12.1.5.3. Company Financials
- 12.1.5.4. SWOT Analysis
- 12.1.6 Synco Industries Limited
- 12.1.6.1. Company Overview
- 12.1.6.2. Products
- 12.1.6.3. Company Financials
- 12.1.6.4. SWOT Analysis
- 12.1.7 Titan Industrial Ceramic
- 12.1.7.1. Company Overview
- 12.1.7.2. Products
- 12.1.7.3. Company Financials
- 12.1.7.4. SWOT Analysis
- 12.1.8 ZIBO ASAHI GLASS ALUMINA MATERIALS
- 12.1.8.1. Company Overview
- 12.1.8.2. Products
- 12.1.8.3. Company Financials
- 12.1.8.4. SWOT Analysis
- 12.1.9 Ruitai Materials Technology
- 12.1.9.1. Company Overview
- 12.1.9.2. Products
- 12.1.9.3. Company Financials
- 12.1.9.4. SWOT Analysis
- 12.1.10 Henan Sicheng Abrasives Tech
- 12.1.10.1. Company Overview
- 12.1.10.2. Products
- 12.1.10.3. Company Financials
- 12.1.10.4. SWOT Analysis
- 12.1.11 Sheng Tai Gao Ye
- 12.1.11.1. Company Overview
- 12.1.11.2. Products
- 12.1.11.3. Company Financials
- 12.1.11.4. SWOT Analysis
- 12.1.1 Saint-Gobain ZirPro
- 12.2. Market Entropy
- 12.2.1 Company's Key Areas Served
- 12.2.2 Recent Developments
- 12.3. Company Market Share Analysis 2025
- 12.3.1 Top 5 Companies Market Share Analysis
- 12.3.2 Top 3 Companies Market Share Analysis
- 12.4. List of Potential Customers
- 13. Research Methodology
List of Figures
- Figure 1: Global Zirconia Alumina Composite Beads Revenue Breakdown (million, %) by Region 2025 & 2033
- Figure 2: North America Zirconia Alumina Composite Beads Revenue (million), by Application 2025 & 2033
- Figure 3: North America Zirconia Alumina Composite Beads Revenue Share (%), by Application 2025 & 2033
- Figure 4: North America Zirconia Alumina Composite Beads Revenue (million), by Type 2025 & 2033
- Figure 5: North America Zirconia Alumina Composite Beads Revenue Share (%), by Type 2025 & 2033
- Figure 6: North America Zirconia Alumina Composite Beads Revenue (million), by Country 2025 & 2033
- Figure 7: North America Zirconia Alumina Composite Beads Revenue Share (%), by Country 2025 & 2033
- Figure 8: South America Zirconia Alumina Composite Beads Revenue (million), by Application 2025 & 2033
- Figure 9: South America Zirconia Alumina Composite Beads Revenue Share (%), by Application 2025 & 2033
- Figure 10: South America Zirconia Alumina Composite Beads Revenue (million), by Type 2025 & 2033
- Figure 11: South America Zirconia Alumina Composite Beads Revenue Share (%), by Type 2025 & 2033
- Figure 12: South America Zirconia Alumina Composite Beads Revenue (million), by Country 2025 & 2033
- Figure 13: South America Zirconia Alumina Composite Beads Revenue Share (%), by Country 2025 & 2033
- Figure 14: Europe Zirconia Alumina Composite Beads Revenue (million), by Application 2025 & 2033
- Figure 15: Europe Zirconia Alumina Composite Beads Revenue Share (%), by Application 2025 & 2033
- Figure 16: Europe Zirconia Alumina Composite Beads Revenue (million), by Type 2025 & 2033
- Figure 17: Europe Zirconia Alumina Composite Beads Revenue Share (%), by Type 2025 & 2033
- Figure 18: Europe Zirconia Alumina Composite Beads Revenue (million), by Country 2025 & 2033
- Figure 19: Europe Zirconia Alumina Composite Beads Revenue Share (%), by Country 2025 & 2033
- Figure 20: Middle East & Africa Zirconia Alumina Composite Beads Revenue (million), by Application 2025 & 2033
- Figure 21: Middle East & Africa Zirconia Alumina Composite Beads Revenue Share (%), by Application 2025 & 2033
- Figure 22: Middle East & Africa Zirconia Alumina Composite Beads Revenue (million), by Type 2025 & 2033
- Figure 23: Middle East & Africa Zirconia Alumina Composite Beads Revenue Share (%), by Type 2025 & 2033
- Figure 24: Middle East & Africa Zirconia Alumina Composite Beads Revenue (million), by Country 2025 & 2033
- Figure 25: Middle East & Africa Zirconia Alumina Composite Beads Revenue Share (%), by Country 2025 & 2033
- Figure 26: Asia Pacific Zirconia Alumina Composite Beads Revenue (million), by Application 2025 & 2033
- Figure 27: Asia Pacific Zirconia Alumina Composite Beads Revenue Share (%), by Application 2025 & 2033
- Figure 28: Asia Pacific Zirconia Alumina Composite Beads Revenue (million), by Type 2025 & 2033
- Figure 29: Asia Pacific Zirconia Alumina Composite Beads Revenue Share (%), by Type 2025 & 2033
- Figure 30: Asia Pacific Zirconia Alumina Composite Beads Revenue (million), by Country 2025 & 2033
- Figure 31: Asia Pacific Zirconia Alumina Composite Beads Revenue Share (%), by Country 2025 & 2033
List of Tables
- Table 1: Global Zirconia Alumina Composite Beads Revenue million Forecast, by Application 2020 & 2033
- Table 2: Global Zirconia Alumina Composite Beads Revenue million Forecast, by Type 2020 & 2033
- Table 3: Global Zirconia Alumina Composite Beads Revenue million Forecast, by Region 2020 & 2033
- Table 4: Global Zirconia Alumina Composite Beads Revenue million Forecast, by Application 2020 & 2033
- Table 5: Global Zirconia Alumina Composite Beads Revenue million Forecast, by Type 2020 & 2033
- Table 6: Global Zirconia Alumina Composite Beads Revenue million Forecast, by Country 2020 & 2033
- Table 7: United States Zirconia Alumina Composite Beads Revenue (million) Forecast, by Application 2020 & 2033
- Table 8: Canada Zirconia Alumina Composite Beads Revenue (million) Forecast, by Application 2020 & 2033
- Table 9: Mexico Zirconia Alumina Composite Beads Revenue (million) Forecast, by Application 2020 & 2033
- Table 10: Global Zirconia Alumina Composite Beads Revenue million Forecast, by Application 2020 & 2033
- Table 11: Global Zirconia Alumina Composite Beads Revenue million Forecast, by Type 2020 & 2033
- Table 12: Global Zirconia Alumina Composite Beads Revenue million Forecast, by Country 2020 & 2033
- Table 13: Brazil Zirconia Alumina Composite Beads Revenue (million) Forecast, by Application 2020 & 2033
- Table 14: Argentina Zirconia Alumina Composite Beads Revenue (million) Forecast, by Application 2020 & 2033
- Table 15: Rest of South America Zirconia Alumina Composite Beads Revenue (million) Forecast, by Application 2020 & 2033
- Table 16: Global Zirconia Alumina Composite Beads Revenue million Forecast, by Application 2020 & 2033
- Table 17: Global Zirconia Alumina Composite Beads Revenue million Forecast, by Type 2020 & 2033
- Table 18: Global Zirconia Alumina Composite Beads Revenue million Forecast, by Country 2020 & 2033
- Table 19: United Kingdom Zirconia Alumina Composite Beads Revenue (million) Forecast, by Application 2020 & 2033
- Table 20: Germany Zirconia Alumina Composite Beads Revenue (million) Forecast, by Application 2020 & 2033
- Table 21: France Zirconia Alumina Composite Beads Revenue (million) Forecast, by Application 2020 & 2033
- Table 22: Italy Zirconia Alumina Composite Beads Revenue (million) Forecast, by Application 2020 & 2033
- Table 23: Spain Zirconia Alumina Composite Beads Revenue (million) Forecast, by Application 2020 & 2033
- Table 24: Russia Zirconia Alumina Composite Beads Revenue (million) Forecast, by Application 2020 & 2033
- Table 25: Benelux Zirconia Alumina Composite Beads Revenue (million) Forecast, by Application 2020 & 2033
- Table 26: Nordics Zirconia Alumina Composite Beads Revenue (million) Forecast, by Application 2020 & 2033
- Table 27: Rest of Europe Zirconia Alumina Composite Beads Revenue (million) Forecast, by Application 2020 & 2033
- Table 28: Global Zirconia Alumina Composite Beads Revenue million Forecast, by Application 2020 & 2033
- Table 29: Global Zirconia Alumina Composite Beads Revenue million Forecast, by Type 2020 & 2033
- Table 30: Global Zirconia Alumina Composite Beads Revenue million Forecast, by Country 2020 & 2033
- Table 31: Turkey Zirconia Alumina Composite Beads Revenue (million) Forecast, by Application 2020 & 2033
- Table 32: Israel Zirconia Alumina Composite Beads Revenue (million) Forecast, by Application 2020 & 2033
- Table 33: GCC Zirconia Alumina Composite Beads Revenue (million) Forecast, by Application 2020 & 2033
- Table 34: North Africa Zirconia Alumina Composite Beads Revenue (million) Forecast, by Application 2020 & 2033
- Table 35: South Africa Zirconia Alumina Composite Beads Revenue (million) Forecast, by Application 2020 & 2033
- Table 36: Rest of Middle East & Africa Zirconia Alumina Composite Beads Revenue (million) Forecast, by Application 2020 & 2033
- Table 37: Global Zirconia Alumina Composite Beads Revenue million Forecast, by Application 2020 & 2033
- Table 38: Global Zirconia Alumina Composite Beads Revenue million Forecast, by Type 2020 & 2033
- Table 39: Global Zirconia Alumina Composite Beads Revenue million Forecast, by Country 2020 & 2033
- Table 40: China Zirconia Alumina Composite Beads Revenue (million) Forecast, by Application 2020 & 2033
- Table 41: India Zirconia Alumina Composite Beads Revenue (million) Forecast, by Application 2020 & 2033
- Table 42: Japan Zirconia Alumina Composite Beads Revenue (million) Forecast, by Application 2020 & 2033
- Table 43: South Korea Zirconia Alumina Composite Beads Revenue (million) Forecast, by Application 2020 & 2033
- Table 44: ASEAN Zirconia Alumina Composite Beads Revenue (million) Forecast, by Application 2020 & 2033
- Table 45: Oceania Zirconia Alumina Composite Beads Revenue (million) Forecast, by Application 2020 & 2033
- Table 46: Rest of Asia Pacific Zirconia Alumina Composite Beads Revenue (million) Forecast, by Application 2020 & 2033
Frequently Asked Questions
1. What is the projected Compound Annual Growth Rate (CAGR) of the Zirconia Alumina Composite Beads?
The projected CAGR is approximately 5.3%.
2. Which companies are prominent players in the Zirconia Alumina Composite Beads?
Key companies in the market include Saint-Gobain ZirPro, IMA, Ball-Tec, Inovatec Machinery, Advanced Ceramic Materials, Synco Industries Limited, Titan Industrial Ceramic, ZIBO ASAHI GLASS ALUMINA MATERIALS, Ruitai Materials Technology, Henan Sicheng Abrasives Tech, Sheng Tai Gao Ye.
3. What are the main segments of the Zirconia Alumina Composite Beads?
The market segments include Application, Type.
4. Can you provide details about the market size?
The market size is estimated to be USD 181 million as of 2022.
5. What are some drivers contributing to market growth?
N/A
6. What are the notable trends driving market growth?
N/A
7. Are there any restraints impacting market growth?
N/A
8. Can you provide examples of recent developments in the market?
N/A
9. What pricing options are available for accessing the report?
Pricing options include single-user, multi-user, and enterprise licenses priced at USD 4250.00, USD 6375.00, and USD 8500.00 respectively.
10. Is the market size provided in terms of value or volume?
The market size is provided in terms of value, measured in million.
11. Are there any specific market keywords associated with the report?
Yes, the market keyword associated with the report is "Zirconia Alumina Composite Beads," which aids in identifying and referencing the specific market segment covered.
12. How do I determine which pricing option suits my needs best?
The pricing options vary based on user requirements and access needs. Individual users may opt for single-user licenses, while businesses requiring broader access may choose multi-user or enterprise licenses for cost-effective access to the report.
13. Are there any additional resources or data provided in the Zirconia Alumina Composite Beads report?
While the report offers comprehensive insights, it's advisable to review the specific contents or supplementary materials provided to ascertain if additional resources or data are available.
14. How can I stay updated on further developments or reports in the Zirconia Alumina Composite Beads?
To stay informed about further developments, trends, and reports in the Zirconia Alumina Composite Beads, consider subscribing to industry newsletters, following relevant companies and organizations, or regularly checking reputable industry news sources and publications.
Methodology
Step 1 - Identification of Relevant Samples Size from Population Database


Step 2 - Approaches for Defining Global Market Size (Value, Volume* & Price*)

Note*: In applicable scenarios
Step 3 - Data Sources
Primary Research
- Web Analytics
- Survey Reports
- Research Institute
- Latest Research Reports
- Opinion Leaders
Secondary Research
- Annual Reports
- White Paper
- Latest Press Release
- Industry Association
- Paid Database
- Investor Presentations

Step 4 - Data Triangulation
Involves using different sources of information in order to increase the validity of a study
These sources are likely to be stakeholders in a program - participants, other researchers, program staff, other community members, and so on.
Then we put all data in single framework & apply various statistical tools to find out the dynamic on the market.
During the analysis stage, feedback from the stakeholder groups would be compared to determine areas of agreement as well as areas of divergence

