

Key Insights
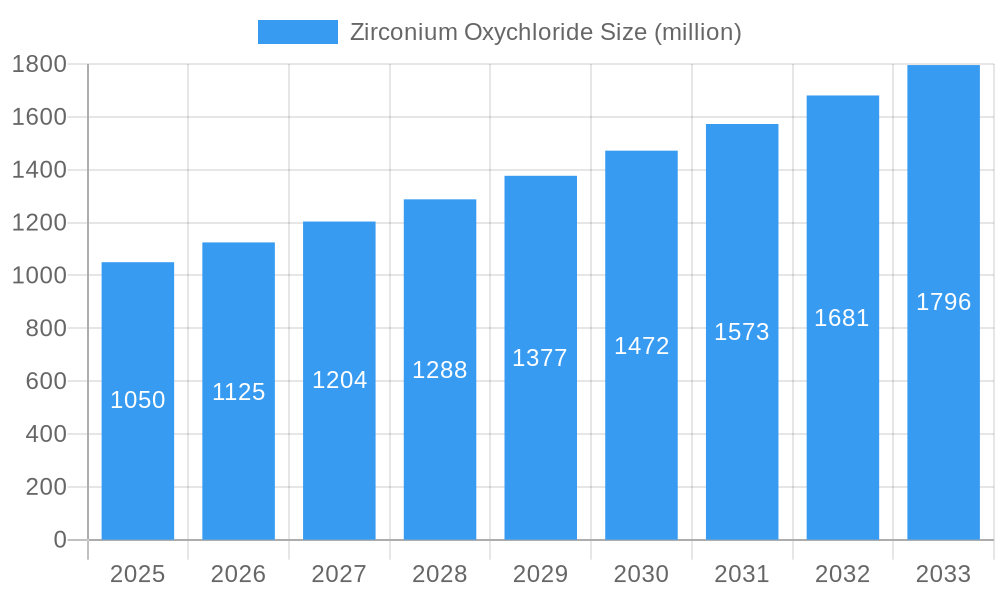
The global Zirconium Oxychloride market, valued at $1050 million in 2025, is projected to experience robust growth, driven by its increasing applications in diverse sectors. The Compound Annual Growth Rate (CAGR) of 6.9% from 2025 to 2033 indicates a significant expansion of the market over the forecast period. Key drivers include the rising demand for zirconium oxychloride in the refractory and chemical industries, fueled by advancements in materials science and the expanding global manufacturing sector. Increased usage in catalysts, ceramics, and other specialty chemicals further contributes to market growth. While precise data on regional segmentation is unavailable, a logical assumption based on established global manufacturing hubs would suggest a significant market share held by regions like Asia-Pacific (due to the presence of key manufacturers listed), followed by North America and Europe. Competition within the market is evident from the presence of several key players, including Shandong Guangtong New Materials, KINGAN Hi-Tech, and others, indicating a dynamic landscape with ongoing innovation and strategic partnerships driving growth.
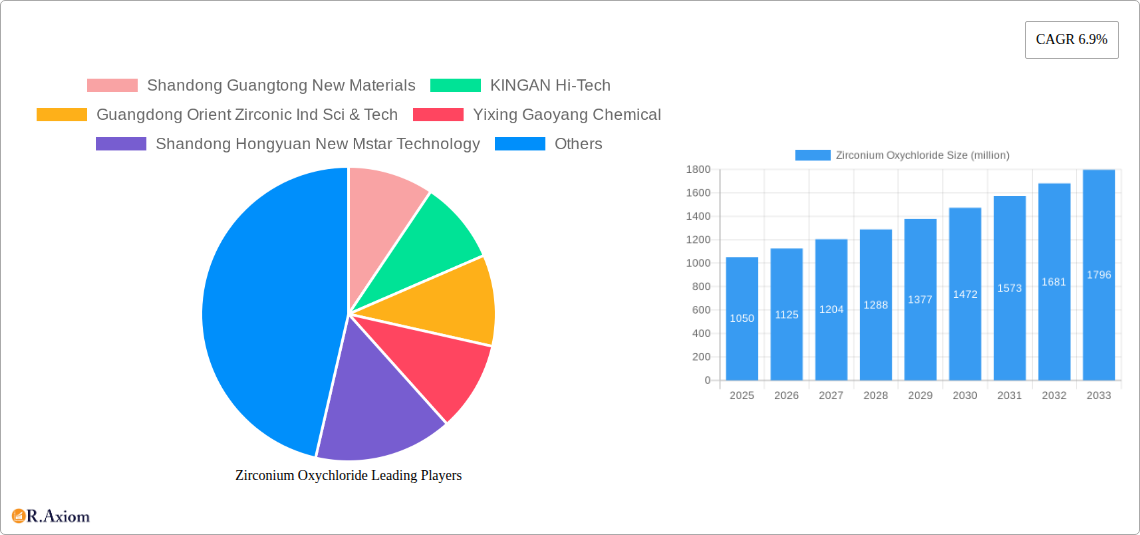
Zirconium Oxychloride Market Size (In Billion)
The market's sustained growth trajectory is likely to be influenced by several factors. Continued technological advancements leading to improved efficiency and enhanced performance characteristics of zirconium oxychloride will be crucial. Government regulations and environmental concerns related to chemical manufacturing might present some restraints, although innovation in sustainable production methods could mitigate these challenges. Furthermore, fluctuating raw material prices and global economic conditions could influence market dynamics. The forecast period (2025-2033) presents significant opportunities for market expansion, especially for companies capable of leveraging technological advancements, optimizing production processes, and catering to the evolving needs of diverse industry sectors. Careful monitoring of geopolitical factors and emerging market trends will be critical for successful navigation of the market landscape.
Zirconium Oxychloride Company Market Share
Zirconium Oxychloride Market Report: 2019-2033 - A Comprehensive Analysis
This comprehensive report provides an in-depth analysis of the global Zirconium Oxychloride market, offering invaluable insights for industry stakeholders, investors, and strategic decision-makers. Covering the period from 2019 to 2033, with a base year of 2025 and a forecast period of 2025-2033, this report meticulously examines market dynamics, growth drivers, challenges, and emerging opportunities. It leverages extensive primary and secondary research to deliver actionable intelligence, forecasting a market valued at xx million by 2033.
Zirconium Oxychloride Market Concentration & Innovation
The Zirconium Oxychloride market exhibits a moderately concentrated landscape, with key players holding significant market share. Shandong Guangtong New Materials, KINGAN Hi-Tech, and Guangdong Orient Zirconic Ind Sci & Tech are among the leading companies, collectively accounting for an estimated xx% of the global market in 2025. Innovation is driven by the need for higher purity products, improved production efficiency, and the development of new applications across diverse industries. Regulatory frameworks concerning environmental protection and product safety play a crucial role in shaping market dynamics. Substitutes, such as other zirconium compounds, pose a competitive threat, but the unique properties of Zirconium Oxychloride maintain its demand. Mergers and acquisitions (M&A) activity has been moderate, with deal values totaling approximately xx million in the last five years. The M&A landscape is influenced by the desire to expand geographical reach, enhance product portfolios, and access new technologies.
- Market Share (2025):
- Shandong Guangtong New Materials: xx%
- KINGAN Hi-Tech: xx%
- Guangdong Orient Zirconic Ind Sci & Tech: xx%
- Others: xx%
- M&A Activity (2019-2024): Total deal value: xx million
Zirconium Oxychloride Industry Trends & Insights
The Zirconium Oxychloride market is experiencing robust growth, driven by increasing demand from various end-use sectors, including ceramics, refractories, and catalysts. The Compound Annual Growth Rate (CAGR) from 2025 to 2033 is projected to be xx%, indicating significant market expansion. Technological advancements in production processes, leading to improved product quality and reduced costs, are fueling market growth. Consumer preferences are shifting towards higher-performance materials with enhanced properties, such as improved heat resistance and chemical stability. The competitive landscape is characterized by both established players and emerging entrants, leading to intense competition based on pricing, product innovation, and technological superiority. Market penetration in emerging economies is expected to rise steadily, driven by industrialization and infrastructure development.
Dominant Markets & Segments in Zirconium Oxychloride
The Asia-Pacific region dominates the Zirconium Oxychloride market, driven by rapid industrialization, especially in China and India. China's robust manufacturing sector and its significant contribution to global ceramic production propel its dominance.
- Key Drivers of Regional Dominance:
- China: High demand from the ceramic industry, robust government support for industrial growth, and a well-established manufacturing base.
- India: Rapid industrialization, increasing demand from the construction and chemical industries, and government initiatives promoting infrastructure development.
- Other Asia-Pacific Countries: Growing industrial activity and rising demand across multiple sectors.
Zirconium Oxychloride Product Developments
Recent product developments focus on enhancing purity levels, improving particle size distribution for optimal performance in specific applications, and exploring novel applications in emerging sectors. These innovations leverage advanced production techniques, such as sol-gel methods and chemical vapor deposition, to meet evolving market demands. The competitive advantage lies in offering customized products with tailored properties to cater to specific customer needs.
Report Scope & Segmentation Analysis
This report segments the Zirconium Oxychloride market by application (ceramics, refractories, catalysts, etc.), by grade (high purity, industrial grade, etc.), and by region (North America, Europe, Asia-Pacific, etc.). Each segment is analyzed individually, providing insights into market size, growth projections, and competitive dynamics. The ceramics segment is projected to dominate due to its large-scale use in various applications.
Key Drivers of Zirconium Oxychloride Growth
The growth of the Zirconium Oxychloride market is primarily fueled by rising demand from the ceramics industry, driven by growing urbanization and infrastructure development globally. Technological advancements leading to improved production efficiency and cost reductions also play a key role. Favorable government policies and regulations promoting industrial growth in several regions further support market expansion.
Challenges in the Zirconium Oxychloride Sector
Challenges include fluctuations in raw material prices, potential environmental concerns related to production processes, and intense competition from alternative materials. Stringent environmental regulations in certain regions pose compliance challenges for manufacturers. Supply chain disruptions can impact product availability and pricing.
Emerging Opportunities in Zirconium Oxychloride
Emerging opportunities include the development of new applications in advanced materials, such as energy storage and biomedical devices. Expansion into new markets, particularly in developing economies with growing industrialization, presents significant growth potential. Investment in research and development to improve product performance and explore new applications offers lucrative prospects.
Leading Players in the Zirconium Oxychloride Market
- Shandong Guangtong New Materials
- KINGAN Hi-Tech
- Guangdong Orient Zirconic Ind Sci & Tech
- Yixing Gaoyang Chemical
- Shandong Hongyuan New Mstar Technology
- Anhui Kangda Zirconium Industry
- Sanxiang Advanced Materials
- Zhejiang Zr-Valley Science & Technology
Key Developments in Zirconium Oxychloride Industry
- 2022: KINGAN Hi-Tech announced a significant expansion of its production capacity.
- 2021: Shandong Guangtong New Materials launched a new high-purity Zirconium Oxychloride product.
- 2020: Guangdong Orient Zirconic Ind Sci & Tech invested in a new R&D facility focused on advanced Zirconium Oxychloride applications.
- 2019: Yixing Gaoyang Chemical acquired a smaller competitor, expanding its market share.
Strategic Outlook for Zirconium Oxychloride Market
The Zirconium Oxychloride market is poised for continued growth, driven by sustained demand from established and emerging applications. Strategic investments in R&D, capacity expansion, and market diversification are crucial for players to maintain a competitive edge. Focusing on sustainability and meeting stringent environmental regulations will be key to long-term success in this market.
Zirconium Oxychloride Segmentation
-
1. Application
- 1.1. Refractory Industry
- 1.2. Paints and Coatings
- 1.3. Catalyst
- 1.4. Textile Industry
- 1.5. Others
-
2. Type
- 2.1. ZrO2+HfO2% Min 36.0%
- 2.2. ZrO2+HfO2% Min 35.0%
Zirconium Oxychloride Segmentation By Geography
-
1. North America
- 1.1. United States
- 1.2. Canada
- 1.3. Mexico
-
2. South America
- 2.1. Brazil
- 2.2. Argentina
- 2.3. Rest of South America
-
3. Europe
- 3.1. United Kingdom
- 3.2. Germany
- 3.3. France
- 3.4. Italy
- 3.5. Spain
- 3.6. Russia
- 3.7. Benelux
- 3.8. Nordics
- 3.9. Rest of Europe
-
4. Middle East & Africa
- 4.1. Turkey
- 4.2. Israel
- 4.3. GCC
- 4.4. North Africa
- 4.5. South Africa
- 4.6. Rest of Middle East & Africa
-
5. Asia Pacific
- 5.1. China
- 5.2. India
- 5.3. Japan
- 5.4. South Korea
- 5.5. ASEAN
- 5.6. Oceania
- 5.7. Rest of Asia Pacific
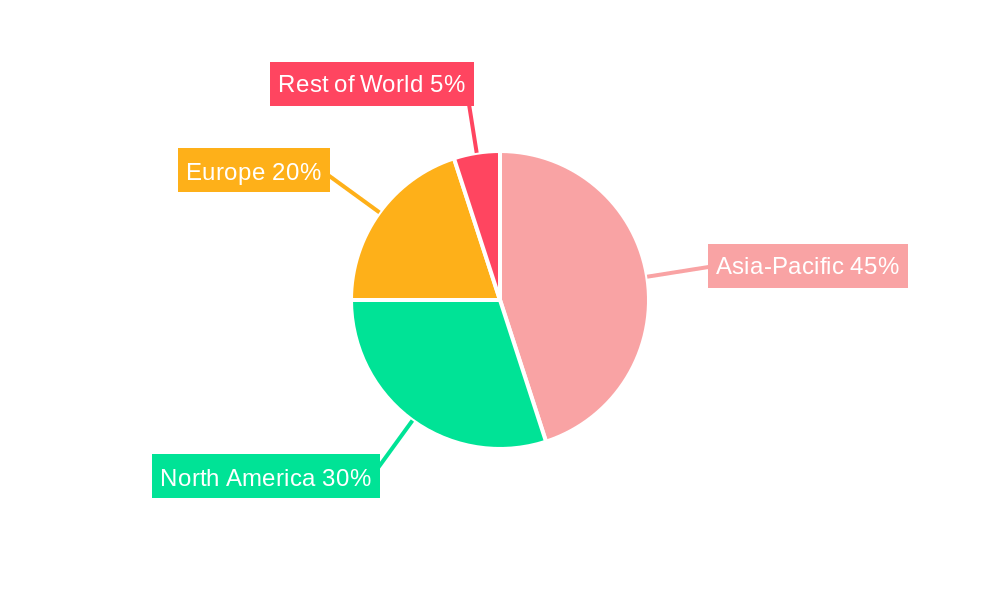
Zirconium Oxychloride Regional Market Share
Geographic Coverage of Zirconium Oxychloride
Zirconium Oxychloride REPORT HIGHLIGHTS
| Aspects | Details |
|---|---|
| Study Period | 2020-2034 |
| Base Year | 2025 |
| Estimated Year | 2026 |
| Forecast Period | 2026-2034 |
| Historical Period | 2020-2025 |
| Growth Rate | CAGR of 6.9% from 2020-2034 |
| Segmentation |
|
Table of Contents
- 1. Introduction
- 1.1. Research Scope
- 1.2. Market Segmentation
- 1.3. Research Objective
- 1.4. Definitions and Assumptions
- 2. Executive Summary
- 2.1. Market Snapshot
- 3. Market Dynamics
- 3.1. Market Drivers
- 3.2. Market Restrains
- 3.3. Market Trends
- 3.4. Market Opportunities
- 4. Market Factor Analysis
- 4.1. Porters Five Forces
- 4.1.1. Bargaining Power of Suppliers
- 4.1.2. Bargaining Power of Buyers
- 4.1.3. Threat of New Entrants
- 4.1.4. Threat of Substitutes
- 4.1.5. Competitive Rivalry
- 4.2. PESTEL analysis
- 4.3. BCG Analysis
- 4.3.1. Stars (High Growth, High Market Share)
- 4.3.2. Cash Cows (Low Growth, High Market Share)
- 4.3.3. Question Mark (High Growth, Low Market Share)
- 4.3.4. Dogs (Low Growth, Low Market Share)
- 4.4. Ansoff Matrix Analysis
- 4.5. Supply Chain Analysis
- 4.6. Regulatory Landscape
- 4.7. Current Market Potential and Opportunity Assessment (TAM–SAM–SOM Framework)
- 4.8. RAX Analyst Note
- 4.1. Porters Five Forces
- 5. Market Analysis, Insights and Forecast 2021-2033
- 5.1. Market Analysis, Insights and Forecast - by Application
- 5.1.1. Refractory Industry
- 5.1.2. Paints and Coatings
- 5.1.3. Catalyst
- 5.1.4. Textile Industry
- 5.1.5. Others
- 5.2. Market Analysis, Insights and Forecast - by Type
- 5.2.1. ZrO2+HfO2% Min 36.0%
- 5.2.2. ZrO2+HfO2% Min 35.0%
- 5.3. Market Analysis, Insights and Forecast - by Region
- 5.3.1. North America
- 5.3.2. South America
- 5.3.3. Europe
- 5.3.4. Middle East & Africa
- 5.3.5. Asia Pacific
- 5.1. Market Analysis, Insights and Forecast - by Application
- 6. Global Zirconium Oxychloride Analysis, Insights and Forecast, 2021-2033
- 6.1. Market Analysis, Insights and Forecast - by Application
- 6.1.1. Refractory Industry
- 6.1.2. Paints and Coatings
- 6.1.3. Catalyst
- 6.1.4. Textile Industry
- 6.1.5. Others
- 6.2. Market Analysis, Insights and Forecast - by Type
- 6.2.1. ZrO2+HfO2% Min 36.0%
- 6.2.2. ZrO2+HfO2% Min 35.0%
- 6.1. Market Analysis, Insights and Forecast - by Application
- 7. North America Zirconium Oxychloride Analysis, Insights and Forecast, 2020-2032
- 7.1. Market Analysis, Insights and Forecast - by Application
- 7.1.1. Refractory Industry
- 7.1.2. Paints and Coatings
- 7.1.3. Catalyst
- 7.1.4. Textile Industry
- 7.1.5. Others
- 7.2. Market Analysis, Insights and Forecast - by Type
- 7.2.1. ZrO2+HfO2% Min 36.0%
- 7.2.2. ZrO2+HfO2% Min 35.0%
- 7.1. Market Analysis, Insights and Forecast - by Application
- 8. South America Zirconium Oxychloride Analysis, Insights and Forecast, 2020-2032
- 8.1. Market Analysis, Insights and Forecast - by Application
- 8.1.1. Refractory Industry
- 8.1.2. Paints and Coatings
- 8.1.3. Catalyst
- 8.1.4. Textile Industry
- 8.1.5. Others
- 8.2. Market Analysis, Insights and Forecast - by Type
- 8.2.1. ZrO2+HfO2% Min 36.0%
- 8.2.2. ZrO2+HfO2% Min 35.0%
- 8.1. Market Analysis, Insights and Forecast - by Application
- 9. Europe Zirconium Oxychloride Analysis, Insights and Forecast, 2020-2032
- 9.1. Market Analysis, Insights and Forecast - by Application
- 9.1.1. Refractory Industry
- 9.1.2. Paints and Coatings
- 9.1.3. Catalyst
- 9.1.4. Textile Industry
- 9.1.5. Others
- 9.2. Market Analysis, Insights and Forecast - by Type
- 9.2.1. ZrO2+HfO2% Min 36.0%
- 9.2.2. ZrO2+HfO2% Min 35.0%
- 9.1. Market Analysis, Insights and Forecast - by Application
- 10. Middle East & Africa Zirconium Oxychloride Analysis, Insights and Forecast, 2020-2032
- 10.1. Market Analysis, Insights and Forecast - by Application
- 10.1.1. Refractory Industry
- 10.1.2. Paints and Coatings
- 10.1.3. Catalyst
- 10.1.4. Textile Industry
- 10.1.5. Others
- 10.2. Market Analysis, Insights and Forecast - by Type
- 10.2.1. ZrO2+HfO2% Min 36.0%
- 10.2.2. ZrO2+HfO2% Min 35.0%
- 10.1. Market Analysis, Insights and Forecast - by Application
- 11. Asia Pacific Zirconium Oxychloride Analysis, Insights and Forecast, 2020-2032
- 11.1. Market Analysis, Insights and Forecast - by Application
- 11.1.1. Refractory Industry
- 11.1.2. Paints and Coatings
- 11.1.3. Catalyst
- 11.1.4. Textile Industry
- 11.1.5. Others
- 11.2. Market Analysis, Insights and Forecast - by Type
- 11.2.1. ZrO2+HfO2% Min 36.0%
- 11.2.2. ZrO2+HfO2% Min 35.0%
- 11.1. Market Analysis, Insights and Forecast - by Application
- 12. Competitive Analysis
- 12.1. Company Profiles
- 12.1.1 Shandong Guangtong New Materials
- 12.1.1.1. Company Overview
- 12.1.1.2. Products
- 12.1.1.3. Company Financials
- 12.1.1.4. SWOT Analysis
- 12.1.2 KINGAN Hi-Tech
- 12.1.2.1. Company Overview
- 12.1.2.2. Products
- 12.1.2.3. Company Financials
- 12.1.2.4. SWOT Analysis
- 12.1.3 Guangdong Orient Zirconic Ind Sci & Tech
- 12.1.3.1. Company Overview
- 12.1.3.2. Products
- 12.1.3.3. Company Financials
- 12.1.3.4. SWOT Analysis
- 12.1.4 Yixing Gaoyang Chemical
- 12.1.4.1. Company Overview
- 12.1.4.2. Products
- 12.1.4.3. Company Financials
- 12.1.4.4. SWOT Analysis
- 12.1.5 Shandong Hongyuan New Mstar Technology
- 12.1.5.1. Company Overview
- 12.1.5.2. Products
- 12.1.5.3. Company Financials
- 12.1.5.4. SWOT Analysis
- 12.1.6 Anhui Kangda Zirconium Industry
- 12.1.6.1. Company Overview
- 12.1.6.2. Products
- 12.1.6.3. Company Financials
- 12.1.6.4. SWOT Analysis
- 12.1.7 Sanxiang Advanced Materials
- 12.1.7.1. Company Overview
- 12.1.7.2. Products
- 12.1.7.3. Company Financials
- 12.1.7.4. SWOT Analysis
- 12.1.8 Zhejiang Zr-Valley Science & Technology
- 12.1.8.1. Company Overview
- 12.1.8.2. Products
- 12.1.8.3. Company Financials
- 12.1.8.4. SWOT Analysis
- 12.1.1 Shandong Guangtong New Materials
- 12.2. Market Entropy
- 12.2.1 Company's Key Areas Served
- 12.2.2 Recent Developments
- 12.3. Company Market Share Analysis 2025
- 12.3.1 Top 5 Companies Market Share Analysis
- 12.3.2 Top 3 Companies Market Share Analysis
- 12.4. List of Potential Customers
- 13. Research Methodology
List of Figures
- Figure 1: Global Zirconium Oxychloride Revenue Breakdown (million, %) by Region 2025 & 2033
- Figure 2: North America Zirconium Oxychloride Revenue (million), by Application 2025 & 2033
- Figure 3: North America Zirconium Oxychloride Revenue Share (%), by Application 2025 & 2033
- Figure 4: North America Zirconium Oxychloride Revenue (million), by Type 2025 & 2033
- Figure 5: North America Zirconium Oxychloride Revenue Share (%), by Type 2025 & 2033
- Figure 6: North America Zirconium Oxychloride Revenue (million), by Country 2025 & 2033
- Figure 7: North America Zirconium Oxychloride Revenue Share (%), by Country 2025 & 2033
- Figure 8: South America Zirconium Oxychloride Revenue (million), by Application 2025 & 2033
- Figure 9: South America Zirconium Oxychloride Revenue Share (%), by Application 2025 & 2033
- Figure 10: South America Zirconium Oxychloride Revenue (million), by Type 2025 & 2033
- Figure 11: South America Zirconium Oxychloride Revenue Share (%), by Type 2025 & 2033
- Figure 12: South America Zirconium Oxychloride Revenue (million), by Country 2025 & 2033
- Figure 13: South America Zirconium Oxychloride Revenue Share (%), by Country 2025 & 2033
- Figure 14: Europe Zirconium Oxychloride Revenue (million), by Application 2025 & 2033
- Figure 15: Europe Zirconium Oxychloride Revenue Share (%), by Application 2025 & 2033
- Figure 16: Europe Zirconium Oxychloride Revenue (million), by Type 2025 & 2033
- Figure 17: Europe Zirconium Oxychloride Revenue Share (%), by Type 2025 & 2033
- Figure 18: Europe Zirconium Oxychloride Revenue (million), by Country 2025 & 2033
- Figure 19: Europe Zirconium Oxychloride Revenue Share (%), by Country 2025 & 2033
- Figure 20: Middle East & Africa Zirconium Oxychloride Revenue (million), by Application 2025 & 2033
- Figure 21: Middle East & Africa Zirconium Oxychloride Revenue Share (%), by Application 2025 & 2033
- Figure 22: Middle East & Africa Zirconium Oxychloride Revenue (million), by Type 2025 & 2033
- Figure 23: Middle East & Africa Zirconium Oxychloride Revenue Share (%), by Type 2025 & 2033
- Figure 24: Middle East & Africa Zirconium Oxychloride Revenue (million), by Country 2025 & 2033
- Figure 25: Middle East & Africa Zirconium Oxychloride Revenue Share (%), by Country 2025 & 2033
- Figure 26: Asia Pacific Zirconium Oxychloride Revenue (million), by Application 2025 & 2033
- Figure 27: Asia Pacific Zirconium Oxychloride Revenue Share (%), by Application 2025 & 2033
- Figure 28: Asia Pacific Zirconium Oxychloride Revenue (million), by Type 2025 & 2033
- Figure 29: Asia Pacific Zirconium Oxychloride Revenue Share (%), by Type 2025 & 2033
- Figure 30: Asia Pacific Zirconium Oxychloride Revenue (million), by Country 2025 & 2033
- Figure 31: Asia Pacific Zirconium Oxychloride Revenue Share (%), by Country 2025 & 2033
List of Tables
- Table 1: Global Zirconium Oxychloride Revenue million Forecast, by Application 2020 & 2033
- Table 2: Global Zirconium Oxychloride Revenue million Forecast, by Type 2020 & 2033
- Table 3: Global Zirconium Oxychloride Revenue million Forecast, by Region 2020 & 2033
- Table 4: Global Zirconium Oxychloride Revenue million Forecast, by Application 2020 & 2033
- Table 5: Global Zirconium Oxychloride Revenue million Forecast, by Type 2020 & 2033
- Table 6: Global Zirconium Oxychloride Revenue million Forecast, by Country 2020 & 2033
- Table 7: United States Zirconium Oxychloride Revenue (million) Forecast, by Application 2020 & 2033
- Table 8: Canada Zirconium Oxychloride Revenue (million) Forecast, by Application 2020 & 2033
- Table 9: Mexico Zirconium Oxychloride Revenue (million) Forecast, by Application 2020 & 2033
- Table 10: Global Zirconium Oxychloride Revenue million Forecast, by Application 2020 & 2033
- Table 11: Global Zirconium Oxychloride Revenue million Forecast, by Type 2020 & 2033
- Table 12: Global Zirconium Oxychloride Revenue million Forecast, by Country 2020 & 2033
- Table 13: Brazil Zirconium Oxychloride Revenue (million) Forecast, by Application 2020 & 2033
- Table 14: Argentina Zirconium Oxychloride Revenue (million) Forecast, by Application 2020 & 2033
- Table 15: Rest of South America Zirconium Oxychloride Revenue (million) Forecast, by Application 2020 & 2033
- Table 16: Global Zirconium Oxychloride Revenue million Forecast, by Application 2020 & 2033
- Table 17: Global Zirconium Oxychloride Revenue million Forecast, by Type 2020 & 2033
- Table 18: Global Zirconium Oxychloride Revenue million Forecast, by Country 2020 & 2033
- Table 19: United Kingdom Zirconium Oxychloride Revenue (million) Forecast, by Application 2020 & 2033
- Table 20: Germany Zirconium Oxychloride Revenue (million) Forecast, by Application 2020 & 2033
- Table 21: France Zirconium Oxychloride Revenue (million) Forecast, by Application 2020 & 2033
- Table 22: Italy Zirconium Oxychloride Revenue (million) Forecast, by Application 2020 & 2033
- Table 23: Spain Zirconium Oxychloride Revenue (million) Forecast, by Application 2020 & 2033
- Table 24: Russia Zirconium Oxychloride Revenue (million) Forecast, by Application 2020 & 2033
- Table 25: Benelux Zirconium Oxychloride Revenue (million) Forecast, by Application 2020 & 2033
- Table 26: Nordics Zirconium Oxychloride Revenue (million) Forecast, by Application 2020 & 2033
- Table 27: Rest of Europe Zirconium Oxychloride Revenue (million) Forecast, by Application 2020 & 2033
- Table 28: Global Zirconium Oxychloride Revenue million Forecast, by Application 2020 & 2033
- Table 29: Global Zirconium Oxychloride Revenue million Forecast, by Type 2020 & 2033
- Table 30: Global Zirconium Oxychloride Revenue million Forecast, by Country 2020 & 2033
- Table 31: Turkey Zirconium Oxychloride Revenue (million) Forecast, by Application 2020 & 2033
- Table 32: Israel Zirconium Oxychloride Revenue (million) Forecast, by Application 2020 & 2033
- Table 33: GCC Zirconium Oxychloride Revenue (million) Forecast, by Application 2020 & 2033
- Table 34: North Africa Zirconium Oxychloride Revenue (million) Forecast, by Application 2020 & 2033
- Table 35: South Africa Zirconium Oxychloride Revenue (million) Forecast, by Application 2020 & 2033
- Table 36: Rest of Middle East & Africa Zirconium Oxychloride Revenue (million) Forecast, by Application 2020 & 2033
- Table 37: Global Zirconium Oxychloride Revenue million Forecast, by Application 2020 & 2033
- Table 38: Global Zirconium Oxychloride Revenue million Forecast, by Type 2020 & 2033
- Table 39: Global Zirconium Oxychloride Revenue million Forecast, by Country 2020 & 2033
- Table 40: China Zirconium Oxychloride Revenue (million) Forecast, by Application 2020 & 2033
- Table 41: India Zirconium Oxychloride Revenue (million) Forecast, by Application 2020 & 2033
- Table 42: Japan Zirconium Oxychloride Revenue (million) Forecast, by Application 2020 & 2033
- Table 43: South Korea Zirconium Oxychloride Revenue (million) Forecast, by Application 2020 & 2033
- Table 44: ASEAN Zirconium Oxychloride Revenue (million) Forecast, by Application 2020 & 2033
- Table 45: Oceania Zirconium Oxychloride Revenue (million) Forecast, by Application 2020 & 2033
- Table 46: Rest of Asia Pacific Zirconium Oxychloride Revenue (million) Forecast, by Application 2020 & 2033
Frequently Asked Questions
1. What is the projected Compound Annual Growth Rate (CAGR) of the Zirconium Oxychloride?
The projected CAGR is approximately 6.9%.
2. Which companies are prominent players in the Zirconium Oxychloride?
Key companies in the market include Shandong Guangtong New Materials, KINGAN Hi-Tech, Guangdong Orient Zirconic Ind Sci & Tech, Yixing Gaoyang Chemical, Shandong Hongyuan New Mstar Technology, Anhui Kangda Zirconium Industry, Sanxiang Advanced Materials, Zhejiang Zr-Valley Science & Technology.
3. What are the main segments of the Zirconium Oxychloride?
The market segments include Application, Type.
4. Can you provide details about the market size?
The market size is estimated to be USD 1050 million as of 2022.
5. What are some drivers contributing to market growth?
N/A
6. What are the notable trends driving market growth?
N/A
7. Are there any restraints impacting market growth?
N/A
8. Can you provide examples of recent developments in the market?
N/A
9. What pricing options are available for accessing the report?
Pricing options include single-user, multi-user, and enterprise licenses priced at USD 5900.00, USD 8850.00, and USD 11800.00 respectively.
10. Is the market size provided in terms of value or volume?
The market size is provided in terms of value, measured in million.
11. Are there any specific market keywords associated with the report?
Yes, the market keyword associated with the report is "Zirconium Oxychloride," which aids in identifying and referencing the specific market segment covered.
12. How do I determine which pricing option suits my needs best?
The pricing options vary based on user requirements and access needs. Individual users may opt for single-user licenses, while businesses requiring broader access may choose multi-user or enterprise licenses for cost-effective access to the report.
13. Are there any additional resources or data provided in the Zirconium Oxychloride report?
While the report offers comprehensive insights, it's advisable to review the specific contents or supplementary materials provided to ascertain if additional resources or data are available.
14. How can I stay updated on further developments or reports in the Zirconium Oxychloride?
To stay informed about further developments, trends, and reports in the Zirconium Oxychloride, consider subscribing to industry newsletters, following relevant companies and organizations, or regularly checking reputable industry news sources and publications.
Methodology
Step 1 - Identification of Relevant Samples Size from Population Database


Step 2 - Approaches for Defining Global Market Size (Value, Volume* & Price*)

Note*: In applicable scenarios
Step 3 - Data Sources
Primary Research
- Web Analytics
- Survey Reports
- Research Institute
- Latest Research Reports
- Opinion Leaders
Secondary Research
- Annual Reports
- White Paper
- Latest Press Release
- Industry Association
- Paid Database
- Investor Presentations

Step 4 - Data Triangulation
Involves using different sources of information in order to increase the validity of a study
These sources are likely to be stakeholders in a program - participants, other researchers, program staff, other community members, and so on.
Then we put all data in single framework & apply various statistical tools to find out the dynamic on the market.
During the analysis stage, feedback from the stakeholder groups would be compared to determine areas of agreement as well as areas of divergence