
Key Insights
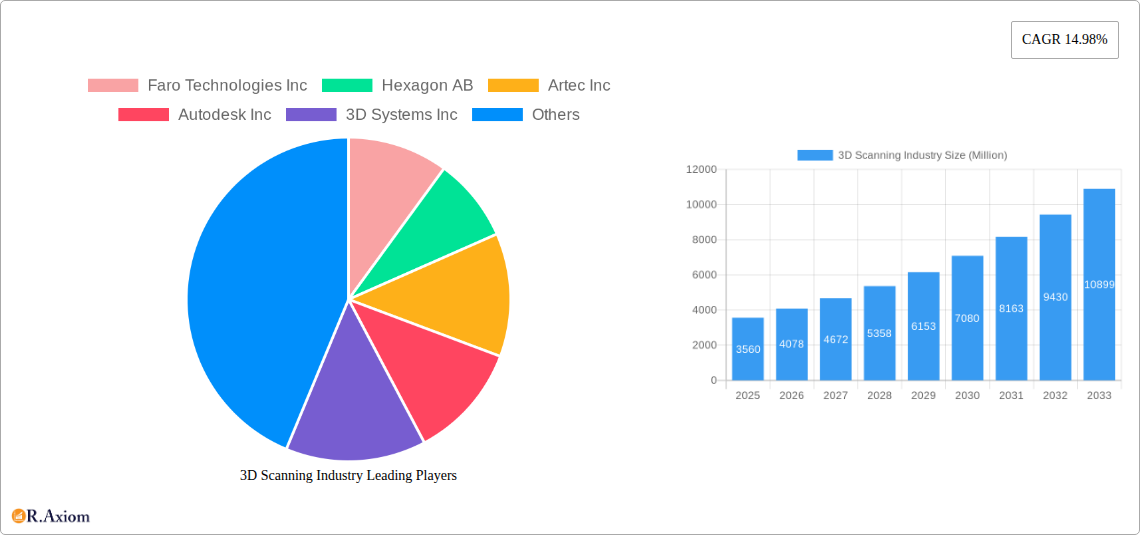
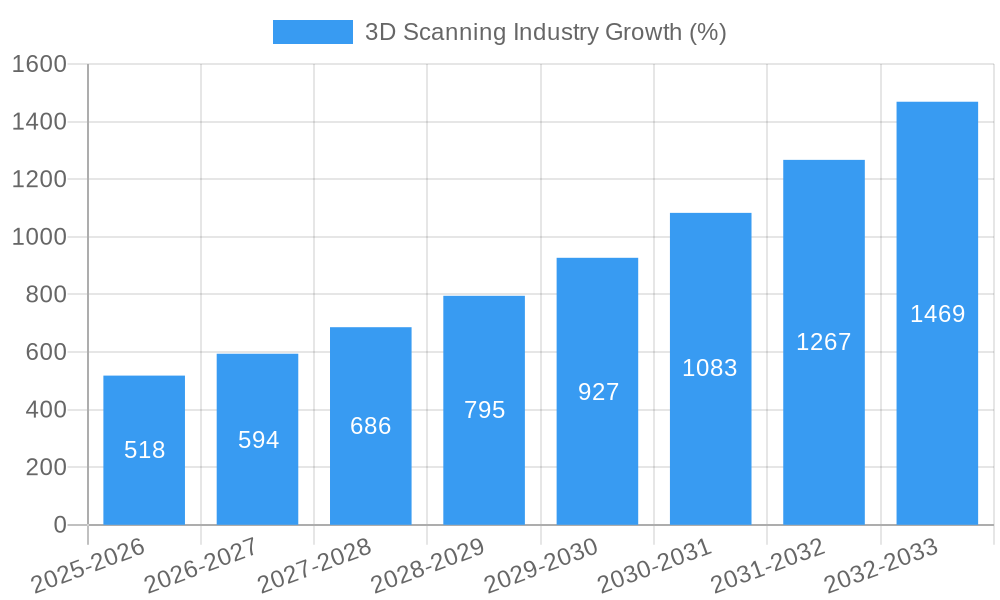
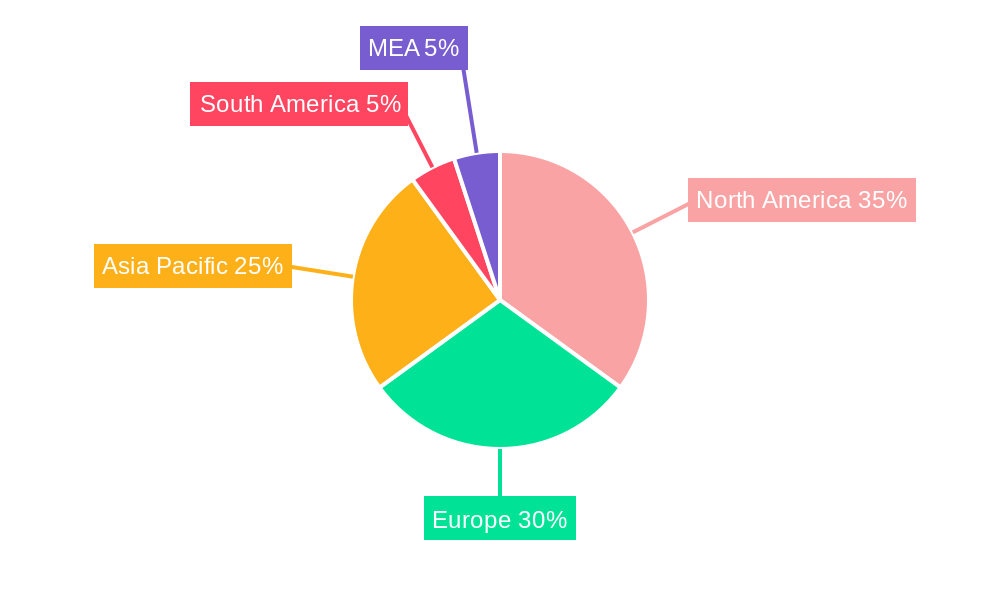
The 3D scanning market, valued at $3.56 billion in 2025, is experiencing robust growth, projected to expand at a Compound Annual Growth Rate (CAGR) of 14.98% from 2025 to 2033. This expansion is fueled by several key drivers. The increasing adoption of 3D scanning technologies across diverse sectors like automotive, aerospace, and healthcare for applications such as reverse engineering, rapid prototyping, and quality control is significantly boosting market demand. Furthermore, advancements in sensor technology, leading to higher accuracy, faster scanning speeds, and more affordable solutions, are making 3D scanning accessible to a wider range of businesses and individuals. The growing need for digital twins in manufacturing and design processes is also contributing to market growth. While data limitations prevent precise regional breakdowns, North America and Europe are expected to dominate the market initially due to established technological infrastructure and higher adoption rates. However, rapidly developing economies in Asia-Pacific are poised for significant growth in the coming years, driven by increasing industrialization and infrastructure development. The market segmentation highlights the diverse applications of 3D scanning, with hardware currently holding a larger share than software but software's share is expected to grow significantly, and the range of applications continuing to expand.
The competitive landscape is marked by both established players like Faro Technologies, Hexagon AB, and 3D Systems, and emerging innovative companies. This competition fosters innovation and drives down costs, making 3D scanning technology more accessible. While challenges such as the high initial investment costs for some advanced systems and the need for specialized skills to operate and interpret the data exist, the overall market outlook remains positive. The continuous advancements in technology, coupled with the expanding applications across numerous industries, suggest a sustained period of growth for the 3D scanning market. This will likely lead to further market consolidation and the emergence of new specialized applications, further shaping the industry's trajectory in the next decade.
This comprehensive report provides a detailed analysis of the 3D scanning industry, covering market size, segmentation, growth drivers, challenges, and key players. The study period spans 2019-2033, with a base year of 2025 and a forecast period of 2025-2033. The report offers actionable insights for industry stakeholders, investors, and businesses seeking to understand and capitalize on opportunities within this rapidly evolving market. The global market value is predicted to reach xx Million by 2033.
3D Scanning Industry Market Concentration & Innovation
The 3D scanning market is moderately concentrated, with several major players holding significant market share. Companies like Faro Technologies Inc, Hexagon AB, Artec Inc, Autodesk Inc, 3D Systems Inc, Topcon Corporation, and Trimble Inc dominate the landscape, although numerous smaller companies also compete. Market share data for 2024 estimates Faro Technologies Inc at approximately 10%, Hexagon AB at 12%, and Artec Inc at 8%, with the remaining share distributed across other key players and smaller market entrants. These companies are actively engaged in mergers and acquisitions (M&A) to expand their product portfolios and market reach. Recent M&A activity has totaled an estimated xx Million in deal value over the past five years. Innovation is a key driver, with continuous advancements in scanner technology, software, and applications. Regulatory frameworks, while not overly restrictive, influence certain aspects, such as data privacy and safety standards for specific applications like healthcare. Product substitutes, like traditional surveying methods, still exist but face growing obsolescence due to 3D scanning's speed, accuracy, and versatility. End-user trends favor increased automation, data integration, and cloud-based solutions.
- Market Concentration: Moderately concentrated with a few major players dominating.
- Innovation Drivers: Technological advancements in sensor technology, software algorithms, and data processing capabilities.
- Regulatory Frameworks: Compliance with data privacy regulations and industry-specific safety standards.
- Product Substitutes: Traditional surveying and modeling methods.
- End-User Trends: Demand for automation, data integration, and cloud-based solutions.
- M&A Activity: Significant M&A activity observed in recent years, with total deal values estimated at xx Million.
3D Scanning Industry Industry Trends & Insights
The 3D scanning industry is experiencing robust growth, driven by increasing adoption across diverse sectors. The Compound Annual Growth Rate (CAGR) from 2019 to 2024 was approximately 15%, and projections suggest a similar or slightly higher growth rate during the forecast period (2025-2033). Market penetration remains relatively high in established sectors like automotive and aerospace, but significant growth potential exists in emerging sectors, such as healthcare, construction, and even consumer applications. Technological disruptions, particularly in areas like AI-powered image processing and high-resolution sensors, are enhancing the speed, accuracy, and affordability of 3D scanning solutions. Consumer preferences are shifting towards user-friendly, portable scanners with advanced features and seamless integration with design and manufacturing workflows. Competitive dynamics are characterized by intense innovation, strategic partnerships, and ongoing efforts to differentiate offerings through improved software, higher accuracy, and greater versatility. The market penetration rate for 3D scanning in the manufacturing sector is estimated at 40% in 2025, with expectations to increase to 55% by 2033.
Dominant Markets & Segments in 3D Scanning Industry
The manufacturing sector is the dominant end-user vertical, accounting for the largest market share, followed by automotive and aerospace. Within applications, quality control/inspection and reverse engineering are the leading segments. Geographically, North America and Europe currently hold the largest market share due to established manufacturing bases and strong adoption across diverse industries. However, the Asia-Pacific region demonstrates the fastest growth rate, fueled by increasing industrialization and investment in advanced technologies.
Leading Region: North America
Leading Segment (Application): Quality Control/Inspection
Leading Segment (End-user Vertical): Manufacturing
Key Drivers (Manufacturing): Automation needs, quality control requirements, product design optimization.
Key Drivers (Asia-Pacific): Rapid industrialization, investment in advanced technologies, government support for technological advancement.
By Application: The reverse engineering segment is rapidly growing, driven by its ability to digitally replicate physical objects, facilitating the design and production of improved products or components. Rapid prototyping leverages 3D scans to create physical prototypes faster and more efficiently than traditional methods. Quality control and inspection segments are seeing significant growth due to the increased accuracy and efficiency that 3D scanning offers for defect detection and verification.
By End-user Vertical: The automotive industry is heavily reliant on 3D scanning for design validation, reverse engineering, and quality control processes. The aerospace and defense industries use 3D scanning for precise measurements and inspection of aircraft components. The healthcare industry uses 3D scanning for creating custom medical implants and prosthetics. The manufacturing industry relies on 3D scanning for creating 3D models of products, components, and parts.
By Type: Hardware dominates the market, consisting of various 3D scanner types. Software solutions, which complement the hardware, are essential for processing and analyzing the data acquired from scanning.
By Range: Short-range scanners are primarily used for scanning small objects in detail. Medium-range scanners are used for scanning larger components and objects. Long-range scanners enable the accurate capture of extremely large objects or structures.
3D Scanning Industry Product Developments
Recent product launches highlight advancements in portability, affordability, and performance. The Revopoint MINI 2, released in February 2024, offers professional-level capabilities at a consumer-friendly price point. Creaform's HandySCAN 3D MAX Series, launched in October 2023, expands the capabilities for scanning large, complex surfaces with high accuracy. These developments cater to a broader range of users and applications, driving market expansion. Technological trends focus on enhanced resolution, faster scanning speeds, improved ease of use, and wider integration capabilities with CAD/CAM software.
Report Scope & Segmentation Analysis
This report segments the 3D scanning market by application (Reverse Engineering, Rapid Prototyping, Quality Control/Inspection, Face and Body Scanning, Industrial Metrology, Digital Modeling), end-user vertical (Aerospace & Defense, Automotive, Healthcare, Manufacturing, Media & Entertainment, Architecture & Construction, Other), type (Hardware, Software), and range (Short, Medium, Long). Each segment's market size, growth projections, and competitive landscape are analyzed. The report provides detailed insights into the growth potential of each segment and the factors driving its growth.
Key Drivers of 3D Scanning Industry Growth
Several factors propel the growth of the 3D scanning industry, including the increasing demand for precise measurements in manufacturing, rapid advancements in sensor technology leading to improved accuracy and speed, and the rising adoption of 3D scanning in various sectors, such as healthcare and construction, to improve efficiency and personalization. Government initiatives to promote digitalization and technological advancement also support market expansion.
Challenges in the 3D Scanning Industry Sector
High initial investment costs for advanced 3D scanners can hinder adoption among smaller businesses. The complexity of data processing and software integration can pose challenges. Competition is intense, with continuous innovation and the emergence of new players, creating pressure to maintain cost competitiveness. Supply chain disruptions, especially regarding specialized components, can impact production and availability.
Emerging Opportunities in 3D Scanning Industry
The integration of AI and machine learning in 3D scanning opens up numerous opportunities for automation and improved data analysis. The growing demand for personalized products and services is driving growth in applications like 3D-printed prosthetics and bespoke manufacturing. Expansion into emerging markets with less market penetration presents considerable potential.
Leading Players in the 3D Scanning Industry Market
- Faro Technologies Inc
- Hexagon AB
- Artec Inc
- Autodesk Inc
- 3D Systems Inc
- Topcon Corporation
- Trimble Inc
- CREAFORM Inc
- GOM GmbH
- Maptek Pty Ltd
Key Developments in 3D Scanning Industry Industry
- October 2023: Creaform launched the HandySCAN 3D MAX Series, expanding capabilities for large-scale scanning.
- February 2024: Revopoint 3D released the MINI 2 3D scanner, offering professional-level capabilities at a more affordable price point.
Strategic Outlook for 3D Scanning Industry Market
The 3D scanning market is poised for continued expansion, driven by technological advancements, increasing adoption across diverse sectors, and the emergence of new applications. The focus on user-friendly interfaces, cloud-based solutions, and the integration of AI will further drive market growth. The potential for personalized products and services will create opportunities for significant expansion in the coming years.
3D Scanning Industry Segmentation
-
1. Type
-
1.1. Hardware
- 1.1.1. Optical Scanners
- 1.1.2. Structured Light Scanners
- 1.1.3. Laser Scanners
- 1.1.4. Other Hardware
- 1.2. Software
-
1.1. Hardware
-
2. Range
- 2.1. Short Range
- 2.2. Medium Range
- 2.3. Long Range
-
3. Application
- 3.1. Reverse Engineering
- 3.2. Rapid Prototyping
- 3.3. Quality Control/Inspection
- 3.4. Face and Body Scanning
- 3.5. Industrial Metrology
- 3.6. Digital Modeling
-
4. End-user Vertical
- 4.1. Aerospace and Defense
- 4.2. Automotive
- 4.3. Healthcare
- 4.4. Manufacturing
- 4.5. Media and Entertainment
- 4.6. Architecture and Construction
- 4.7. Other End-user Verticals
3D Scanning Industry Segmentation By Geography
- 1. North America
- 2. Europe
- 3. Asia Pacific
- 4. Latin America
- 5. Middle East and Africa
3D Scanning Industry REPORT HIGHLIGHTS
| Aspects | Details |
|---|---|
| Study Period | 2019-2033 |
| Base Year | 2024 |
| Estimated Year | 2025 |
| Forecast Period | 2025-2033 |
| Historical Period | 2019-2024 |
| Growth Rate | CAGR of 14.98% from 2019-2033 |
| Segmentation |
|
Table of Contents
- 1. Introduction
- 1.1. Research Scope
- 1.2. Market Segmentation
- 1.3. Research Methodology
- 1.4. Definitions and Assumptions
- 2. Executive Summary
- 2.1. Introduction
- 3. Market Dynamics
- 3.1. Introduction
- 3.2. Market Drivers
- 3.2.1. Significant Demand for 3D Metrology Across the Aerospace and Automobile Secto; Growth in Deployment of 3D Printers for Reconstructive Surgeries in the Healthcare Sector
- 3.3. Market Restrains
- 3.3.1. High Capital Investment Requirement
- 3.4. Market Trends
- 3.4.1. Structured-light Scanner by Hardware Type to Drive the Market Growth
- 4. Market Factor Analysis
- 4.1. Porters Five Forces
- 4.2. Supply/Value Chain
- 4.3. PESTEL analysis
- 4.4. Market Entropy
- 4.5. Patent/Trademark Analysis
- 5. Global 3D Scanning Industry Analysis, Insights and Forecast, 2019-2031
- 5.1. Market Analysis, Insights and Forecast - by Type
- 5.1.1. Hardware
- 5.1.1.1. Optical Scanners
- 5.1.1.2. Structured Light Scanners
- 5.1.1.3. Laser Scanners
- 5.1.1.4. Other Hardware
- 5.1.2. Software
- 5.1.1. Hardware
- 5.2. Market Analysis, Insights and Forecast - by Range
- 5.2.1. Short Range
- 5.2.2. Medium Range
- 5.2.3. Long Range
- 5.3. Market Analysis, Insights and Forecast - by Application
- 5.3.1. Reverse Engineering
- 5.3.2. Rapid Prototyping
- 5.3.3. Quality Control/Inspection
- 5.3.4. Face and Body Scanning
- 5.3.5. Industrial Metrology
- 5.3.6. Digital Modeling
- 5.4. Market Analysis, Insights and Forecast - by End-user Vertical
- 5.4.1. Aerospace and Defense
- 5.4.2. Automotive
- 5.4.3. Healthcare
- 5.4.4. Manufacturing
- 5.4.5. Media and Entertainment
- 5.4.6. Architecture and Construction
- 5.4.7. Other End-user Verticals
- 5.5. Market Analysis, Insights and Forecast - by Region
- 5.5.1. North America
- 5.5.2. Europe
- 5.5.3. Asia Pacific
- 5.5.4. Latin America
- 5.5.5. Middle East and Africa
- 5.1. Market Analysis, Insights and Forecast - by Type
- 6. North America 3D Scanning Industry Analysis, Insights and Forecast, 2019-2031
- 6.1. Market Analysis, Insights and Forecast - by Type
- 6.1.1. Hardware
- 6.1.1.1. Optical Scanners
- 6.1.1.2. Structured Light Scanners
- 6.1.1.3. Laser Scanners
- 6.1.1.4. Other Hardware
- 6.1.2. Software
- 6.1.1. Hardware
- 6.2. Market Analysis, Insights and Forecast - by Range
- 6.2.1. Short Range
- 6.2.2. Medium Range
- 6.2.3. Long Range
- 6.3. Market Analysis, Insights and Forecast - by Application
- 6.3.1. Reverse Engineering
- 6.3.2. Rapid Prototyping
- 6.3.3. Quality Control/Inspection
- 6.3.4. Face and Body Scanning
- 6.3.5. Industrial Metrology
- 6.3.6. Digital Modeling
- 6.4. Market Analysis, Insights and Forecast - by End-user Vertical
- 6.4.1. Aerospace and Defense
- 6.4.2. Automotive
- 6.4.3. Healthcare
- 6.4.4. Manufacturing
- 6.4.5. Media and Entertainment
- 6.4.6. Architecture and Construction
- 6.4.7. Other End-user Verticals
- 6.1. Market Analysis, Insights and Forecast - by Type
- 7. Europe 3D Scanning Industry Analysis, Insights and Forecast, 2019-2031
- 7.1. Market Analysis, Insights and Forecast - by Type
- 7.1.1. Hardware
- 7.1.1.1. Optical Scanners
- 7.1.1.2. Structured Light Scanners
- 7.1.1.3. Laser Scanners
- 7.1.1.4. Other Hardware
- 7.1.2. Software
- 7.1.1. Hardware
- 7.2. Market Analysis, Insights and Forecast - by Range
- 7.2.1. Short Range
- 7.2.2. Medium Range
- 7.2.3. Long Range
- 7.3. Market Analysis, Insights and Forecast - by Application
- 7.3.1. Reverse Engineering
- 7.3.2. Rapid Prototyping
- 7.3.3. Quality Control/Inspection
- 7.3.4. Face and Body Scanning
- 7.3.5. Industrial Metrology
- 7.3.6. Digital Modeling
- 7.4. Market Analysis, Insights and Forecast - by End-user Vertical
- 7.4.1. Aerospace and Defense
- 7.4.2. Automotive
- 7.4.3. Healthcare
- 7.4.4. Manufacturing
- 7.4.5. Media and Entertainment
- 7.4.6. Architecture and Construction
- 7.4.7. Other End-user Verticals
- 7.1. Market Analysis, Insights and Forecast - by Type
- 8. Asia Pacific 3D Scanning Industry Analysis, Insights and Forecast, 2019-2031
- 8.1. Market Analysis, Insights and Forecast - by Type
- 8.1.1. Hardware
- 8.1.1.1. Optical Scanners
- 8.1.1.2. Structured Light Scanners
- 8.1.1.3. Laser Scanners
- 8.1.1.4. Other Hardware
- 8.1.2. Software
- 8.1.1. Hardware
- 8.2. Market Analysis, Insights and Forecast - by Range
- 8.2.1. Short Range
- 8.2.2. Medium Range
- 8.2.3. Long Range
- 8.3. Market Analysis, Insights and Forecast - by Application
- 8.3.1. Reverse Engineering
- 8.3.2. Rapid Prototyping
- 8.3.3. Quality Control/Inspection
- 8.3.4. Face and Body Scanning
- 8.3.5. Industrial Metrology
- 8.3.6. Digital Modeling
- 8.4. Market Analysis, Insights and Forecast - by End-user Vertical
- 8.4.1. Aerospace and Defense
- 8.4.2. Automotive
- 8.4.3. Healthcare
- 8.4.4. Manufacturing
- 8.4.5. Media and Entertainment
- 8.4.6. Architecture and Construction
- 8.4.7. Other End-user Verticals
- 8.1. Market Analysis, Insights and Forecast - by Type
- 9. Latin America 3D Scanning Industry Analysis, Insights and Forecast, 2019-2031
- 9.1. Market Analysis, Insights and Forecast - by Type
- 9.1.1. Hardware
- 9.1.1.1. Optical Scanners
- 9.1.1.2. Structured Light Scanners
- 9.1.1.3. Laser Scanners
- 9.1.1.4. Other Hardware
- 9.1.2. Software
- 9.1.1. Hardware
- 9.2. Market Analysis, Insights and Forecast - by Range
- 9.2.1. Short Range
- 9.2.2. Medium Range
- 9.2.3. Long Range
- 9.3. Market Analysis, Insights and Forecast - by Application
- 9.3.1. Reverse Engineering
- 9.3.2. Rapid Prototyping
- 9.3.3. Quality Control/Inspection
- 9.3.4. Face and Body Scanning
- 9.3.5. Industrial Metrology
- 9.3.6. Digital Modeling
- 9.4. Market Analysis, Insights and Forecast - by End-user Vertical
- 9.4.1. Aerospace and Defense
- 9.4.2. Automotive
- 9.4.3. Healthcare
- 9.4.4. Manufacturing
- 9.4.5. Media and Entertainment
- 9.4.6. Architecture and Construction
- 9.4.7. Other End-user Verticals
- 9.1. Market Analysis, Insights and Forecast - by Type
- 10. Middle East and Africa 3D Scanning Industry Analysis, Insights and Forecast, 2019-2031
- 10.1. Market Analysis, Insights and Forecast - by Type
- 10.1.1. Hardware
- 10.1.1.1. Optical Scanners
- 10.1.1.2. Structured Light Scanners
- 10.1.1.3. Laser Scanners
- 10.1.1.4. Other Hardware
- 10.1.2. Software
- 10.1.1. Hardware
- 10.2. Market Analysis, Insights and Forecast - by Range
- 10.2.1. Short Range
- 10.2.2. Medium Range
- 10.2.3. Long Range
- 10.3. Market Analysis, Insights and Forecast - by Application
- 10.3.1. Reverse Engineering
- 10.3.2. Rapid Prototyping
- 10.3.3. Quality Control/Inspection
- 10.3.4. Face and Body Scanning
- 10.3.5. Industrial Metrology
- 10.3.6. Digital Modeling
- 10.4. Market Analysis, Insights and Forecast - by End-user Vertical
- 10.4.1. Aerospace and Defense
- 10.4.2. Automotive
- 10.4.3. Healthcare
- 10.4.4. Manufacturing
- 10.4.5. Media and Entertainment
- 10.4.6. Architecture and Construction
- 10.4.7. Other End-user Verticals
- 10.1. Market Analysis, Insights and Forecast - by Type
- 11. North America 3D Scanning Industry Analysis, Insights and Forecast, 2019-2031
- 11.1. Market Analysis, Insights and Forecast - By Country/Sub-region
- 11.1.1 United States
- 11.1.2 Canada
- 11.1.3 Mexico
- 12. Europe 3D Scanning Industry Analysis, Insights and Forecast, 2019-2031
- 12.1. Market Analysis, Insights and Forecast - By Country/Sub-region
- 12.1.1 Germany
- 12.1.2 United Kingdom
- 12.1.3 France
- 12.1.4 Spain
- 12.1.5 Italy
- 12.1.6 Spain
- 12.1.7 Belgium
- 12.1.8 Netherland
- 12.1.9 Nordics
- 12.1.10 Rest of Europe
- 13. Asia Pacific 3D Scanning Industry Analysis, Insights and Forecast, 2019-2031
- 13.1. Market Analysis, Insights and Forecast - By Country/Sub-region
- 13.1.1 China
- 13.1.2 Japan
- 13.1.3 India
- 13.1.4 South Korea
- 13.1.5 Southeast Asia
- 13.1.6 Australia
- 13.1.7 Indonesia
- 13.1.8 Phillipes
- 13.1.9 Singapore
- 13.1.10 Thailandc
- 13.1.11 Rest of Asia Pacific
- 14. South America 3D Scanning Industry Analysis, Insights and Forecast, 2019-2031
- 14.1. Market Analysis, Insights and Forecast - By Country/Sub-region
- 14.1.1 Brazil
- 14.1.2 Argentina
- 14.1.3 Peru
- 14.1.4 Chile
- 14.1.5 Colombia
- 14.1.6 Ecuador
- 14.1.7 Venezuela
- 14.1.8 Rest of South America
- 15. North America 3D Scanning Industry Analysis, Insights and Forecast, 2019-2031
- 15.1. Market Analysis, Insights and Forecast - By Country/Sub-region
- 15.1.1 United States
- 15.1.2 Canada
- 15.1.3 Mexico
- 16. MEA 3D Scanning Industry Analysis, Insights and Forecast, 2019-2031
- 16.1. Market Analysis, Insights and Forecast - By Country/Sub-region
- 16.1.1 United Arab Emirates
- 16.1.2 Saudi Arabia
- 16.1.3 South Africa
- 16.1.4 Rest of Middle East and Africa
- 17. Competitive Analysis
- 17.1. Global Market Share Analysis 2024
- 17.2. Company Profiles
- 17.2.1 Faro Technologies Inc
- 17.2.1.1. Overview
- 17.2.1.2. Products
- 17.2.1.3. SWOT Analysis
- 17.2.1.4. Recent Developments
- 17.2.1.5. Financials (Based on Availability)
- 17.2.2 Hexagon AB
- 17.2.2.1. Overview
- 17.2.2.2. Products
- 17.2.2.3. SWOT Analysis
- 17.2.2.4. Recent Developments
- 17.2.2.5. Financials (Based on Availability)
- 17.2.3 Artec Inc
- 17.2.3.1. Overview
- 17.2.3.2. Products
- 17.2.3.3. SWOT Analysis
- 17.2.3.4. Recent Developments
- 17.2.3.5. Financials (Based on Availability)
- 17.2.4 Autodesk Inc
- 17.2.4.1. Overview
- 17.2.4.2. Products
- 17.2.4.3. SWOT Analysis
- 17.2.4.4. Recent Developments
- 17.2.4.5. Financials (Based on Availability)
- 17.2.5 3D Systems Inc
- 17.2.5.1. Overview
- 17.2.5.2. Products
- 17.2.5.3. SWOT Analysis
- 17.2.5.4. Recent Developments
- 17.2.5.5. Financials (Based on Availability)
- 17.2.6 Topcon Corporation
- 17.2.6.1. Overview
- 17.2.6.2. Products
- 17.2.6.3. SWOT Analysis
- 17.2.6.4. Recent Developments
- 17.2.6.5. Financials (Based on Availability)
- 17.2.7 Trimble Inc *List Not Exhaustive
- 17.2.7.1. Overview
- 17.2.7.2. Products
- 17.2.7.3. SWOT Analysis
- 17.2.7.4. Recent Developments
- 17.2.7.5. Financials (Based on Availability)
- 17.2.8 CREAFORM Inc
- 17.2.8.1. Overview
- 17.2.8.2. Products
- 17.2.8.3. SWOT Analysis
- 17.2.8.4. Recent Developments
- 17.2.8.5. Financials (Based on Availability)
- 17.2.9 GOM GmbH
- 17.2.9.1. Overview
- 17.2.9.2. Products
- 17.2.9.3. SWOT Analysis
- 17.2.9.4. Recent Developments
- 17.2.9.5. Financials (Based on Availability)
- 17.2.10 Maptek Pty Ltd
- 17.2.10.1. Overview
- 17.2.10.2. Products
- 17.2.10.3. SWOT Analysis
- 17.2.10.4. Recent Developments
- 17.2.10.5. Financials (Based on Availability)
- 17.2.1 Faro Technologies Inc
List of Figures
- Figure 1: Global 3D Scanning Industry Revenue Breakdown (Million, %) by Region 2024 & 2032
- Figure 2: North America 3D Scanning Industry Revenue (Million), by Country 2024 & 2032
- Figure 3: North America 3D Scanning Industry Revenue Share (%), by Country 2024 & 2032
- Figure 4: Europe 3D Scanning Industry Revenue (Million), by Country 2024 & 2032
- Figure 5: Europe 3D Scanning Industry Revenue Share (%), by Country 2024 & 2032
- Figure 6: Asia Pacific 3D Scanning Industry Revenue (Million), by Country 2024 & 2032
- Figure 7: Asia Pacific 3D Scanning Industry Revenue Share (%), by Country 2024 & 2032
- Figure 8: South America 3D Scanning Industry Revenue (Million), by Country 2024 & 2032
- Figure 9: South America 3D Scanning Industry Revenue Share (%), by Country 2024 & 2032
- Figure 10: North America 3D Scanning Industry Revenue (Million), by Country 2024 & 2032
- Figure 11: North America 3D Scanning Industry Revenue Share (%), by Country 2024 & 2032
- Figure 12: MEA 3D Scanning Industry Revenue (Million), by Country 2024 & 2032
- Figure 13: MEA 3D Scanning Industry Revenue Share (%), by Country 2024 & 2032
- Figure 14: North America 3D Scanning Industry Revenue (Million), by Type 2024 & 2032
- Figure 15: North America 3D Scanning Industry Revenue Share (%), by Type 2024 & 2032
- Figure 16: North America 3D Scanning Industry Revenue (Million), by Range 2024 & 2032
- Figure 17: North America 3D Scanning Industry Revenue Share (%), by Range 2024 & 2032
- Figure 18: North America 3D Scanning Industry Revenue (Million), by Application 2024 & 2032
- Figure 19: North America 3D Scanning Industry Revenue Share (%), by Application 2024 & 2032
- Figure 20: North America 3D Scanning Industry Revenue (Million), by End-user Vertical 2024 & 2032
- Figure 21: North America 3D Scanning Industry Revenue Share (%), by End-user Vertical 2024 & 2032
- Figure 22: North America 3D Scanning Industry Revenue (Million), by Country 2024 & 2032
- Figure 23: North America 3D Scanning Industry Revenue Share (%), by Country 2024 & 2032
- Figure 24: Europe 3D Scanning Industry Revenue (Million), by Type 2024 & 2032
- Figure 25: Europe 3D Scanning Industry Revenue Share (%), by Type 2024 & 2032
- Figure 26: Europe 3D Scanning Industry Revenue (Million), by Range 2024 & 2032
- Figure 27: Europe 3D Scanning Industry Revenue Share (%), by Range 2024 & 2032
- Figure 28: Europe 3D Scanning Industry Revenue (Million), by Application 2024 & 2032
- Figure 29: Europe 3D Scanning Industry Revenue Share (%), by Application 2024 & 2032
- Figure 30: Europe 3D Scanning Industry Revenue (Million), by End-user Vertical 2024 & 2032
- Figure 31: Europe 3D Scanning Industry Revenue Share (%), by End-user Vertical 2024 & 2032
- Figure 32: Europe 3D Scanning Industry Revenue (Million), by Country 2024 & 2032
- Figure 33: Europe 3D Scanning Industry Revenue Share (%), by Country 2024 & 2032
- Figure 34: Asia Pacific 3D Scanning Industry Revenue (Million), by Type 2024 & 2032
- Figure 35: Asia Pacific 3D Scanning Industry Revenue Share (%), by Type 2024 & 2032
- Figure 36: Asia Pacific 3D Scanning Industry Revenue (Million), by Range 2024 & 2032
- Figure 37: Asia Pacific 3D Scanning Industry Revenue Share (%), by Range 2024 & 2032
- Figure 38: Asia Pacific 3D Scanning Industry Revenue (Million), by Application 2024 & 2032
- Figure 39: Asia Pacific 3D Scanning Industry Revenue Share (%), by Application 2024 & 2032
- Figure 40: Asia Pacific 3D Scanning Industry Revenue (Million), by End-user Vertical 2024 & 2032
- Figure 41: Asia Pacific 3D Scanning Industry Revenue Share (%), by End-user Vertical 2024 & 2032
- Figure 42: Asia Pacific 3D Scanning Industry Revenue (Million), by Country 2024 & 2032
- Figure 43: Asia Pacific 3D Scanning Industry Revenue Share (%), by Country 2024 & 2032
- Figure 44: Latin America 3D Scanning Industry Revenue (Million), by Type 2024 & 2032
- Figure 45: Latin America 3D Scanning Industry Revenue Share (%), by Type 2024 & 2032
- Figure 46: Latin America 3D Scanning Industry Revenue (Million), by Range 2024 & 2032
- Figure 47: Latin America 3D Scanning Industry Revenue Share (%), by Range 2024 & 2032
- Figure 48: Latin America 3D Scanning Industry Revenue (Million), by Application 2024 & 2032
- Figure 49: Latin America 3D Scanning Industry Revenue Share (%), by Application 2024 & 2032
- Figure 50: Latin America 3D Scanning Industry Revenue (Million), by End-user Vertical 2024 & 2032
- Figure 51: Latin America 3D Scanning Industry Revenue Share (%), by End-user Vertical 2024 & 2032
- Figure 52: Latin America 3D Scanning Industry Revenue (Million), by Country 2024 & 2032
- Figure 53: Latin America 3D Scanning Industry Revenue Share (%), by Country 2024 & 2032
- Figure 54: Middle East and Africa 3D Scanning Industry Revenue (Million), by Type 2024 & 2032
- Figure 55: Middle East and Africa 3D Scanning Industry Revenue Share (%), by Type 2024 & 2032
- Figure 56: Middle East and Africa 3D Scanning Industry Revenue (Million), by Range 2024 & 2032
- Figure 57: Middle East and Africa 3D Scanning Industry Revenue Share (%), by Range 2024 & 2032
- Figure 58: Middle East and Africa 3D Scanning Industry Revenue (Million), by Application 2024 & 2032
- Figure 59: Middle East and Africa 3D Scanning Industry Revenue Share (%), by Application 2024 & 2032
- Figure 60: Middle East and Africa 3D Scanning Industry Revenue (Million), by End-user Vertical 2024 & 2032
- Figure 61: Middle East and Africa 3D Scanning Industry Revenue Share (%), by End-user Vertical 2024 & 2032
- Figure 62: Middle East and Africa 3D Scanning Industry Revenue (Million), by Country 2024 & 2032
- Figure 63: Middle East and Africa 3D Scanning Industry Revenue Share (%), by Country 2024 & 2032
List of Tables
- Table 1: Global 3D Scanning Industry Revenue Million Forecast, by Region 2019 & 2032
- Table 2: Global 3D Scanning Industry Revenue Million Forecast, by Type 2019 & 2032
- Table 3: Global 3D Scanning Industry Revenue Million Forecast, by Range 2019 & 2032
- Table 4: Global 3D Scanning Industry Revenue Million Forecast, by Application 2019 & 2032
- Table 5: Global 3D Scanning Industry Revenue Million Forecast, by End-user Vertical 2019 & 2032
- Table 6: Global 3D Scanning Industry Revenue Million Forecast, by Region 2019 & 2032
- Table 7: Global 3D Scanning Industry Revenue Million Forecast, by Country 2019 & 2032
- Table 8: United States 3D Scanning Industry Revenue (Million) Forecast, by Application 2019 & 2032
- Table 9: Canada 3D Scanning Industry Revenue (Million) Forecast, by Application 2019 & 2032
- Table 10: Mexico 3D Scanning Industry Revenue (Million) Forecast, by Application 2019 & 2032
- Table 11: Global 3D Scanning Industry Revenue Million Forecast, by Country 2019 & 2032
- Table 12: Germany 3D Scanning Industry Revenue (Million) Forecast, by Application 2019 & 2032
- Table 13: United Kingdom 3D Scanning Industry Revenue (Million) Forecast, by Application 2019 & 2032
- Table 14: France 3D Scanning Industry Revenue (Million) Forecast, by Application 2019 & 2032
- Table 15: Spain 3D Scanning Industry Revenue (Million) Forecast, by Application 2019 & 2032
- Table 16: Italy 3D Scanning Industry Revenue (Million) Forecast, by Application 2019 & 2032
- Table 17: Spain 3D Scanning Industry Revenue (Million) Forecast, by Application 2019 & 2032
- Table 18: Belgium 3D Scanning Industry Revenue (Million) Forecast, by Application 2019 & 2032
- Table 19: Netherland 3D Scanning Industry Revenue (Million) Forecast, by Application 2019 & 2032
- Table 20: Nordics 3D Scanning Industry Revenue (Million) Forecast, by Application 2019 & 2032
- Table 21: Rest of Europe 3D Scanning Industry Revenue (Million) Forecast, by Application 2019 & 2032
- Table 22: Global 3D Scanning Industry Revenue Million Forecast, by Country 2019 & 2032
- Table 23: China 3D Scanning Industry Revenue (Million) Forecast, by Application 2019 & 2032
- Table 24: Japan 3D Scanning Industry Revenue (Million) Forecast, by Application 2019 & 2032
- Table 25: India 3D Scanning Industry Revenue (Million) Forecast, by Application 2019 & 2032
- Table 26: South Korea 3D Scanning Industry Revenue (Million) Forecast, by Application 2019 & 2032
- Table 27: Southeast Asia 3D Scanning Industry Revenue (Million) Forecast, by Application 2019 & 2032
- Table 28: Australia 3D Scanning Industry Revenue (Million) Forecast, by Application 2019 & 2032
- Table 29: Indonesia 3D Scanning Industry Revenue (Million) Forecast, by Application 2019 & 2032
- Table 30: Phillipes 3D Scanning Industry Revenue (Million) Forecast, by Application 2019 & 2032
- Table 31: Singapore 3D Scanning Industry Revenue (Million) Forecast, by Application 2019 & 2032
- Table 32: Thailandc 3D Scanning Industry Revenue (Million) Forecast, by Application 2019 & 2032
- Table 33: Rest of Asia Pacific 3D Scanning Industry Revenue (Million) Forecast, by Application 2019 & 2032
- Table 34: Global 3D Scanning Industry Revenue Million Forecast, by Country 2019 & 2032
- Table 35: Brazil 3D Scanning Industry Revenue (Million) Forecast, by Application 2019 & 2032
- Table 36: Argentina 3D Scanning Industry Revenue (Million) Forecast, by Application 2019 & 2032
- Table 37: Peru 3D Scanning Industry Revenue (Million) Forecast, by Application 2019 & 2032
- Table 38: Chile 3D Scanning Industry Revenue (Million) Forecast, by Application 2019 & 2032
- Table 39: Colombia 3D Scanning Industry Revenue (Million) Forecast, by Application 2019 & 2032
- Table 40: Ecuador 3D Scanning Industry Revenue (Million) Forecast, by Application 2019 & 2032
- Table 41: Venezuela 3D Scanning Industry Revenue (Million) Forecast, by Application 2019 & 2032
- Table 42: Rest of South America 3D Scanning Industry Revenue (Million) Forecast, by Application 2019 & 2032
- Table 43: Global 3D Scanning Industry Revenue Million Forecast, by Country 2019 & 2032
- Table 44: United States 3D Scanning Industry Revenue (Million) Forecast, by Application 2019 & 2032
- Table 45: Canada 3D Scanning Industry Revenue (Million) Forecast, by Application 2019 & 2032
- Table 46: Mexico 3D Scanning Industry Revenue (Million) Forecast, by Application 2019 & 2032
- Table 47: Global 3D Scanning Industry Revenue Million Forecast, by Country 2019 & 2032
- Table 48: United Arab Emirates 3D Scanning Industry Revenue (Million) Forecast, by Application 2019 & 2032
- Table 49: Saudi Arabia 3D Scanning Industry Revenue (Million) Forecast, by Application 2019 & 2032
- Table 50: South Africa 3D Scanning Industry Revenue (Million) Forecast, by Application 2019 & 2032
- Table 51: Rest of Middle East and Africa 3D Scanning Industry Revenue (Million) Forecast, by Application 2019 & 2032
- Table 52: Global 3D Scanning Industry Revenue Million Forecast, by Type 2019 & 2032
- Table 53: Global 3D Scanning Industry Revenue Million Forecast, by Range 2019 & 2032
- Table 54: Global 3D Scanning Industry Revenue Million Forecast, by Application 2019 & 2032
- Table 55: Global 3D Scanning Industry Revenue Million Forecast, by End-user Vertical 2019 & 2032
- Table 56: Global 3D Scanning Industry Revenue Million Forecast, by Country 2019 & 2032
- Table 57: Global 3D Scanning Industry Revenue Million Forecast, by Type 2019 & 2032
- Table 58: Global 3D Scanning Industry Revenue Million Forecast, by Range 2019 & 2032
- Table 59: Global 3D Scanning Industry Revenue Million Forecast, by Application 2019 & 2032
- Table 60: Global 3D Scanning Industry Revenue Million Forecast, by End-user Vertical 2019 & 2032
- Table 61: Global 3D Scanning Industry Revenue Million Forecast, by Country 2019 & 2032
- Table 62: Global 3D Scanning Industry Revenue Million Forecast, by Type 2019 & 2032
- Table 63: Global 3D Scanning Industry Revenue Million Forecast, by Range 2019 & 2032
- Table 64: Global 3D Scanning Industry Revenue Million Forecast, by Application 2019 & 2032
- Table 65: Global 3D Scanning Industry Revenue Million Forecast, by End-user Vertical 2019 & 2032
- Table 66: Global 3D Scanning Industry Revenue Million Forecast, by Country 2019 & 2032
- Table 67: Global 3D Scanning Industry Revenue Million Forecast, by Type 2019 & 2032
- Table 68: Global 3D Scanning Industry Revenue Million Forecast, by Range 2019 & 2032
- Table 69: Global 3D Scanning Industry Revenue Million Forecast, by Application 2019 & 2032
- Table 70: Global 3D Scanning Industry Revenue Million Forecast, by End-user Vertical 2019 & 2032
- Table 71: Global 3D Scanning Industry Revenue Million Forecast, by Country 2019 & 2032
- Table 72: Global 3D Scanning Industry Revenue Million Forecast, by Type 2019 & 2032
- Table 73: Global 3D Scanning Industry Revenue Million Forecast, by Range 2019 & 2032
- Table 74: Global 3D Scanning Industry Revenue Million Forecast, by Application 2019 & 2032
- Table 75: Global 3D Scanning Industry Revenue Million Forecast, by End-user Vertical 2019 & 2032
- Table 76: Global 3D Scanning Industry Revenue Million Forecast, by Country 2019 & 2032
Frequently Asked Questions
1. What is the projected Compound Annual Growth Rate (CAGR) of the 3D Scanning Industry?
The projected CAGR is approximately 14.98%.
2. Which companies are prominent players in the 3D Scanning Industry?
Key companies in the market include Faro Technologies Inc, Hexagon AB, Artec Inc, Autodesk Inc, 3D Systems Inc, Topcon Corporation, Trimble Inc *List Not Exhaustive, CREAFORM Inc, GOM GmbH, Maptek Pty Ltd.
3. What are the main segments of the 3D Scanning Industry?
The market segments include Type, Range, Application, End-user Vertical.
4. Can you provide details about the market size?
The market size is estimated to be USD 3.56 Million as of 2022.
5. What are some drivers contributing to market growth?
Significant Demand for 3D Metrology Across the Aerospace and Automobile Secto; Growth in Deployment of 3D Printers for Reconstructive Surgeries in the Healthcare Sector.
6. What are the notable trends driving market growth?
Structured-light Scanner by Hardware Type to Drive the Market Growth.
7. Are there any restraints impacting market growth?
High Capital Investment Requirement.
8. Can you provide examples of recent developments in the market?
February 2024 - Revopoint 3D released the MINI 2 3D scanner. It is the latest iteration of the MINI 3D scanners series. The updated Revopoint MINI 2 3D scanner provides professional-level ultra-detailed small object scanning capabilities at an affordable price for consumers and small businesses that need a time-saving tool for reverse engineering, quality control, design, and more applications.
9. What pricing options are available for accessing the report?
Pricing options include single-user, multi-user, and enterprise licenses priced at USD 4750, USD 5250, and USD 8750 respectively.
10. Is the market size provided in terms of value or volume?
The market size is provided in terms of value, measured in Million.
11. Are there any specific market keywords associated with the report?
Yes, the market keyword associated with the report is "3D Scanning Industry," which aids in identifying and referencing the specific market segment covered.
12. How do I determine which pricing option suits my needs best?
The pricing options vary based on user requirements and access needs. Individual users may opt for single-user licenses, while businesses requiring broader access may choose multi-user or enterprise licenses for cost-effective access to the report.
13. Are there any additional resources or data provided in the 3D Scanning Industry report?
While the report offers comprehensive insights, it's advisable to review the specific contents or supplementary materials provided to ascertain if additional resources or data are available.
14. How can I stay updated on further developments or reports in the 3D Scanning Industry?
To stay informed about further developments, trends, and reports in the 3D Scanning Industry, consider subscribing to industry newsletters, following relevant companies and organizations, or regularly checking reputable industry news sources and publications.
Methodology
Step 1 - Identification of Relevant Samples Size from Population Database


Step 2 - Approaches for Defining Global Market Size (Value, Volume* & Price*)

Note*: In applicable scenarios
Step 3 - Data Sources
Primary Research
- Web Analytics
- Survey Reports
- Research Institute
- Latest Research Reports
- Opinion Leaders
Secondary Research
- Annual Reports
- White Paper
- Latest Press Release
- Industry Association
- Paid Database
- Investor Presentations

Step 4 - Data Triangulation
Involves using different sources of information in order to increase the validity of a study
These sources are likely to be stakeholders in a program - participants, other researchers, program staff, other community members, and so on.
Then we put all data in single framework & apply various statistical tools to find out the dynamic on the market.
During the analysis stage, feedback from the stakeholder groups would be compared to determine areas of agreement as well as areas of divergence


