
Key Insights
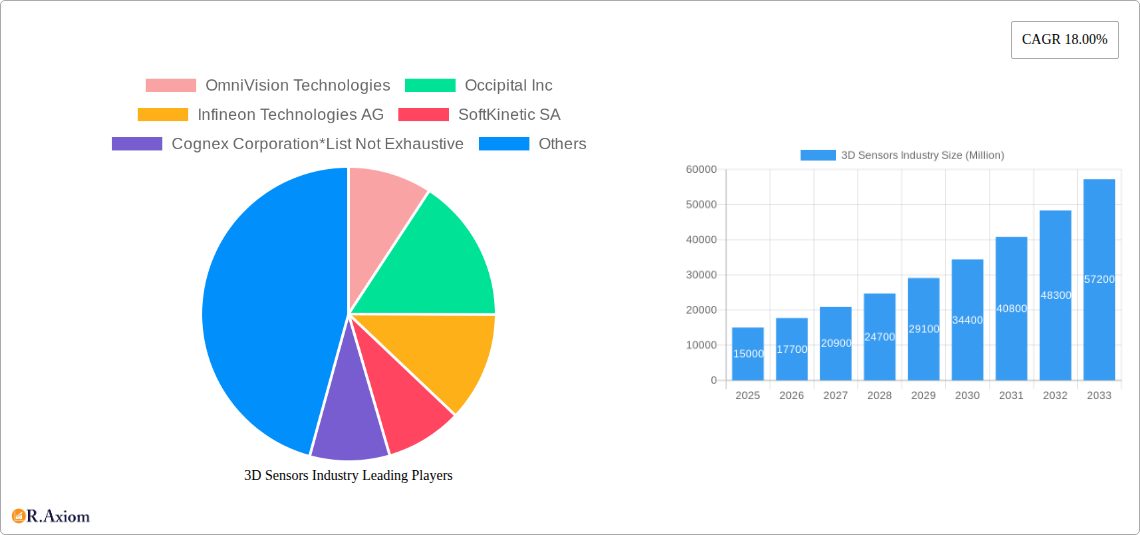
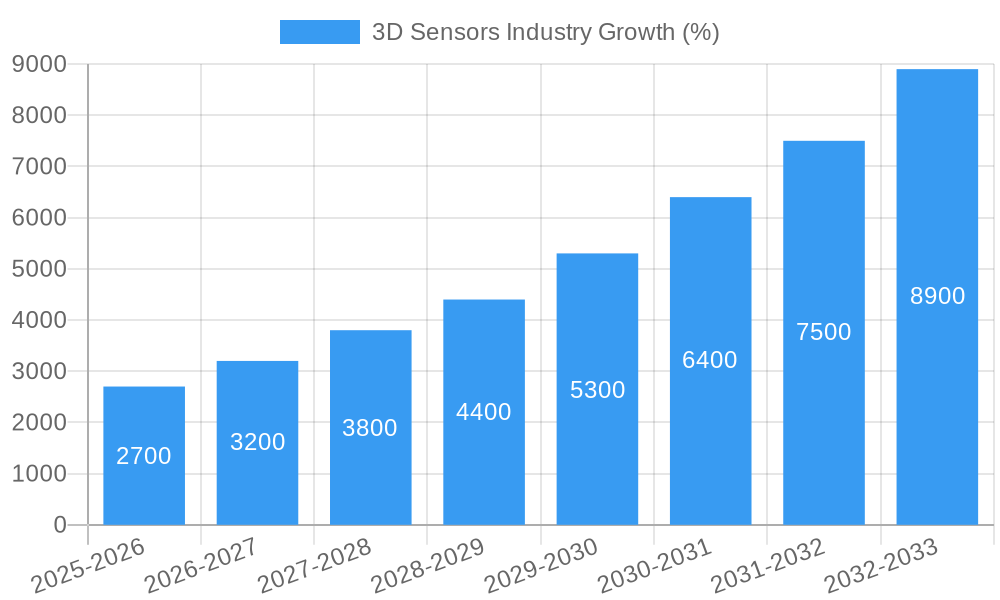
The 3D sensor market is experiencing robust growth, projected to reach a significant size within the forecast period (2025-2033). A compound annual growth rate (CAGR) of 18% indicates substantial expansion driven by several key factors. The increasing adoption of 3D sensing technology across diverse sectors, including consumer electronics (driven by the popularity of smartphones with advanced facial recognition and augmented reality features), automotive (for advanced driver-assistance systems (ADAS) and autonomous driving functionalities), and healthcare (for medical imaging and diagnostics), fuels this expansion. Technological advancements, particularly in areas like Time-of-Flight (ToF) and structured light technologies, are improving sensor accuracy, resolution, and cost-effectiveness, making them more accessible to a wider range of applications. Furthermore, miniaturization and power efficiency improvements are enabling integration into smaller and more portable devices. While challenges remain, such as the high initial cost of some 3D sensor technologies and the need for further standardization, the overall market trajectory remains positive.
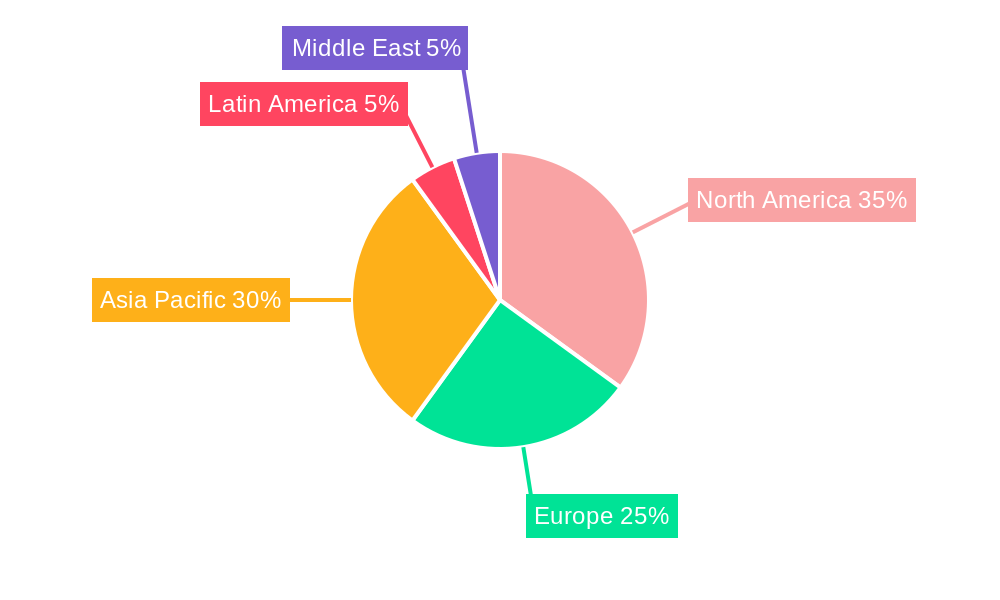
The market segmentation reveals a dynamic landscape. Among technologies, Time-of-Flight sensors are gaining traction due to their improved performance and cost-effectiveness compared to older technologies like structured light. The automotive sector is predicted to be a major driver of market growth, with the increasing demand for advanced safety features in vehicles. Within the product segment, position sensors and image sensors dominate, though the increasing adoption of other sensors, such as accelerometers and temperature sensors, coupled with advancements in multi-sensor fusion, presents a significant growth opportunity. Geographically, North America and Asia-Pacific are expected to lead the market, fueled by strong technological innovation and substantial consumer electronics production in these regions. Established players like OmniVision Technologies, Infineon Technologies, and Intel, along with emerging innovative companies, are shaping the competitive landscape, fostering continuous improvement and market evolution.
This comprehensive report provides an in-depth analysis of the 3D sensors industry, covering market size, growth projections, key players, technological advancements, and future trends. The study period spans from 2019 to 2033, with 2025 serving as the base and estimated year. The report is essential for industry stakeholders, investors, and anyone seeking to understand the dynamics of this rapidly evolving market. The global market value is projected to reach xx Million by 2033.
3D Sensors Industry Market Concentration & Innovation
The 3D sensors market exhibits a moderately concentrated landscape, with several key players holding significant market share. While precise market share figures for individual companies are proprietary, leading players such as OmniVision Technologies, Infineon Technologies AG, Cognex Corporation, Sick AG, and Panasonic Corporation account for a substantial portion of the market revenue. However, the presence of numerous smaller, specialized companies fosters competition and innovation.
Mergers and acquisitions (M&A) activity has been a significant factor in shaping the industry's competitive landscape. While precise deal values are often confidential, M&A activity has primarily focused on expanding product portfolios, accessing new technologies, and strengthening market presence in key segments. For example, the acquisition of smaller technology firms by larger players allows for integration of specialized sensor technologies and expansion into new applications.
The industry is characterized by continuous innovation, driven by advancements in semiconductor technology, improved algorithms for data processing, and increasing demand for higher resolution and accuracy. Regulatory frameworks, particularly those related to data privacy and safety, impact the design and implementation of 3D sensor systems. Furthermore, the industry witnesses the emergence of product substitutes, such as improved 2D imaging techniques, that exert competitive pressure. End-user trends, particularly in automation, robotics, and healthcare, are significantly influencing the demand for specific types of 3D sensors.
3D Sensors Industry Industry Trends & Insights
The 3D sensors market is experiencing robust growth, driven by several key factors. Technological advancements in Time-of-Flight (ToF) and structured light technologies have enabled the development of more accurate, cost-effective, and energy-efficient sensors. The increasing adoption of 3D sensors across various end-user verticals, including consumer electronics (smartphones, tablets, AR/VR devices), automotive (advanced driver-assistance systems (ADAS), autonomous driving), and healthcare (medical imaging, robotic surgery), is fueling market expansion. The compound annual growth rate (CAGR) for the period 2025-2033 is estimated to be xx%, indicating substantial growth potential. Market penetration is expected to increase significantly, with 3D sensors becoming increasingly integrated into everyday devices and systems. Competitive dynamics are shaped by factors such as pricing strategies, technological capabilities, and brand recognition. Consumer preferences are shifting towards higher resolution, smaller form factor, and improved power efficiency in 3D sensors. The increasing demand for advanced features and functionalities is driving the development of sophisticated 3D sensor technologies.
Dominant Markets & Segments in 3D Sensors Industry
Leading Region/Country: The Asia-Pacific region, particularly China and Japan, is currently the dominant market for 3D sensors, driven by rapid growth in consumer electronics and automotive industries. Key drivers include robust economic growth, increasing consumer spending, and government initiatives promoting technological advancement.
By Technology: Time-of-Flight (ToF) technology holds a significant market share due to its cost-effectiveness and suitability for various applications. Structured light technology is also witnessing strong growth, driven by its high accuracy and suitability for demanding applications. Ultrasound technology, though a smaller segment, is gaining traction in specific applications such as automotive parking assistance and robotics.
By End User Vertical: The automotive industry is a major driver of 3D sensor demand, fueled by the growing adoption of ADAS and autonomous driving technologies. The consumer electronics sector also plays a crucial role, driven by the increasing integration of 3D sensors in smartphones, tablets, and AR/VR devices. Healthcare is an emerging segment, with 3D sensors finding applications in medical imaging, robotics, and diagnostics.
By Product: Image sensors dominate the market due to their widespread use in various applications. Position sensors and accelerometer sensors are also important segments with significant growth potential. The market for temperature sensors within the 3D sensor category is a relatively niche but growing segment.
3D Sensors Industry Product Developments
Recent years have witnessed significant innovation in 3D sensor technology. Developments include advancements in sensor resolution, miniaturization, and power efficiency. The integration of advanced processing capabilities directly within the sensors has improved speed and reduced reliance on external processing units. New applications such as gesture recognition, 3D mapping, and advanced robotics are expanding the market for 3D sensors. These advancements are enhancing the competitive advantages of sensor manufacturers, leading to improved product performance, lower costs, and enhanced market penetration.
Report Scope & Segmentation Analysis
This report segments the 3D sensors market by technology (Ultrasound, Structured Light, Time of Flight, Other Technologies), end-user vertical (Consumer Electronics, Automotive, Healthcare, Other End User Verticals), and product type (Position Sensor, Image Sensor, Temperature Sensor, Accelerometer Sensor, Other Products). Each segment's market size, growth projections, and competitive dynamics are analyzed in detail. For example, the Time-of-Flight segment is expected to witness significant growth due to its cost-effectiveness and wide range of applications. Similarly, the automotive segment is expected to experience substantial growth owing to the increasing integration of ADAS and autonomous driving features. The report also examines the dynamics between different segments, highlighting their interdependencies and opportunities for synergistic growth.
Key Drivers of 3D Sensors Industry Growth
Several key factors are driving the growth of the 3D sensors industry. Technological advancements in sensor technologies like ToF and structured light are continuously improving the accuracy, resolution, and affordability of these sensors. The increasing demand for automation in various industries, such as automotive and manufacturing, is pushing the adoption of 3D sensors for robotics and machine vision. Furthermore, government regulations and safety standards are driving the integration of 3D sensors in several safety-critical applications.
Challenges in the 3D Sensors Industry Sector
The 3D sensors industry faces several challenges. High manufacturing costs and stringent regulatory compliance requirements pose significant hurdles to market penetration, particularly in price-sensitive segments. Supply chain disruptions can affect the availability and cost of components, impacting production and profitability. Intense competition among established players and emerging startups creates pressure on pricing and margins. Furthermore, achieving seamless integration of 3D sensors with existing systems can be technically challenging.
Emerging Opportunities in 3D Sensors Industry
Several emerging opportunities exist within the 3D sensors industry. The increasing demand for advanced driver-assistance systems (ADAS) and autonomous vehicles is driving significant growth in the automotive sector. The proliferation of smartphones, AR/VR devices, and smart homes is creating new applications for 3D sensors in consumer electronics. Moreover, the healthcare industry offers significant potential for 3D sensors in medical imaging, robotic surgery, and personalized medicine.
Leading Players in the 3D Sensors Industry Market
- OmniVision Technologies
- Occipital Inc
- Infineon Technologies AG
- SoftKinetic SA
- Cognex Corporation
- Sick AG
- XYZ Interactive Technologies
- Panasonic Corporation
- Intel Corporation
- LMI Technologies
Key Developments in 3D Sensors Industry Industry
August 2022: ams OSRAM launched a 2.2Mpixel global shutter image sensor for VR headsets, smart glasses, and drones. This development enhances the capabilities of 2D and 3D sensing systems in various consumer and industrial applications.
July 2022: Toposens launched a commercial 3D collision avoidance system for mobile robots using ultrasonic echolocation technology. This marks a significant milestone for the company and the adoption of ultrasonic technology in robotics.
April 2022: Panasonic unveiled the LUMIX GH6 camera, featuring advanced processing technology and high video performance. While not solely focused on 3D sensing, this launch showcases advanced imaging technology advancements impacting the 3D sensor ecosystem.
Strategic Outlook for 3D Sensors Industry Market
The 3D sensors market is poised for significant growth in the coming years, driven by technological advancements, increasing demand from various sectors, and favorable regulatory environments. Continued innovation in sensor technology, along with decreasing costs, will expand market penetration into new applications and sectors. The development of more sophisticated and integrated 3D sensing solutions will provide significant opportunities for industry players and further contribute to the market’s growth. This growth will be influenced by industry consolidation, strategic partnerships, and the emergence of new technologies that improve the functionality and efficiency of 3D sensors.
3D Sensors Industry Segmentation
-
1. Product
- 1.1. Position Sensor
- 1.2. Image Sensor
- 1.3. Temperature Sensor
- 1.4. Accelerometer Sensor
- 1.5. Other Products
-
2. Technology
- 2.1. Ultrasound
- 2.2. Structured Light
- 2.3. Time of Flight
- 2.4. Other Technologies
-
3. End User Vertical
- 3.1. Consumer Electronics
- 3.2. Automotive
- 3.3. Healthcare
- 3.4. Other End User Verticals
3D Sensors Industry Segmentation By Geography
-
1. North America
- 1.1. United States
- 1.2. Canada
-
2. Europe
- 2.1. United Kingdom
- 2.2. Germany
- 2.3. France
- 2.4. Rest of Europe
-
3. Asia Pacific
- 3.1. China
- 3.2. Japan
- 3.3. India
- 3.4. Rest of the Asia Pacific
-
4. Latin America
- 4.1. Mexico
- 5. Middle East
3D Sensors Industry REPORT HIGHLIGHTS
| Aspects | Details |
|---|---|
| Study Period | 2019-2033 |
| Base Year | 2024 |
| Estimated Year | 2025 |
| Forecast Period | 2025-2033 |
| Historical Period | 2019-2024 |
| Growth Rate | CAGR of 18.00% from 2019-2033 |
| Segmentation |
|
Table of Contents
- 1. Introduction
- 1.1. Research Scope
- 1.2. Market Segmentation
- 1.3. Research Methodology
- 1.4. Definitions and Assumptions
- 2. Executive Summary
- 2.1. Introduction
- 3. Market Dynamics
- 3.1. Introduction
- 3.2. Market Drivers
- 3.2.1. Rising Demand for 3D-enabled Devices in Consumer Electronics; Increasing Use of 3D Sensing Technology in Gaming Applications; Integration of Optical and Electronic Components in Miniaturized Electronics Devices
- 3.3. Market Restrains
- 3.3.1. High Cost Required for the Maintenance of these Devices; Integration With Interfaces in Different Devices
- 3.4. Market Trends
- 3.4.1. Automotive to Hold Significant Share
- 4. Market Factor Analysis
- 4.1. Porters Five Forces
- 4.2. Supply/Value Chain
- 4.3. PESTEL analysis
- 4.4. Market Entropy
- 4.5. Patent/Trademark Analysis
- 5. Global 3D Sensors Industry Analysis, Insights and Forecast, 2019-2031
- 5.1. Market Analysis, Insights and Forecast - by Product
- 5.1.1. Position Sensor
- 5.1.2. Image Sensor
- 5.1.3. Temperature Sensor
- 5.1.4. Accelerometer Sensor
- 5.1.5. Other Products
- 5.2. Market Analysis, Insights and Forecast - by Technology
- 5.2.1. Ultrasound
- 5.2.2. Structured Light
- 5.2.3. Time of Flight
- 5.2.4. Other Technologies
- 5.3. Market Analysis, Insights and Forecast - by End User Vertical
- 5.3.1. Consumer Electronics
- 5.3.2. Automotive
- 5.3.3. Healthcare
- 5.3.4. Other End User Verticals
- 5.4. Market Analysis, Insights and Forecast - by Region
- 5.4.1. North America
- 5.4.2. Europe
- 5.4.3. Asia Pacific
- 5.4.4. Latin America
- 5.4.5. Middle East
- 5.1. Market Analysis, Insights and Forecast - by Product
- 6. North America 3D Sensors Industry Analysis, Insights and Forecast, 2019-2031
- 6.1. Market Analysis, Insights and Forecast - by Product
- 6.1.1. Position Sensor
- 6.1.2. Image Sensor
- 6.1.3. Temperature Sensor
- 6.1.4. Accelerometer Sensor
- 6.1.5. Other Products
- 6.2. Market Analysis, Insights and Forecast - by Technology
- 6.2.1. Ultrasound
- 6.2.2. Structured Light
- 6.2.3. Time of Flight
- 6.2.4. Other Technologies
- 6.3. Market Analysis, Insights and Forecast - by End User Vertical
- 6.3.1. Consumer Electronics
- 6.3.2. Automotive
- 6.3.3. Healthcare
- 6.3.4. Other End User Verticals
- 6.1. Market Analysis, Insights and Forecast - by Product
- 7. Europe 3D Sensors Industry Analysis, Insights and Forecast, 2019-2031
- 7.1. Market Analysis, Insights and Forecast - by Product
- 7.1.1. Position Sensor
- 7.1.2. Image Sensor
- 7.1.3. Temperature Sensor
- 7.1.4. Accelerometer Sensor
- 7.1.5. Other Products
- 7.2. Market Analysis, Insights and Forecast - by Technology
- 7.2.1. Ultrasound
- 7.2.2. Structured Light
- 7.2.3. Time of Flight
- 7.2.4. Other Technologies
- 7.3. Market Analysis, Insights and Forecast - by End User Vertical
- 7.3.1. Consumer Electronics
- 7.3.2. Automotive
- 7.3.3. Healthcare
- 7.3.4. Other End User Verticals
- 7.1. Market Analysis, Insights and Forecast - by Product
- 8. Asia Pacific 3D Sensors Industry Analysis, Insights and Forecast, 2019-2031
- 8.1. Market Analysis, Insights and Forecast - by Product
- 8.1.1. Position Sensor
- 8.1.2. Image Sensor
- 8.1.3. Temperature Sensor
- 8.1.4. Accelerometer Sensor
- 8.1.5. Other Products
- 8.2. Market Analysis, Insights and Forecast - by Technology
- 8.2.1. Ultrasound
- 8.2.2. Structured Light
- 8.2.3. Time of Flight
- 8.2.4. Other Technologies
- 8.3. Market Analysis, Insights and Forecast - by End User Vertical
- 8.3.1. Consumer Electronics
- 8.3.2. Automotive
- 8.3.3. Healthcare
- 8.3.4. Other End User Verticals
- 8.1. Market Analysis, Insights and Forecast - by Product
- 9. Latin America 3D Sensors Industry Analysis, Insights and Forecast, 2019-2031
- 9.1. Market Analysis, Insights and Forecast - by Product
- 9.1.1. Position Sensor
- 9.1.2. Image Sensor
- 9.1.3. Temperature Sensor
- 9.1.4. Accelerometer Sensor
- 9.1.5. Other Products
- 9.2. Market Analysis, Insights and Forecast - by Technology
- 9.2.1. Ultrasound
- 9.2.2. Structured Light
- 9.2.3. Time of Flight
- 9.2.4. Other Technologies
- 9.3. Market Analysis, Insights and Forecast - by End User Vertical
- 9.3.1. Consumer Electronics
- 9.3.2. Automotive
- 9.3.3. Healthcare
- 9.3.4. Other End User Verticals
- 9.1. Market Analysis, Insights and Forecast - by Product
- 10. Middle East 3D Sensors Industry Analysis, Insights and Forecast, 2019-2031
- 10.1. Market Analysis, Insights and Forecast - by Product
- 10.1.1. Position Sensor
- 10.1.2. Image Sensor
- 10.1.3. Temperature Sensor
- 10.1.4. Accelerometer Sensor
- 10.1.5. Other Products
- 10.2. Market Analysis, Insights and Forecast - by Technology
- 10.2.1. Ultrasound
- 10.2.2. Structured Light
- 10.2.3. Time of Flight
- 10.2.4. Other Technologies
- 10.3. Market Analysis, Insights and Forecast - by End User Vertical
- 10.3.1. Consumer Electronics
- 10.3.2. Automotive
- 10.3.3. Healthcare
- 10.3.4. Other End User Verticals
- 10.1. Market Analysis, Insights and Forecast - by Product
- 11. North America 3D Sensors Industry Analysis, Insights and Forecast, 2019-2031
- 11.1. Market Analysis, Insights and Forecast - By Country/Sub-region
- 11.1.1 United States
- 11.1.2 Canada
- 12. Europe 3D Sensors Industry Analysis, Insights and Forecast, 2019-2031
- 12.1. Market Analysis, Insights and Forecast - By Country/Sub-region
- 12.1.1 United Kingdom
- 12.1.2 Germany
- 12.1.3 France
- 12.1.4 Rest of Europe
- 13. Asia Pacific 3D Sensors Industry Analysis, Insights and Forecast, 2019-2031
- 13.1. Market Analysis, Insights and Forecast - By Country/Sub-region
- 13.1.1 China
- 13.1.2 Japan
- 13.1.3 India
- 13.1.4 Rest of the Asia Pacific
- 14. Latin America 3D Sensors Industry Analysis, Insights and Forecast, 2019-2031
- 14.1. Market Analysis, Insights and Forecast - By Country/Sub-region
- 14.1.1. Mexico
- 15. Middle East 3D Sensors Industry Analysis, Insights and Forecast, 2019-2031
- 15.1. Market Analysis, Insights and Forecast - By Country/Sub-region
- 15.1.1.
- 16. Competitive Analysis
- 16.1. Global Market Share Analysis 2024
- 16.2. Company Profiles
- 16.2.1 OmniVision Technologies
- 16.2.1.1. Overview
- 16.2.1.2. Products
- 16.2.1.3. SWOT Analysis
- 16.2.1.4. Recent Developments
- 16.2.1.5. Financials (Based on Availability)
- 16.2.2 Occipital Inc
- 16.2.2.1. Overview
- 16.2.2.2. Products
- 16.2.2.3. SWOT Analysis
- 16.2.2.4. Recent Developments
- 16.2.2.5. Financials (Based on Availability)
- 16.2.3 Infineon Technologies AG
- 16.2.3.1. Overview
- 16.2.3.2. Products
- 16.2.3.3. SWOT Analysis
- 16.2.3.4. Recent Developments
- 16.2.3.5. Financials (Based on Availability)
- 16.2.4 SoftKinetic SA
- 16.2.4.1. Overview
- 16.2.4.2. Products
- 16.2.4.3. SWOT Analysis
- 16.2.4.4. Recent Developments
- 16.2.4.5. Financials (Based on Availability)
- 16.2.5 Cognex Corporation*List Not Exhaustive
- 16.2.5.1. Overview
- 16.2.5.2. Products
- 16.2.5.3. SWOT Analysis
- 16.2.5.4. Recent Developments
- 16.2.5.5. Financials (Based on Availability)
- 16.2.6 Sick AG
- 16.2.6.1. Overview
- 16.2.6.2. Products
- 16.2.6.3. SWOT Analysis
- 16.2.6.4. Recent Developments
- 16.2.6.5. Financials (Based on Availability)
- 16.2.7 XYZ Interactive Technologies
- 16.2.7.1. Overview
- 16.2.7.2. Products
- 16.2.7.3. SWOT Analysis
- 16.2.7.4. Recent Developments
- 16.2.7.5. Financials (Based on Availability)
- 16.2.8 Panasonic Corporation
- 16.2.8.1. Overview
- 16.2.8.2. Products
- 16.2.8.3. SWOT Analysis
- 16.2.8.4. Recent Developments
- 16.2.8.5. Financials (Based on Availability)
- 16.2.9 Intel Corporation
- 16.2.9.1. Overview
- 16.2.9.2. Products
- 16.2.9.3. SWOT Analysis
- 16.2.9.4. Recent Developments
- 16.2.9.5. Financials (Based on Availability)
- 16.2.10 LMI Technologies
- 16.2.10.1. Overview
- 16.2.10.2. Products
- 16.2.10.3. SWOT Analysis
- 16.2.10.4. Recent Developments
- 16.2.10.5. Financials (Based on Availability)
- 16.2.1 OmniVision Technologies
List of Figures
- Figure 1: Global 3D Sensors Industry Revenue Breakdown (Million, %) by Region 2024 & 2032
- Figure 2: North America 3D Sensors Industry Revenue (Million), by Country 2024 & 2032
- Figure 3: North America 3D Sensors Industry Revenue Share (%), by Country 2024 & 2032
- Figure 4: Europe 3D Sensors Industry Revenue (Million), by Country 2024 & 2032
- Figure 5: Europe 3D Sensors Industry Revenue Share (%), by Country 2024 & 2032
- Figure 6: Asia Pacific 3D Sensors Industry Revenue (Million), by Country 2024 & 2032
- Figure 7: Asia Pacific 3D Sensors Industry Revenue Share (%), by Country 2024 & 2032
- Figure 8: Latin America 3D Sensors Industry Revenue (Million), by Country 2024 & 2032
- Figure 9: Latin America 3D Sensors Industry Revenue Share (%), by Country 2024 & 2032
- Figure 10: Middle East 3D Sensors Industry Revenue (Million), by Country 2024 & 2032
- Figure 11: Middle East 3D Sensors Industry Revenue Share (%), by Country 2024 & 2032
- Figure 12: North America 3D Sensors Industry Revenue (Million), by Product 2024 & 2032
- Figure 13: North America 3D Sensors Industry Revenue Share (%), by Product 2024 & 2032
- Figure 14: North America 3D Sensors Industry Revenue (Million), by Technology 2024 & 2032
- Figure 15: North America 3D Sensors Industry Revenue Share (%), by Technology 2024 & 2032
- Figure 16: North America 3D Sensors Industry Revenue (Million), by End User Vertical 2024 & 2032
- Figure 17: North America 3D Sensors Industry Revenue Share (%), by End User Vertical 2024 & 2032
- Figure 18: North America 3D Sensors Industry Revenue (Million), by Country 2024 & 2032
- Figure 19: North America 3D Sensors Industry Revenue Share (%), by Country 2024 & 2032
- Figure 20: Europe 3D Sensors Industry Revenue (Million), by Product 2024 & 2032
- Figure 21: Europe 3D Sensors Industry Revenue Share (%), by Product 2024 & 2032
- Figure 22: Europe 3D Sensors Industry Revenue (Million), by Technology 2024 & 2032
- Figure 23: Europe 3D Sensors Industry Revenue Share (%), by Technology 2024 & 2032
- Figure 24: Europe 3D Sensors Industry Revenue (Million), by End User Vertical 2024 & 2032
- Figure 25: Europe 3D Sensors Industry Revenue Share (%), by End User Vertical 2024 & 2032
- Figure 26: Europe 3D Sensors Industry Revenue (Million), by Country 2024 & 2032
- Figure 27: Europe 3D Sensors Industry Revenue Share (%), by Country 2024 & 2032
- Figure 28: Asia Pacific 3D Sensors Industry Revenue (Million), by Product 2024 & 2032
- Figure 29: Asia Pacific 3D Sensors Industry Revenue Share (%), by Product 2024 & 2032
- Figure 30: Asia Pacific 3D Sensors Industry Revenue (Million), by Technology 2024 & 2032
- Figure 31: Asia Pacific 3D Sensors Industry Revenue Share (%), by Technology 2024 & 2032
- Figure 32: Asia Pacific 3D Sensors Industry Revenue (Million), by End User Vertical 2024 & 2032
- Figure 33: Asia Pacific 3D Sensors Industry Revenue Share (%), by End User Vertical 2024 & 2032
- Figure 34: Asia Pacific 3D Sensors Industry Revenue (Million), by Country 2024 & 2032
- Figure 35: Asia Pacific 3D Sensors Industry Revenue Share (%), by Country 2024 & 2032
- Figure 36: Latin America 3D Sensors Industry Revenue (Million), by Product 2024 & 2032
- Figure 37: Latin America 3D Sensors Industry Revenue Share (%), by Product 2024 & 2032
- Figure 38: Latin America 3D Sensors Industry Revenue (Million), by Technology 2024 & 2032
- Figure 39: Latin America 3D Sensors Industry Revenue Share (%), by Technology 2024 & 2032
- Figure 40: Latin America 3D Sensors Industry Revenue (Million), by End User Vertical 2024 & 2032
- Figure 41: Latin America 3D Sensors Industry Revenue Share (%), by End User Vertical 2024 & 2032
- Figure 42: Latin America 3D Sensors Industry Revenue (Million), by Country 2024 & 2032
- Figure 43: Latin America 3D Sensors Industry Revenue Share (%), by Country 2024 & 2032
- Figure 44: Middle East 3D Sensors Industry Revenue (Million), by Product 2024 & 2032
- Figure 45: Middle East 3D Sensors Industry Revenue Share (%), by Product 2024 & 2032
- Figure 46: Middle East 3D Sensors Industry Revenue (Million), by Technology 2024 & 2032
- Figure 47: Middle East 3D Sensors Industry Revenue Share (%), by Technology 2024 & 2032
- Figure 48: Middle East 3D Sensors Industry Revenue (Million), by End User Vertical 2024 & 2032
- Figure 49: Middle East 3D Sensors Industry Revenue Share (%), by End User Vertical 2024 & 2032
- Figure 50: Middle East 3D Sensors Industry Revenue (Million), by Country 2024 & 2032
- Figure 51: Middle East 3D Sensors Industry Revenue Share (%), by Country 2024 & 2032
List of Tables
- Table 1: Global 3D Sensors Industry Revenue Million Forecast, by Region 2019 & 2032
- Table 2: Global 3D Sensors Industry Revenue Million Forecast, by Product 2019 & 2032
- Table 3: Global 3D Sensors Industry Revenue Million Forecast, by Technology 2019 & 2032
- Table 4: Global 3D Sensors Industry Revenue Million Forecast, by End User Vertical 2019 & 2032
- Table 5: Global 3D Sensors Industry Revenue Million Forecast, by Region 2019 & 2032
- Table 6: Global 3D Sensors Industry Revenue Million Forecast, by Country 2019 & 2032
- Table 7: United States 3D Sensors Industry Revenue (Million) Forecast, by Application 2019 & 2032
- Table 8: Canada 3D Sensors Industry Revenue (Million) Forecast, by Application 2019 & 2032
- Table 9: Global 3D Sensors Industry Revenue Million Forecast, by Country 2019 & 2032
- Table 10: United Kingdom 3D Sensors Industry Revenue (Million) Forecast, by Application 2019 & 2032
- Table 11: Germany 3D Sensors Industry Revenue (Million) Forecast, by Application 2019 & 2032
- Table 12: France 3D Sensors Industry Revenue (Million) Forecast, by Application 2019 & 2032
- Table 13: Rest of Europe 3D Sensors Industry Revenue (Million) Forecast, by Application 2019 & 2032
- Table 14: Global 3D Sensors Industry Revenue Million Forecast, by Country 2019 & 2032
- Table 15: China 3D Sensors Industry Revenue (Million) Forecast, by Application 2019 & 2032
- Table 16: Japan 3D Sensors Industry Revenue (Million) Forecast, by Application 2019 & 2032
- Table 17: India 3D Sensors Industry Revenue (Million) Forecast, by Application 2019 & 2032
- Table 18: Rest of the Asia Pacific 3D Sensors Industry Revenue (Million) Forecast, by Application 2019 & 2032
- Table 19: Global 3D Sensors Industry Revenue Million Forecast, by Country 2019 & 2032
- Table 20: Mexico 3D Sensors Industry Revenue (Million) Forecast, by Application 2019 & 2032
- Table 21: Global 3D Sensors Industry Revenue Million Forecast, by Country 2019 & 2032
- Table 22: 3D Sensors Industry Revenue (Million) Forecast, by Application 2019 & 2032
- Table 23: Global 3D Sensors Industry Revenue Million Forecast, by Product 2019 & 2032
- Table 24: Global 3D Sensors Industry Revenue Million Forecast, by Technology 2019 & 2032
- Table 25: Global 3D Sensors Industry Revenue Million Forecast, by End User Vertical 2019 & 2032
- Table 26: Global 3D Sensors Industry Revenue Million Forecast, by Country 2019 & 2032
- Table 27: United States 3D Sensors Industry Revenue (Million) Forecast, by Application 2019 & 2032
- Table 28: Canada 3D Sensors Industry Revenue (Million) Forecast, by Application 2019 & 2032
- Table 29: Global 3D Sensors Industry Revenue Million Forecast, by Product 2019 & 2032
- Table 30: Global 3D Sensors Industry Revenue Million Forecast, by Technology 2019 & 2032
- Table 31: Global 3D Sensors Industry Revenue Million Forecast, by End User Vertical 2019 & 2032
- Table 32: Global 3D Sensors Industry Revenue Million Forecast, by Country 2019 & 2032
- Table 33: United Kingdom 3D Sensors Industry Revenue (Million) Forecast, by Application 2019 & 2032
- Table 34: Germany 3D Sensors Industry Revenue (Million) Forecast, by Application 2019 & 2032
- Table 35: France 3D Sensors Industry Revenue (Million) Forecast, by Application 2019 & 2032
- Table 36: Rest of Europe 3D Sensors Industry Revenue (Million) Forecast, by Application 2019 & 2032
- Table 37: Global 3D Sensors Industry Revenue Million Forecast, by Product 2019 & 2032
- Table 38: Global 3D Sensors Industry Revenue Million Forecast, by Technology 2019 & 2032
- Table 39: Global 3D Sensors Industry Revenue Million Forecast, by End User Vertical 2019 & 2032
- Table 40: Global 3D Sensors Industry Revenue Million Forecast, by Country 2019 & 2032
- Table 41: China 3D Sensors Industry Revenue (Million) Forecast, by Application 2019 & 2032
- Table 42: Japan 3D Sensors Industry Revenue (Million) Forecast, by Application 2019 & 2032
- Table 43: India 3D Sensors Industry Revenue (Million) Forecast, by Application 2019 & 2032
- Table 44: Rest of the Asia Pacific 3D Sensors Industry Revenue (Million) Forecast, by Application 2019 & 2032
- Table 45: Global 3D Sensors Industry Revenue Million Forecast, by Product 2019 & 2032
- Table 46: Global 3D Sensors Industry Revenue Million Forecast, by Technology 2019 & 2032
- Table 47: Global 3D Sensors Industry Revenue Million Forecast, by End User Vertical 2019 & 2032
- Table 48: Global 3D Sensors Industry Revenue Million Forecast, by Country 2019 & 2032
- Table 49: Mexico 3D Sensors Industry Revenue (Million) Forecast, by Application 2019 & 2032
- Table 50: Global 3D Sensors Industry Revenue Million Forecast, by Product 2019 & 2032
- Table 51: Global 3D Sensors Industry Revenue Million Forecast, by Technology 2019 & 2032
- Table 52: Global 3D Sensors Industry Revenue Million Forecast, by End User Vertical 2019 & 2032
- Table 53: Global 3D Sensors Industry Revenue Million Forecast, by Country 2019 & 2032
Frequently Asked Questions
1. What is the projected Compound Annual Growth Rate (CAGR) of the 3D Sensors Industry?
The projected CAGR is approximately 18.00%.
2. Which companies are prominent players in the 3D Sensors Industry?
Key companies in the market include OmniVision Technologies, Occipital Inc, Infineon Technologies AG, SoftKinetic SA, Cognex Corporation*List Not Exhaustive, Sick AG, XYZ Interactive Technologies, Panasonic Corporation, Intel Corporation, LMI Technologies.
3. What are the main segments of the 3D Sensors Industry?
The market segments include Product, Technology, End User Vertical.
4. Can you provide details about the market size?
The market size is estimated to be USD XX Million as of 2022.
5. What are some drivers contributing to market growth?
Rising Demand for 3D-enabled Devices in Consumer Electronics; Increasing Use of 3D Sensing Technology in Gaming Applications; Integration of Optical and Electronic Components in Miniaturized Electronics Devices.
6. What are the notable trends driving market growth?
Automotive to Hold Significant Share.
7. Are there any restraints impacting market growth?
High Cost Required for the Maintenance of these Devices; Integration With Interfaces in Different Devices.
8. Can you provide examples of recent developments in the market?
August 2022 : ams OSRAM, a global leader in optical solutions, announced the release of a 2.2Mpixel global shutter visible and near-infrared (NIR) image sensor with the low-power characteristics and small size required in the latest 2D and 3D sensing systems for virtual reality (VR) headsets, smart glasses, drones, and other consumer and industrial applications.
9. What pricing options are available for accessing the report?
Pricing options include single-user, multi-user, and enterprise licenses priced at USD 4750, USD 5250, and USD 8750 respectively.
10. Is the market size provided in terms of value or volume?
The market size is provided in terms of value, measured in Million.
11. Are there any specific market keywords associated with the report?
Yes, the market keyword associated with the report is "3D Sensors Industry," which aids in identifying and referencing the specific market segment covered.
12. How do I determine which pricing option suits my needs best?
The pricing options vary based on user requirements and access needs. Individual users may opt for single-user licenses, while businesses requiring broader access may choose multi-user or enterprise licenses for cost-effective access to the report.
13. Are there any additional resources or data provided in the 3D Sensors Industry report?
While the report offers comprehensive insights, it's advisable to review the specific contents or supplementary materials provided to ascertain if additional resources or data are available.
14. How can I stay updated on further developments or reports in the 3D Sensors Industry?
To stay informed about further developments, trends, and reports in the 3D Sensors Industry, consider subscribing to industry newsletters, following relevant companies and organizations, or regularly checking reputable industry news sources and publications.
Methodology
Step 1 - Identification of Relevant Samples Size from Population Database


Step 2 - Approaches for Defining Global Market Size (Value, Volume* & Price*)

Note*: In applicable scenarios
Step 3 - Data Sources
Primary Research
- Web Analytics
- Survey Reports
- Research Institute
- Latest Research Reports
- Opinion Leaders
Secondary Research
- Annual Reports
- White Paper
- Latest Press Release
- Industry Association
- Paid Database
- Investor Presentations

Step 4 - Data Triangulation
Involves using different sources of information in order to increase the validity of a study
These sources are likely to be stakeholders in a program - participants, other researchers, program staff, other community members, and so on.
Then we put all data in single framework & apply various statistical tools to find out the dynamic on the market.
During the analysis stage, feedback from the stakeholder groups would be compared to determine areas of agreement as well as areas of divergence


