
Key Insights
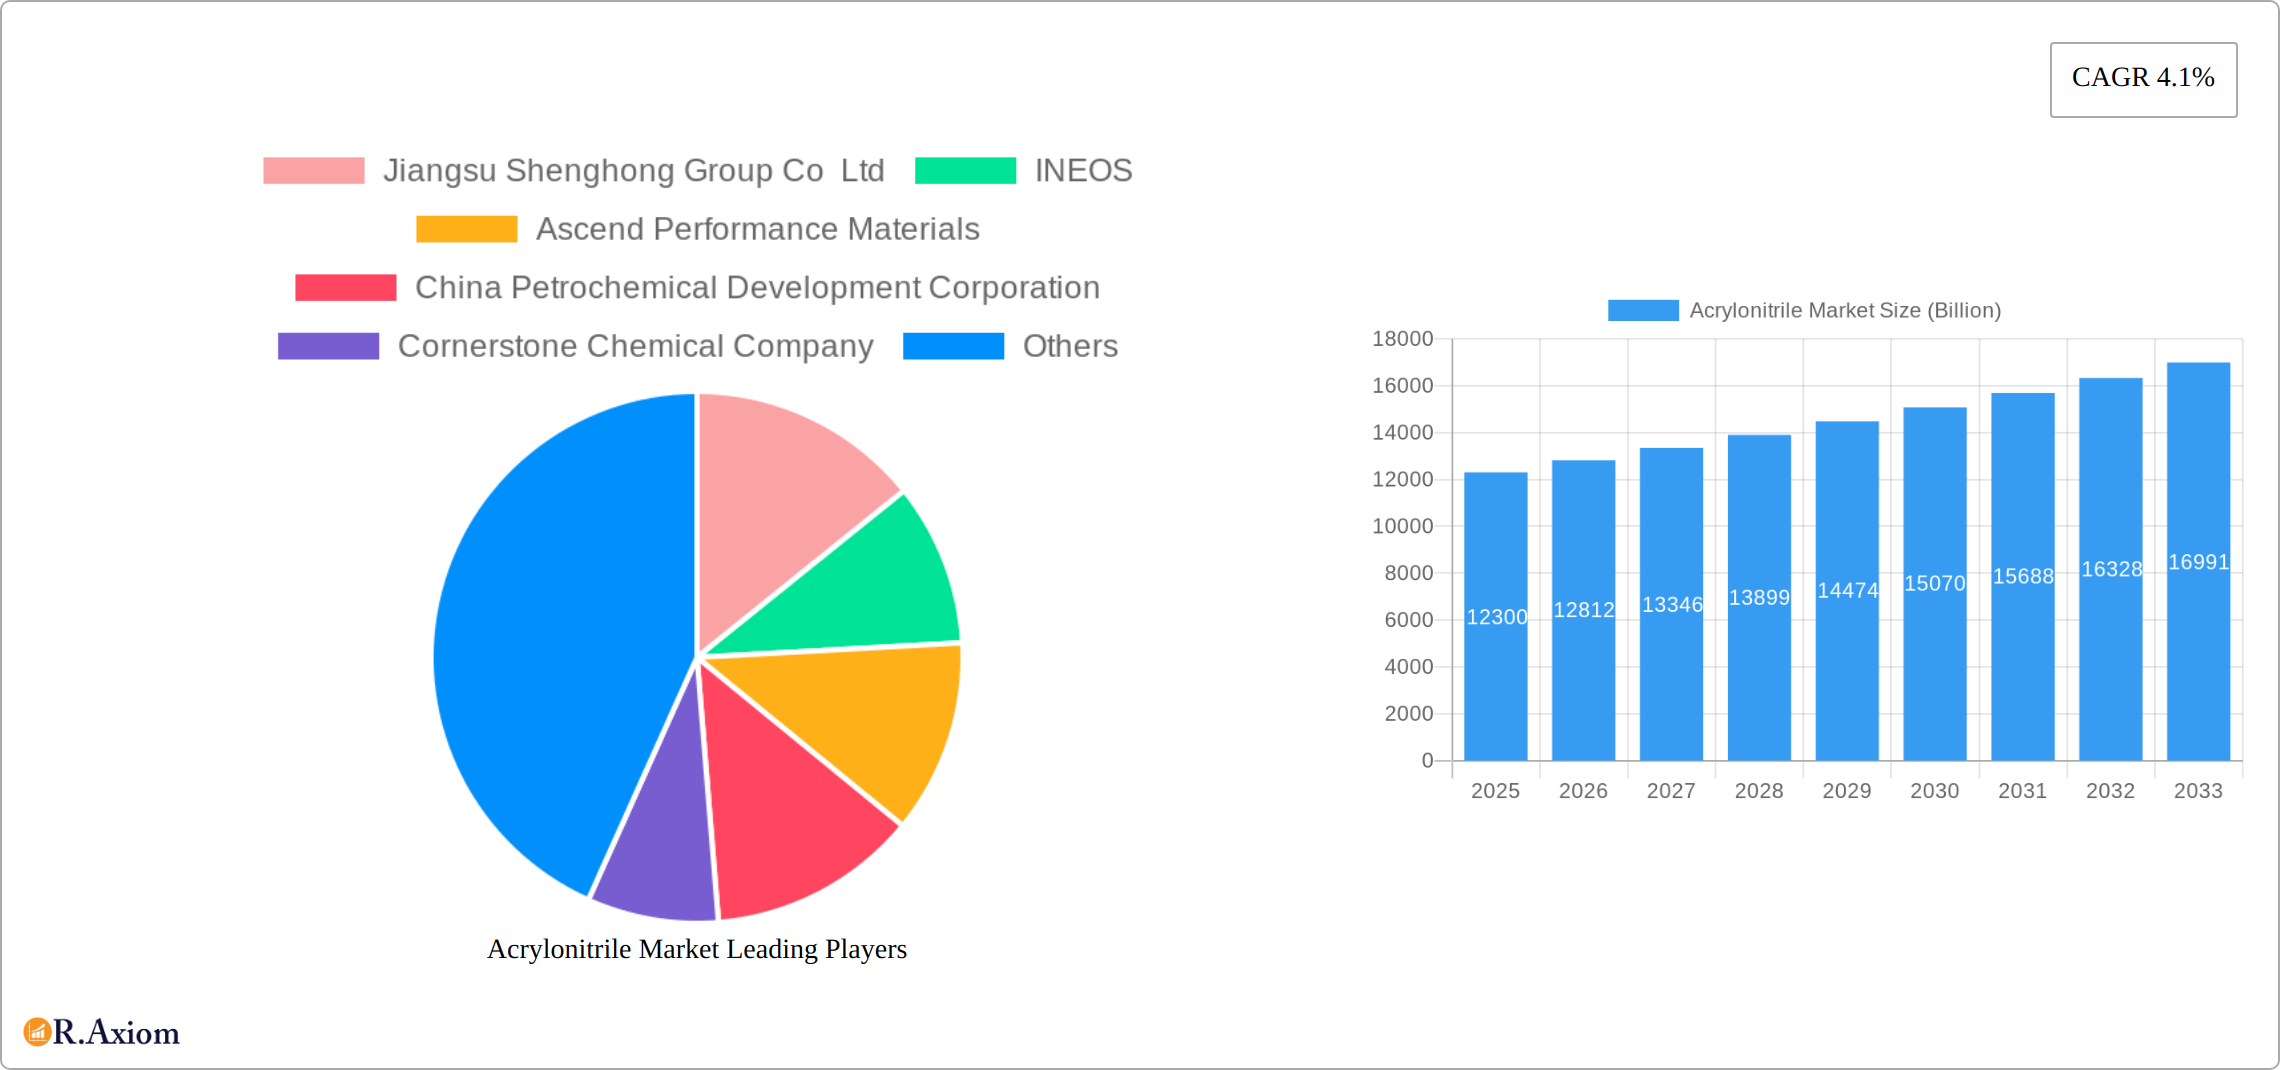
The global acrylonitrile market, valued at $12.3 billion in 2025, is projected to experience steady growth, driven by a robust Compound Annual Growth Rate (CAGR) of 4.1% from 2025 to 2033. This expansion is fueled by increasing demand across diverse end-use sectors. The automotive industry, particularly passenger vehicles and light commercial vehicles, is a significant contributor to market growth, fueled by the rising production of vehicles globally and the increasing use of acrylonitrile-based materials in various vehicle components. Similarly, the building and construction sector, encompassing residential, commercial, and industrial applications, contributes significantly due to the material's role in plastics, fibers, and adhesives. The packaging industry's reliance on acrylonitrile for the production of durable and versatile plastics further bolsters market demand. Growth in emerging economies, particularly in Asia-Pacific, is also expected to significantly contribute to the market's expansion over the forecast period. Technological advancements in acrylonitrile production processes, aimed at enhancing efficiency and reducing environmental impact, are also expected to positively influence market dynamics.
However, the market faces certain restraints. Fluctuations in raw material prices, particularly those of propylene and ammonia, can impact acrylonitrile production costs and profitability. Furthermore, environmental regulations concerning emissions and waste disposal are becoming increasingly stringent, potentially posing challenges to manufacturers. Nevertheless, the overall positive outlook for acrylonitrile is sustained by its versatility and continued importance across various industries. The market segmentation reveals strong growth potential across applications such as acrylonitrile butadiene styrene (ABS) resins, acrylamide, and nitrile butadiene rubber (NBR), further underscoring its broad appeal and future prospects. Key players are strategically focusing on research and development, expanding production capacities, and exploring new applications to maintain their competitive edge in this dynamic market.
Acrylonitrile Market: A Comprehensive Report (2019-2033)
This in-depth report provides a comprehensive analysis of the global acrylonitrile market, encompassing historical data (2019-2024), current estimations (2025), and future projections (2025-2033). It delves into market dynamics, competitive landscape, technological advancements, and growth opportunities, offering actionable insights for stakeholders across the value chain. The report covers key segments including process technology, application, and end-use industry, providing granular data and detailed analysis to support informed decision-making. The market is projected to reach xx Billion by 2033, presenting significant investment and growth opportunities.
Acrylonitrile Market Market Concentration & Innovation
The acrylonitrile market displays a moderately concentrated competitive landscape, dominated by a few key players commanding substantial market shares. While precise market share data for individual companies remains confidential, industry giants like Jiangsu Shenghong Group Co Ltd, INEOS, and Ascend Performance Materials are recognized for their significant production capacities and global reach. This concentration stems from the capital-intensive nature of acrylonitrile production and the inherent economies of scale favoring large-scale operations. The market structure is further influenced by ongoing mergers and acquisitions (M&A) activity, although specific deal values are typically undisclosed. Historical trends suggest a pattern of consolidation, with larger players acquiring smaller entities to bolster their market share and diversify their product portfolios.
Innovation within the acrylonitrile market is heavily influenced by the imperative for more sustainable and efficient manufacturing processes. This is evident in recent advancements such as INEOS Nitriles' introduction of bio-attributed acrylonitrile, highlighting the industry's response to growing environmental concerns. Stringent regulatory frameworks focused on environmental sustainability and emissions reduction are significant catalysts for innovation. Furthermore, the pursuit of cost-effective and high-performance acrylonitrile-based materials continues to drive robust research and development efforts. The competitive pressure exerted by substitute polymers and resins necessitates continuous innovation and improvement of existing offerings.
End-user trends, particularly within the automotive, building & construction, and packaging sectors, exert a powerful influence on acrylonitrile demand. These trends, coupled with the ongoing drive towards sustainable and innovative solutions, are shaping the future trajectory of this dynamic market. Understanding these multifaceted factors – from market concentration and M&A activity to technological advancements and evolving end-user needs – is crucial for navigating the complexities of the acrylonitrile market.
Acrylonitrile Market Industry Trends & Insights
The global acrylonitrile market is experiencing robust growth, driven by increasing demand across various end-use industries. The market exhibits a CAGR of xx% during the forecast period (2025-2033). This growth is propelled by factors such as expanding construction activities worldwide, particularly in emerging economies, fueling demand for acrylonitrile-based polymers in building materials. The automotive sector also plays a significant role, with rising vehicle production driving demand for acrylonitrile in ABS and SAN resins for interior and exterior components.
Technological disruptions, primarily focused on improving production efficiency and sustainability, are transforming the market. The adoption of advanced process technologies like improved ammoxidation processes and the incorporation of bio-attributed raw materials are improving the environmental profile of acrylonitrile and its derivatives. Consumer preferences for eco-friendly and sustainable products are increasingly influencing the industry's innovation trajectory, pushing manufacturers to adopt greener production methods and develop more sustainable products. The competitive dynamics of the market are marked by intense rivalry among key players, leading to price competition, product innovation, and expansion into new markets. Market penetration of acrylonitrile in various applications continues to increase, propelled by the material's versatility and cost-effectiveness.

Dominant Markets & Segments in Acrylonitrile Market
The acrylonitrile market's dominance varies significantly across segments. Geographically, Asia-Pacific region leads in both production and consumption, driven by robust economic growth, infrastructure development, and a large manufacturing base.
- Leading Regions/Countries: Asia-Pacific (China, Japan, India, South Korea), North America (USA)
- Key Drivers:
- Rapid industrialization and urbanization in emerging economies.
- Increasing demand from the building & construction sector.
- Growing automotive and consumer goods industries.
- Favorable government policies supporting infrastructure development.
Segment Dominance:
- Process Technology: The Ammoxidation Process dominates the market owing to its established efficiency and cost-effectiveness.
- Application: Acrylic Fiber is currently the largest application segment due to its extensive use in textiles. However, the Acrylonitrile Butadiene Styrene (ABS) and Styrene-Acrylonitrile Resin (SAN) segments are expected to exhibit robust growth in the coming years due to increased demand from automotive and electrical & electronics sectors.
- End-use Industry: The building & construction sector represents the largest end-use market for acrylonitrile, given its application in various construction materials and infrastructure projects. The automotive sector is another major consumer of acrylonitrile, driven by the expanding automobile industry globally.
Acrylonitrile Market Product Developments
Recent product innovations center around sustainability and improved performance. INEOS Nitriles' bio-attributed acrylonitrile is a prime example, offering a more environmentally friendly alternative. Technological advancements are focused on optimizing production processes, improving product properties like strength and durability, and creating new applications for acrylonitrile-based materials. Market fit is enhanced through collaborations with end-users to tailor materials for specific applications and needs.
Report Scope & Segmentation Analysis
This report segments the acrylonitrile market by:
- Process Technology: Ammoxidation Process and Other Production Processes. The Ammoxidation Process holds the largest market share but alternative processes are gaining traction due to sustainability concerns.
- Application: Acrylic Fiber, Acrylonitrile Butadiene Styrene (ABS)/Styrene-Acrylonitrile Resin (SAN), Acrylamide, Nitrile Butadiene Rubber (NBR), and Other Applications. Growth projections vary significantly across application segments, with ABS/SAN and other specialty applications showing the fastest growth.
- End-use Industry: Building & Construction (Residential, Commercial, Industrial, and Infrastructural), Automotive (PVs, LCVs, and HCVs), Packaging (Rigid and Flexible), Electrical & Electronics, Medical & Pharmaceuticals, Textiles, and Others. Building & construction and automotive represent the largest end-use segments but growth in other sectors, such as electronics and medical, is notable.
Each segment's growth trajectory, market size, and competitive dynamics are analyzed in detail within the report.
Key Drivers of Acrylonitrile Market Growth
Growth in the acrylonitrile market is fueled by several key factors: rising global demand for construction materials, increased vehicle production, expansion of the electronics sector, and technological advancements promoting more sustainable and cost-effective production processes. Government initiatives supporting infrastructure development in emerging markets are also contributing significantly.
Challenges in the Acrylonitrile Market Sector
Challenges include fluctuating raw material prices, stringent environmental regulations leading to increased production costs, and intense competition among major players. Supply chain disruptions and geopolitical factors can also impact market stability. The estimated impact of these factors on market growth is xx Billion annually.
Emerging Opportunities in Acrylonitrile Market
Emerging opportunities exist in expanding applications of acrylonitrile in high-growth sectors like renewable energy, advanced materials, and specialty chemicals. The development of bio-based acrylonitrile and other sustainable alternatives opens up new avenues for growth. The increasing focus on sustainable and eco-friendly materials further boosts opportunities for environmentally conscious producers and consumers.
Leading Players in the Acrylonitrile Market Market
- Jiangsu Shenghong Group Co Ltd
- INEOS
- Ascend Performance Materials
- China Petrochemical Development Corporation
- Cornerstone Chemical Company
- Taekwang Industrial Co Ltd
- AnQore
- Asahi Kasei Advance Corporation
- Formosa Plastics Corp
- China Petroleum & Chemical Corporation (SINOPEC)
- PetroChina (CNPC)
- SOCAR (Petkim Petrokimya Holding A)
Key Developments in Acrylonitrile Market Industry
- February 2024: The Mitsubishi Chemical Group announced the discontinuation of MMA monomer production and shift towards acrylonitrile and its derivatives. This reflects a strategic shift in the company’s portfolio and could influence market supply.
- November 2023: China Petrochemical Development Corp resumed production at two acrylonitrile lines in Kaohsiung, Taiwan, impacting market supply and potentially prices.
- June 2023: INEOS Nitriles launched its InvireoTM bio-attributed acrylonitrile, signaling a growing focus on sustainability and potentially altering market dynamics.
- February 2023: Sumitomo Chemical Co. Ltd obtained ISCC PLUS certification, highlighting increasing importance of sustainability certifications in the industry.
Strategic Outlook for Acrylonitrile Market Market
The acrylonitrile market is poised for continued growth, driven by increasing demand from key sectors and the ongoing development of sustainable production technologies. Expanding applications in high-growth areas and rising consumer preference for eco-friendly products create significant future potential. Strategic partnerships and innovations in product development will be critical for companies to thrive in this dynamic and competitive landscape.
Acrylonitrile Market Segmentation
-
1. Process Technology
- 1.1. Ammoxidation Process
- 1.2. Other Production Processes
-
2. Application
- 2.1. Acrylic Fiber
- 2.2. Acryloni
- 2.3. Acrylamide
- 2.4. Nitrile Butadiene Rubber (NBR)
- 2.5. Other Applications
Acrylonitrile Market Segmentation By Geography
-
1. Asia Pacific
- 1.1. China
- 1.2. India
- 1.3. Japan
- 1.4. South Korea
- 1.5. Rest of Asia Pacific
-
2. North America
- 2.1. United States
- 2.2. Canada
-
3. Europe
- 3.1. Germany
- 3.2. United Kingdom
- 3.3. Italy
- 3.4. France
- 3.5. Russia
- 3.6. Rest of Europe
-
4. Latin America
- 4.1. Brazil
- 4.2. Argentina
- 4.3. Colombia
- 4.4. Rest of Latin America
- 5. Middle East and Africa

Acrylonitrile Market REPORT HIGHLIGHTS
| Aspects | Details |
|---|---|
| Study Period | 2019-2033 |
| Base Year | 2024 |
| Estimated Year | 2025 |
| Forecast Period | 2025-2033 |
| Historical Period | 2019-2024 |
| Growth Rate | CAGR of 4.1% from 2019-2033 |
| Segmentation |
|
Table of Contents
- 1. Introduction
- 1.1. Research Scope
- 1.2. Market Segmentation
- 1.3. Research Methodology
- 1.4. Definitions and Assumptions
- 2. Executive Summary
- 2.1. Introduction
- 3. Market Dynamics
- 3.1. Introduction
- 3.2. Market Drivers
- 3.2.1. Increasing Demand for Acrylonitrile Butadiene Styrene (ABS) in the Automotive and Construction Industries; Growing Textile Industry
- 3.3. Market Restrains
- 3.3.1. Toxicity and Regulations of Acrylonitrile; Other Restraints
- 3.4. Market Trends
- 3.4.1. The Demand for Acrylonitrile for Acrylonitrile Butadiene Styrene (ABS) is Rising
- 4. Market Factor Analysis
- 4.1. Porters Five Forces
- 4.2. Supply/Value Chain
- 4.3. PESTEL analysis
- 4.4. Market Entropy
- 4.5. Patent/Trademark Analysis
- 5. Global Acrylonitrile Market Analysis, Insights and Forecast, 2019-2031
- 5.1. Market Analysis, Insights and Forecast - by Process Technology
- 5.1.1. Ammoxidation Process
- 5.1.2. Other Production Processes
- 5.2. Market Analysis, Insights and Forecast - by Application
- 5.2.1. Acrylic Fiber
- 5.2.2. Acryloni
- 5.2.3. Acrylamide
- 5.2.4. Nitrile Butadiene Rubber (NBR)
- 5.2.5. Other Applications
- 5.3. Market Analysis, Insights and Forecast - by Region
- 5.3.1. Asia Pacific
- 5.3.2. North America
- 5.3.3. Europe
- 5.3.4. Latin America
- 5.3.5. Middle East and Africa
- 5.1. Market Analysis, Insights and Forecast - by Process Technology
- 6. Asia Pacific Acrylonitrile Market Analysis, Insights and Forecast, 2019-2031
- 6.1. Market Analysis, Insights and Forecast - by Process Technology
- 6.1.1. Ammoxidation Process
- 6.1.2. Other Production Processes
- 6.2. Market Analysis, Insights and Forecast - by Application
- 6.2.1. Acrylic Fiber
- 6.2.2. Acryloni
- 6.2.3. Acrylamide
- 6.2.4. Nitrile Butadiene Rubber (NBR)
- 6.2.5. Other Applications
- 6.1. Market Analysis, Insights and Forecast - by Process Technology
- 7. North America Acrylonitrile Market Analysis, Insights and Forecast, 2019-2031
- 7.1. Market Analysis, Insights and Forecast - by Process Technology
- 7.1.1. Ammoxidation Process
- 7.1.2. Other Production Processes
- 7.2. Market Analysis, Insights and Forecast - by Application
- 7.2.1. Acrylic Fiber
- 7.2.2. Acryloni
- 7.2.3. Acrylamide
- 7.2.4. Nitrile Butadiene Rubber (NBR)
- 7.2.5. Other Applications
- 7.1. Market Analysis, Insights and Forecast - by Process Technology
- 8. Europe Acrylonitrile Market Analysis, Insights and Forecast, 2019-2031
- 8.1. Market Analysis, Insights and Forecast - by Process Technology
- 8.1.1. Ammoxidation Process
- 8.1.2. Other Production Processes
- 8.2. Market Analysis, Insights and Forecast - by Application
- 8.2.1. Acrylic Fiber
- 8.2.2. Acryloni
- 8.2.3. Acrylamide
- 8.2.4. Nitrile Butadiene Rubber (NBR)
- 8.2.5. Other Applications
- 8.1. Market Analysis, Insights and Forecast - by Process Technology
- 9. Latin America Acrylonitrile Market Analysis, Insights and Forecast, 2019-2031
- 9.1. Market Analysis, Insights and Forecast - by Process Technology
- 9.1.1. Ammoxidation Process
- 9.1.2. Other Production Processes
- 9.2. Market Analysis, Insights and Forecast - by Application
- 9.2.1. Acrylic Fiber
- 9.2.2. Acryloni
- 9.2.3. Acrylamide
- 9.2.4. Nitrile Butadiene Rubber (NBR)
- 9.2.5. Other Applications
- 9.1. Market Analysis, Insights and Forecast - by Process Technology
- 10. Middle East and Africa Acrylonitrile Market Analysis, Insights and Forecast, 2019-2031
- 10.1. Market Analysis, Insights and Forecast - by Process Technology
- 10.1.1. Ammoxidation Process
- 10.1.2. Other Production Processes
- 10.2. Market Analysis, Insights and Forecast - by Application
- 10.2.1. Acrylic Fiber
- 10.2.2. Acryloni
- 10.2.3. Acrylamide
- 10.2.4. Nitrile Butadiene Rubber (NBR)
- 10.2.5. Other Applications
- 10.1. Market Analysis, Insights and Forecast - by Process Technology
- 11. North America Acrylonitrile Market Analysis, Insights and Forecast, 2019-2031
- 11.1. Market Analysis, Insights and Forecast - By Country/Sub-region
- 11.1.1 United States
- 11.1.2 Canada
- 11.1.3 Mexico
- 12. Europe Acrylonitrile Market Analysis, Insights and Forecast, 2019-2031
- 12.1. Market Analysis, Insights and Forecast - By Country/Sub-region
- 12.1.1 Germany
- 12.1.2 France
- 12.1.3 Italy
- 12.1.4 United Kingdom
- 12.1.5 Netherlands
- 12.1.6 Rest of Europe
- 13. Asia Pacific Acrylonitrile Market Analysis, Insights and Forecast, 2019-2031
- 13.1. Market Analysis, Insights and Forecast - By Country/Sub-region
- 13.1.1 China
- 13.1.2 Japan
- 13.1.3 India
- 13.1.4 South Korea
- 13.1.5 Taiwan
- 13.1.6 Australia
- 13.1.7 Rest of Asia-Pacific
- 14. South America Acrylonitrile Market Analysis, Insights and Forecast, 2019-2031
- 14.1. Market Analysis, Insights and Forecast - By Country/Sub-region
- 14.1.1 Brazil
- 14.1.2 Argentina
- 14.1.3 Rest of South America
- 15. MEA Acrylonitrile Market Analysis, Insights and Forecast, 2019-2031
- 15.1. Market Analysis, Insights and Forecast - By Country/Sub-region
- 15.1.1 Middle East
- 15.1.2 Africa
- 16. Competitive Analysis
- 16.1. Global Market Share Analysis 2024
- 16.2. Company Profiles
- 16.2.1 Jiangsu Shenghong Group Co Ltd
- 16.2.1.1. Overview
- 16.2.1.2. Products
- 16.2.1.3. SWOT Analysis
- 16.2.1.4. Recent Developments
- 16.2.1.5. Financials (Based on Availability)
- 16.2.2 INEOS
- 16.2.2.1. Overview
- 16.2.2.2. Products
- 16.2.2.3. SWOT Analysis
- 16.2.2.4. Recent Developments
- 16.2.2.5. Financials (Based on Availability)
- 16.2.3 Ascend Performance Materials
- 16.2.3.1. Overview
- 16.2.3.2. Products
- 16.2.3.3. SWOT Analysis
- 16.2.3.4. Recent Developments
- 16.2.3.5. Financials (Based on Availability)
- 16.2.4 China Petrochemical Development Corporation
- 16.2.4.1. Overview
- 16.2.4.2. Products
- 16.2.4.3. SWOT Analysis
- 16.2.4.4. Recent Developments
- 16.2.4.5. Financials (Based on Availability)
- 16.2.5 Cornerstone Chemical Company
- 16.2.5.1. Overview
- 16.2.5.2. Products
- 16.2.5.3. SWOT Analysis
- 16.2.5.4. Recent Developments
- 16.2.5.5. Financials (Based on Availability)
- 16.2.6 Taekwang Industrial Co Ltd
- 16.2.6.1. Overview
- 16.2.6.2. Products
- 16.2.6.3. SWOT Analysis
- 16.2.6.4. Recent Developments
- 16.2.6.5. Financials (Based on Availability)
- 16.2.7 AnQore
- 16.2.7.1. Overview
- 16.2.7.2. Products
- 16.2.7.3. SWOT Analysis
- 16.2.7.4. Recent Developments
- 16.2.7.5. Financials (Based on Availability)
- 16.2.8 Asahi Kasei Advance Corporation
- 16.2.8.1. Overview
- 16.2.8.2. Products
- 16.2.8.3. SWOT Analysis
- 16.2.8.4. Recent Developments
- 16.2.8.5. Financials (Based on Availability)
- 16.2.9 Formosa Plastics Corp
- 16.2.9.1. Overview
- 16.2.9.2. Products
- 16.2.9.3. SWOT Analysis
- 16.2.9.4. Recent Developments
- 16.2.9.5. Financials (Based on Availability)
- 16.2.10 China Petroleum & Chemical Corporation (SINOPEC)
- 16.2.10.1. Overview
- 16.2.10.2. Products
- 16.2.10.3. SWOT Analysis
- 16.2.10.4. Recent Developments
- 16.2.10.5. Financials (Based on Availability)
- 16.2.11 PetroChina (CNPC)
- 16.2.11.1. Overview
- 16.2.11.2. Products
- 16.2.11.3. SWOT Analysis
- 16.2.11.4. Recent Developments
- 16.2.11.5. Financials (Based on Availability)
- 16.2.12 SOCAR (Petkim Petrokimya Holding A)
- 16.2.12.1. Overview
- 16.2.12.2. Products
- 16.2.12.3. SWOT Analysis
- 16.2.12.4. Recent Developments
- 16.2.12.5. Financials (Based on Availability)
- 16.2.1 Jiangsu Shenghong Group Co Ltd
List of Figures
- Figure 1: Global Acrylonitrile Market Revenue Breakdown (Billion, %) by Region 2024 & 2032
- Figure 2: Global Acrylonitrile Market Volume Breakdown (K Tons, %) by Region 2024 & 2032
- Figure 3: North America Acrylonitrile Market Revenue (Billion), by Country 2024 & 2032
- Figure 4: North America Acrylonitrile Market Volume (K Tons), by Country 2024 & 2032
- Figure 5: North America Acrylonitrile Market Revenue Share (%), by Country 2024 & 2032
- Figure 6: North America Acrylonitrile Market Volume Share (%), by Country 2024 & 2032
- Figure 7: Europe Acrylonitrile Market Revenue (Billion), by Country 2024 & 2032
- Figure 8: Europe Acrylonitrile Market Volume (K Tons), by Country 2024 & 2032
- Figure 9: Europe Acrylonitrile Market Revenue Share (%), by Country 2024 & 2032
- Figure 10: Europe Acrylonitrile Market Volume Share (%), by Country 2024 & 2032
- Figure 11: Asia Pacific Acrylonitrile Market Revenue (Billion), by Country 2024 & 2032
- Figure 12: Asia Pacific Acrylonitrile Market Volume (K Tons), by Country 2024 & 2032
- Figure 13: Asia Pacific Acrylonitrile Market Revenue Share (%), by Country 2024 & 2032
- Figure 14: Asia Pacific Acrylonitrile Market Volume Share (%), by Country 2024 & 2032
- Figure 15: South America Acrylonitrile Market Revenue (Billion), by Country 2024 & 2032
- Figure 16: South America Acrylonitrile Market Volume (K Tons), by Country 2024 & 2032
- Figure 17: South America Acrylonitrile Market Revenue Share (%), by Country 2024 & 2032
- Figure 18: South America Acrylonitrile Market Volume Share (%), by Country 2024 & 2032
- Figure 19: MEA Acrylonitrile Market Revenue (Billion), by Country 2024 & 2032
- Figure 20: MEA Acrylonitrile Market Volume (K Tons), by Country 2024 & 2032
- Figure 21: MEA Acrylonitrile Market Revenue Share (%), by Country 2024 & 2032
- Figure 22: MEA Acrylonitrile Market Volume Share (%), by Country 2024 & 2032
- Figure 23: Asia Pacific Acrylonitrile Market Revenue (Billion), by Process Technology 2024 & 2032
- Figure 24: Asia Pacific Acrylonitrile Market Volume (K Tons), by Process Technology 2024 & 2032
- Figure 25: Asia Pacific Acrylonitrile Market Revenue Share (%), by Process Technology 2024 & 2032
- Figure 26: Asia Pacific Acrylonitrile Market Volume Share (%), by Process Technology 2024 & 2032
- Figure 27: Asia Pacific Acrylonitrile Market Revenue (Billion), by Application 2024 & 2032
- Figure 28: Asia Pacific Acrylonitrile Market Volume (K Tons), by Application 2024 & 2032
- Figure 29: Asia Pacific Acrylonitrile Market Revenue Share (%), by Application 2024 & 2032
- Figure 30: Asia Pacific Acrylonitrile Market Volume Share (%), by Application 2024 & 2032
- Figure 31: Asia Pacific Acrylonitrile Market Revenue (Billion), by Country 2024 & 2032
- Figure 32: Asia Pacific Acrylonitrile Market Volume (K Tons), by Country 2024 & 2032
- Figure 33: Asia Pacific Acrylonitrile Market Revenue Share (%), by Country 2024 & 2032
- Figure 34: Asia Pacific Acrylonitrile Market Volume Share (%), by Country 2024 & 2032
- Figure 35: North America Acrylonitrile Market Revenue (Billion), by Process Technology 2024 & 2032
- Figure 36: North America Acrylonitrile Market Volume (K Tons), by Process Technology 2024 & 2032
- Figure 37: North America Acrylonitrile Market Revenue Share (%), by Process Technology 2024 & 2032
- Figure 38: North America Acrylonitrile Market Volume Share (%), by Process Technology 2024 & 2032
- Figure 39: North America Acrylonitrile Market Revenue (Billion), by Application 2024 & 2032
- Figure 40: North America Acrylonitrile Market Volume (K Tons), by Application 2024 & 2032
- Figure 41: North America Acrylonitrile Market Revenue Share (%), by Application 2024 & 2032
- Figure 42: North America Acrylonitrile Market Volume Share (%), by Application 2024 & 2032
- Figure 43: North America Acrylonitrile Market Revenue (Billion), by Country 2024 & 2032
- Figure 44: North America Acrylonitrile Market Volume (K Tons), by Country 2024 & 2032
- Figure 45: North America Acrylonitrile Market Revenue Share (%), by Country 2024 & 2032
- Figure 46: North America Acrylonitrile Market Volume Share (%), by Country 2024 & 2032
- Figure 47: Europe Acrylonitrile Market Revenue (Billion), by Process Technology 2024 & 2032
- Figure 48: Europe Acrylonitrile Market Volume (K Tons), by Process Technology 2024 & 2032
- Figure 49: Europe Acrylonitrile Market Revenue Share (%), by Process Technology 2024 & 2032
- Figure 50: Europe Acrylonitrile Market Volume Share (%), by Process Technology 2024 & 2032
- Figure 51: Europe Acrylonitrile Market Revenue (Billion), by Application 2024 & 2032
- Figure 52: Europe Acrylonitrile Market Volume (K Tons), by Application 2024 & 2032
- Figure 53: Europe Acrylonitrile Market Revenue Share (%), by Application 2024 & 2032
- Figure 54: Europe Acrylonitrile Market Volume Share (%), by Application 2024 & 2032
- Figure 55: Europe Acrylonitrile Market Revenue (Billion), by Country 2024 & 2032
- Figure 56: Europe Acrylonitrile Market Volume (K Tons), by Country 2024 & 2032
- Figure 57: Europe Acrylonitrile Market Revenue Share (%), by Country 2024 & 2032
- Figure 58: Europe Acrylonitrile Market Volume Share (%), by Country 2024 & 2032
- Figure 59: Latin America Acrylonitrile Market Revenue (Billion), by Process Technology 2024 & 2032
- Figure 60: Latin America Acrylonitrile Market Volume (K Tons), by Process Technology 2024 & 2032
- Figure 61: Latin America Acrylonitrile Market Revenue Share (%), by Process Technology 2024 & 2032
- Figure 62: Latin America Acrylonitrile Market Volume Share (%), by Process Technology 2024 & 2032
- Figure 63: Latin America Acrylonitrile Market Revenue (Billion), by Application 2024 & 2032
- Figure 64: Latin America Acrylonitrile Market Volume (K Tons), by Application 2024 & 2032
- Figure 65: Latin America Acrylonitrile Market Revenue Share (%), by Application 2024 & 2032
- Figure 66: Latin America Acrylonitrile Market Volume Share (%), by Application 2024 & 2032
- Figure 67: Latin America Acrylonitrile Market Revenue (Billion), by Country 2024 & 2032
- Figure 68: Latin America Acrylonitrile Market Volume (K Tons), by Country 2024 & 2032
- Figure 69: Latin America Acrylonitrile Market Revenue Share (%), by Country 2024 & 2032
- Figure 70: Latin America Acrylonitrile Market Volume Share (%), by Country 2024 & 2032
- Figure 71: Middle East and Africa Acrylonitrile Market Revenue (Billion), by Process Technology 2024 & 2032
- Figure 72: Middle East and Africa Acrylonitrile Market Volume (K Tons), by Process Technology 2024 & 2032
- Figure 73: Middle East and Africa Acrylonitrile Market Revenue Share (%), by Process Technology 2024 & 2032
- Figure 74: Middle East and Africa Acrylonitrile Market Volume Share (%), by Process Technology 2024 & 2032
- Figure 75: Middle East and Africa Acrylonitrile Market Revenue (Billion), by Application 2024 & 2032
- Figure 76: Middle East and Africa Acrylonitrile Market Volume (K Tons), by Application 2024 & 2032
- Figure 77: Middle East and Africa Acrylonitrile Market Revenue Share (%), by Application 2024 & 2032
- Figure 78: Middle East and Africa Acrylonitrile Market Volume Share (%), by Application 2024 & 2032
- Figure 79: Middle East and Africa Acrylonitrile Market Revenue (Billion), by Country 2024 & 2032
- Figure 80: Middle East and Africa Acrylonitrile Market Volume (K Tons), by Country 2024 & 2032
- Figure 81: Middle East and Africa Acrylonitrile Market Revenue Share (%), by Country 2024 & 2032
- Figure 82: Middle East and Africa Acrylonitrile Market Volume Share (%), by Country 2024 & 2032
List of Tables
- Table 1: Global Acrylonitrile Market Revenue Billion Forecast, by Region 2019 & 2032
- Table 2: Global Acrylonitrile Market Volume K Tons Forecast, by Region 2019 & 2032
- Table 3: Global Acrylonitrile Market Revenue Billion Forecast, by Process Technology 2019 & 2032
- Table 4: Global Acrylonitrile Market Volume K Tons Forecast, by Process Technology 2019 & 2032
- Table 5: Global Acrylonitrile Market Revenue Billion Forecast, by Application 2019 & 2032
- Table 6: Global Acrylonitrile Market Volume K Tons Forecast, by Application 2019 & 2032
- Table 7: Global Acrylonitrile Market Revenue Billion Forecast, by Region 2019 & 2032
- Table 8: Global Acrylonitrile Market Volume K Tons Forecast, by Region 2019 & 2032
- Table 9: Global Acrylonitrile Market Revenue Billion Forecast, by Country 2019 & 2032
- Table 10: Global Acrylonitrile Market Volume K Tons Forecast, by Country 2019 & 2032
- Table 11: United States Acrylonitrile Market Revenue (Billion) Forecast, by Application 2019 & 2032
- Table 12: United States Acrylonitrile Market Volume (K Tons) Forecast, by Application 2019 & 2032
- Table 13: Canada Acrylonitrile Market Revenue (Billion) Forecast, by Application 2019 & 2032
- Table 14: Canada Acrylonitrile Market Volume (K Tons) Forecast, by Application 2019 & 2032
- Table 15: Mexico Acrylonitrile Market Revenue (Billion) Forecast, by Application 2019 & 2032
- Table 16: Mexico Acrylonitrile Market Volume (K Tons) Forecast, by Application 2019 & 2032
- Table 17: Global Acrylonitrile Market Revenue Billion Forecast, by Country 2019 & 2032
- Table 18: Global Acrylonitrile Market Volume K Tons Forecast, by Country 2019 & 2032
- Table 19: Germany Acrylonitrile Market Revenue (Billion) Forecast, by Application 2019 & 2032
- Table 20: Germany Acrylonitrile Market Volume (K Tons) Forecast, by Application 2019 & 2032
- Table 21: France Acrylonitrile Market Revenue (Billion) Forecast, by Application 2019 & 2032
- Table 22: France Acrylonitrile Market Volume (K Tons) Forecast, by Application 2019 & 2032
- Table 23: Italy Acrylonitrile Market Revenue (Billion) Forecast, by Application 2019 & 2032
- Table 24: Italy Acrylonitrile Market Volume (K Tons) Forecast, by Application 2019 & 2032
- Table 25: United Kingdom Acrylonitrile Market Revenue (Billion) Forecast, by Application 2019 & 2032
- Table 26: United Kingdom Acrylonitrile Market Volume (K Tons) Forecast, by Application 2019 & 2032
- Table 27: Netherlands Acrylonitrile Market Revenue (Billion) Forecast, by Application 2019 & 2032
- Table 28: Netherlands Acrylonitrile Market Volume (K Tons) Forecast, by Application 2019 & 2032
- Table 29: Rest of Europe Acrylonitrile Market Revenue (Billion) Forecast, by Application 2019 & 2032
- Table 30: Rest of Europe Acrylonitrile Market Volume (K Tons) Forecast, by Application 2019 & 2032
- Table 31: Global Acrylonitrile Market Revenue Billion Forecast, by Country 2019 & 2032
- Table 32: Global Acrylonitrile Market Volume K Tons Forecast, by Country 2019 & 2032
- Table 33: China Acrylonitrile Market Revenue (Billion) Forecast, by Application 2019 & 2032
- Table 34: China Acrylonitrile Market Volume (K Tons) Forecast, by Application 2019 & 2032
- Table 35: Japan Acrylonitrile Market Revenue (Billion) Forecast, by Application 2019 & 2032
- Table 36: Japan Acrylonitrile Market Volume (K Tons) Forecast, by Application 2019 & 2032
- Table 37: India Acrylonitrile Market Revenue (Billion) Forecast, by Application 2019 & 2032
- Table 38: India Acrylonitrile Market Volume (K Tons) Forecast, by Application 2019 & 2032
- Table 39: South Korea Acrylonitrile Market Revenue (Billion) Forecast, by Application 2019 & 2032
- Table 40: South Korea Acrylonitrile Market Volume (K Tons) Forecast, by Application 2019 & 2032
- Table 41: Taiwan Acrylonitrile Market Revenue (Billion) Forecast, by Application 2019 & 2032
- Table 42: Taiwan Acrylonitrile Market Volume (K Tons) Forecast, by Application 2019 & 2032
- Table 43: Australia Acrylonitrile Market Revenue (Billion) Forecast, by Application 2019 & 2032
- Table 44: Australia Acrylonitrile Market Volume (K Tons) Forecast, by Application 2019 & 2032
- Table 45: Rest of Asia-Pacific Acrylonitrile Market Revenue (Billion) Forecast, by Application 2019 & 2032
- Table 46: Rest of Asia-Pacific Acrylonitrile Market Volume (K Tons) Forecast, by Application 2019 & 2032
- Table 47: Global Acrylonitrile Market Revenue Billion Forecast, by Country 2019 & 2032
- Table 48: Global Acrylonitrile Market Volume K Tons Forecast, by Country 2019 & 2032
- Table 49: Brazil Acrylonitrile Market Revenue (Billion) Forecast, by Application 2019 & 2032
- Table 50: Brazil Acrylonitrile Market Volume (K Tons) Forecast, by Application 2019 & 2032
- Table 51: Argentina Acrylonitrile Market Revenue (Billion) Forecast, by Application 2019 & 2032
- Table 52: Argentina Acrylonitrile Market Volume (K Tons) Forecast, by Application 2019 & 2032
- Table 53: Rest of South America Acrylonitrile Market Revenue (Billion) Forecast, by Application 2019 & 2032
- Table 54: Rest of South America Acrylonitrile Market Volume (K Tons) Forecast, by Application 2019 & 2032
- Table 55: Global Acrylonitrile Market Revenue Billion Forecast, by Country 2019 & 2032
- Table 56: Global Acrylonitrile Market Volume K Tons Forecast, by Country 2019 & 2032
- Table 57: Middle East Acrylonitrile Market Revenue (Billion) Forecast, by Application 2019 & 2032
- Table 58: Middle East Acrylonitrile Market Volume (K Tons) Forecast, by Application 2019 & 2032
- Table 59: Africa Acrylonitrile Market Revenue (Billion) Forecast, by Application 2019 & 2032
- Table 60: Africa Acrylonitrile Market Volume (K Tons) Forecast, by Application 2019 & 2032
- Table 61: Global Acrylonitrile Market Revenue Billion Forecast, by Process Technology 2019 & 2032
- Table 62: Global Acrylonitrile Market Volume K Tons Forecast, by Process Technology 2019 & 2032
- Table 63: Global Acrylonitrile Market Revenue Billion Forecast, by Application 2019 & 2032
- Table 64: Global Acrylonitrile Market Volume K Tons Forecast, by Application 2019 & 2032
- Table 65: Global Acrylonitrile Market Revenue Billion Forecast, by Country 2019 & 2032
- Table 66: Global Acrylonitrile Market Volume K Tons Forecast, by Country 2019 & 2032
- Table 67: China Acrylonitrile Market Revenue (Billion) Forecast, by Application 2019 & 2032
- Table 68: China Acrylonitrile Market Volume (K Tons) Forecast, by Application 2019 & 2032
- Table 69: India Acrylonitrile Market Revenue (Billion) Forecast, by Application 2019 & 2032
- Table 70: India Acrylonitrile Market Volume (K Tons) Forecast, by Application 2019 & 2032
- Table 71: Japan Acrylonitrile Market Revenue (Billion) Forecast, by Application 2019 & 2032
- Table 72: Japan Acrylonitrile Market Volume (K Tons) Forecast, by Application 2019 & 2032
- Table 73: South Korea Acrylonitrile Market Revenue (Billion) Forecast, by Application 2019 & 2032
- Table 74: South Korea Acrylonitrile Market Volume (K Tons) Forecast, by Application 2019 & 2032
- Table 75: Rest of Asia Pacific Acrylonitrile Market Revenue (Billion) Forecast, by Application 2019 & 2032
- Table 76: Rest of Asia Pacific Acrylonitrile Market Volume (K Tons) Forecast, by Application 2019 & 2032
- Table 77: Global Acrylonitrile Market Revenue Billion Forecast, by Process Technology 2019 & 2032
- Table 78: Global Acrylonitrile Market Volume K Tons Forecast, by Process Technology 2019 & 2032
- Table 79: Global Acrylonitrile Market Revenue Billion Forecast, by Application 2019 & 2032
- Table 80: Global Acrylonitrile Market Volume K Tons Forecast, by Application 2019 & 2032
- Table 81: Global Acrylonitrile Market Revenue Billion Forecast, by Country 2019 & 2032
- Table 82: Global Acrylonitrile Market Volume K Tons Forecast, by Country 2019 & 2032
- Table 83: United States Acrylonitrile Market Revenue (Billion) Forecast, by Application 2019 & 2032
- Table 84: United States Acrylonitrile Market Volume (K Tons) Forecast, by Application 2019 & 2032
- Table 85: Canada Acrylonitrile Market Revenue (Billion) Forecast, by Application 2019 & 2032
- Table 86: Canada Acrylonitrile Market Volume (K Tons) Forecast, by Application 2019 & 2032
- Table 87: Global Acrylonitrile Market Revenue Billion Forecast, by Process Technology 2019 & 2032
- Table 88: Global Acrylonitrile Market Volume K Tons Forecast, by Process Technology 2019 & 2032
- Table 89: Global Acrylonitrile Market Revenue Billion Forecast, by Application 2019 & 2032
- Table 90: Global Acrylonitrile Market Volume K Tons Forecast, by Application 2019 & 2032
- Table 91: Global Acrylonitrile Market Revenue Billion Forecast, by Country 2019 & 2032
- Table 92: Global Acrylonitrile Market Volume K Tons Forecast, by Country 2019 & 2032
- Table 93: Germany Acrylonitrile Market Revenue (Billion) Forecast, by Application 2019 & 2032
- Table 94: Germany Acrylonitrile Market Volume (K Tons) Forecast, by Application 2019 & 2032
- Table 95: United Kingdom Acrylonitrile Market Revenue (Billion) Forecast, by Application 2019 & 2032
- Table 96: United Kingdom Acrylonitrile Market Volume (K Tons) Forecast, by Application 2019 & 2032
- Table 97: Italy Acrylonitrile Market Revenue (Billion) Forecast, by Application 2019 & 2032
- Table 98: Italy Acrylonitrile Market Volume (K Tons) Forecast, by Application 2019 & 2032
- Table 99: France Acrylonitrile Market Revenue (Billion) Forecast, by Application 2019 & 2032
- Table 100: France Acrylonitrile Market Volume (K Tons) Forecast, by Application 2019 & 2032
- Table 101: Russia Acrylonitrile Market Revenue (Billion) Forecast, by Application 2019 & 2032
- Table 102: Russia Acrylonitrile Market Volume (K Tons) Forecast, by Application 2019 & 2032
- Table 103: Rest of Europe Acrylonitrile Market Revenue (Billion) Forecast, by Application 2019 & 2032
- Table 104: Rest of Europe Acrylonitrile Market Volume (K Tons) Forecast, by Application 2019 & 2032
- Table 105: Global Acrylonitrile Market Revenue Billion Forecast, by Process Technology 2019 & 2032
- Table 106: Global Acrylonitrile Market Volume K Tons Forecast, by Process Technology 2019 & 2032
- Table 107: Global Acrylonitrile Market Revenue Billion Forecast, by Application 2019 & 2032
- Table 108: Global Acrylonitrile Market Volume K Tons Forecast, by Application 2019 & 2032
- Table 109: Global Acrylonitrile Market Revenue Billion Forecast, by Country 2019 & 2032
- Table 110: Global Acrylonitrile Market Volume K Tons Forecast, by Country 2019 & 2032
- Table 111: Brazil Acrylonitrile Market Revenue (Billion) Forecast, by Application 2019 & 2032
- Table 112: Brazil Acrylonitrile Market Volume (K Tons) Forecast, by Application 2019 & 2032
- Table 113: Argentina Acrylonitrile Market Revenue (Billion) Forecast, by Application 2019 & 2032
- Table 114: Argentina Acrylonitrile Market Volume (K Tons) Forecast, by Application 2019 & 2032
- Table 115: Colombia Acrylonitrile Market Revenue (Billion) Forecast, by Application 2019 & 2032
- Table 116: Colombia Acrylonitrile Market Volume (K Tons) Forecast, by Application 2019 & 2032
- Table 117: Rest of Latin America Acrylonitrile Market Revenue (Billion) Forecast, by Application 2019 & 2032
- Table 118: Rest of Latin America Acrylonitrile Market Volume (K Tons) Forecast, by Application 2019 & 2032
- Table 119: Global Acrylonitrile Market Revenue Billion Forecast, by Process Technology 2019 & 2032
- Table 120: Global Acrylonitrile Market Volume K Tons Forecast, by Process Technology 2019 & 2032
- Table 121: Global Acrylonitrile Market Revenue Billion Forecast, by Application 2019 & 2032
- Table 122: Global Acrylonitrile Market Volume K Tons Forecast, by Application 2019 & 2032
- Table 123: Global Acrylonitrile Market Revenue Billion Forecast, by Country 2019 & 2032
- Table 124: Global Acrylonitrile Market Volume K Tons Forecast, by Country 2019 & 2032
Frequently Asked Questions
1. What is the projected Compound Annual Growth Rate (CAGR) of the Acrylonitrile Market?
The projected CAGR is approximately 4.1%.
2. Which companies are prominent players in the Acrylonitrile Market?
Key companies in the market include Jiangsu Shenghong Group Co Ltd, INEOS, Ascend Performance Materials, China Petrochemical Development Corporation, Cornerstone Chemical Company, Taekwang Industrial Co Ltd, AnQore, Asahi Kasei Advance Corporation, Formosa Plastics Corp, China Petroleum & Chemical Corporation (SINOPEC), PetroChina (CNPC), SOCAR (Petkim Petrokimya Holding A).
3. What are the main segments of the Acrylonitrile Market?
The market segments include Process Technology, Application.
4. Can you provide details about the market size?
The market size is estimated to be USD 12.3 Billion as of 2022.
5. What are some drivers contributing to market growth?
Increasing Demand for Acrylonitrile Butadiene Styrene (ABS) in the Automotive and Construction Industries; Growing Textile Industry.
6. What are the notable trends driving market growth?
The Demand for Acrylonitrile for Acrylonitrile Butadiene Styrene (ABS) is Rising.
7. Are there any restraints impacting market growth?
Toxicity and Regulations of Acrylonitrile; Other Restraints.
8. Can you provide examples of recent developments in the market?
February 2024: The Mitsubishi Chemical Group announced the discontinuation of MMA monomer production by the ACH process and the production of acrylonitrile and acrylonitrile derivatives at the Mitsubishi Chemical Hiroshima Plant (Otake City, Hiroshima Prefecture).
9. What pricing options are available for accessing the report?
Pricing options include single-user, multi-user, and enterprise licenses priced at USD 4750, USD 5250, and USD 8750 respectively.
10. Is the market size provided in terms of value or volume?
The market size is provided in terms of value, measured in Billion and volume, measured in K Tons.
11. Are there any specific market keywords associated with the report?
Yes, the market keyword associated with the report is "Acrylonitrile Market," which aids in identifying and referencing the specific market segment covered.
12. How do I determine which pricing option suits my needs best?
The pricing options vary based on user requirements and access needs. Individual users may opt for single-user licenses, while businesses requiring broader access may choose multi-user or enterprise licenses for cost-effective access to the report.
13. Are there any additional resources or data provided in the Acrylonitrile Market report?
While the report offers comprehensive insights, it's advisable to review the specific contents or supplementary materials provided to ascertain if additional resources or data are available.
14. How can I stay updated on further developments or reports in the Acrylonitrile Market?
To stay informed about further developments, trends, and reports in the Acrylonitrile Market, consider subscribing to industry newsletters, following relevant companies and organizations, or regularly checking reputable industry news sources and publications.
Methodology
Step 1 - Identification of Relevant Samples Size from Population Database


Step 2 - Approaches for Defining Global Market Size (Value, Volume* & Price*)

Note*: In applicable scenarios
Step 3 - Data Sources
Primary Research
- Web Analytics
- Survey Reports
- Research Institute
- Latest Research Reports
- Opinion Leaders
Secondary Research
- Annual Reports
- White Paper
- Latest Press Release
- Industry Association
- Paid Database
- Investor Presentations

Step 4 - Data Triangulation
Involves using different sources of information in order to increase the validity of a study
These sources are likely to be stakeholders in a program - participants, other researchers, program staff, other community members, and so on.
Then we put all data in single framework & apply various statistical tools to find out the dynamic on the market.
During the analysis stage, feedback from the stakeholder groups would be compared to determine areas of agreement as well as areas of divergence


