


Key Insights into the Ai Generated 3d Models Market
The Ai Generated 3d Models Market is poised for substantial expansion, driven by the escalating demand for automated content creation and immersive digital experiences across various industries. Valued at $1253 million in 2025, the market is projected to reach approximately $2354 million by 2034, exhibiting a robust Compound Annual Growth Rate (CAGR) of 7.4% over the forecast period. This growth trajectory is underpinned by significant advancements in generative artificial intelligence (AI), which are democratizing 3D content creation and dramatically reducing production timelines and costs. Key demand drivers include the pervasive digital transformation across enterprise sectors, the burgeoning metaverse economy, and the relentless need for rapid prototyping and visualization in product design and marketing.
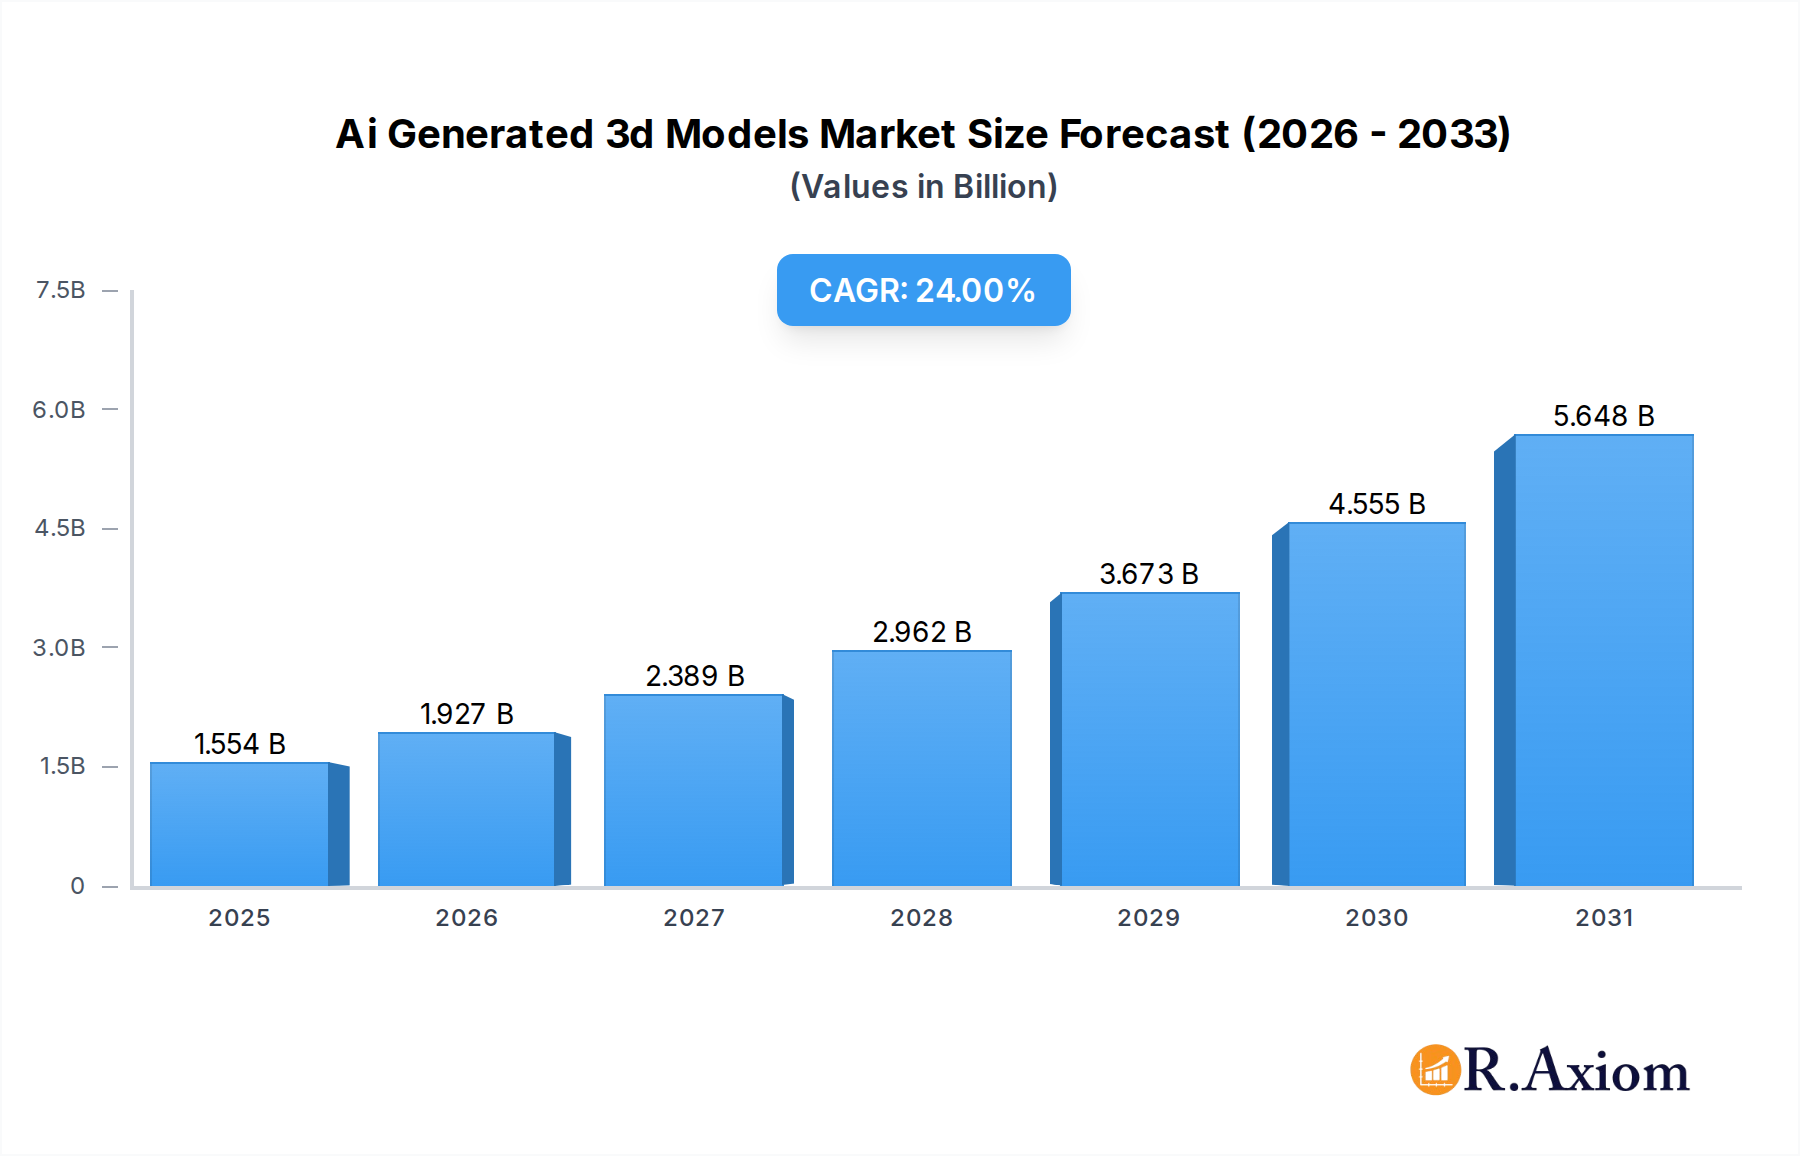
Ai Generated 3d Models Market Size (In Billion)

Macro tailwinds such as the increasing integration of AI into design workflows, the expansion of the Gaming & Entertainment Market, and the rising adoption of augmented and virtual reality technologies are providing substantial impetus. The capability of AI-driven platforms to transform text descriptions or 2D images into complex 3D assets is revolutionizing fields that traditionally rely on labor-intensive 3D modeling. This extends the reach of sophisticated 3D creation to non-expert users, fostering innovation and accelerating development cycles. Furthermore, the continuous improvement in AI model fidelity and efficiency is overcoming initial quality limitations, making AI-generated models suitable for a broader spectrum of professional applications. The Ai Generated 3d Models Market is transitioning from a niche technology to a foundational tool, impacting the broader Artificial Intelligence Software Market and reshaping the landscape of digital content production globally.
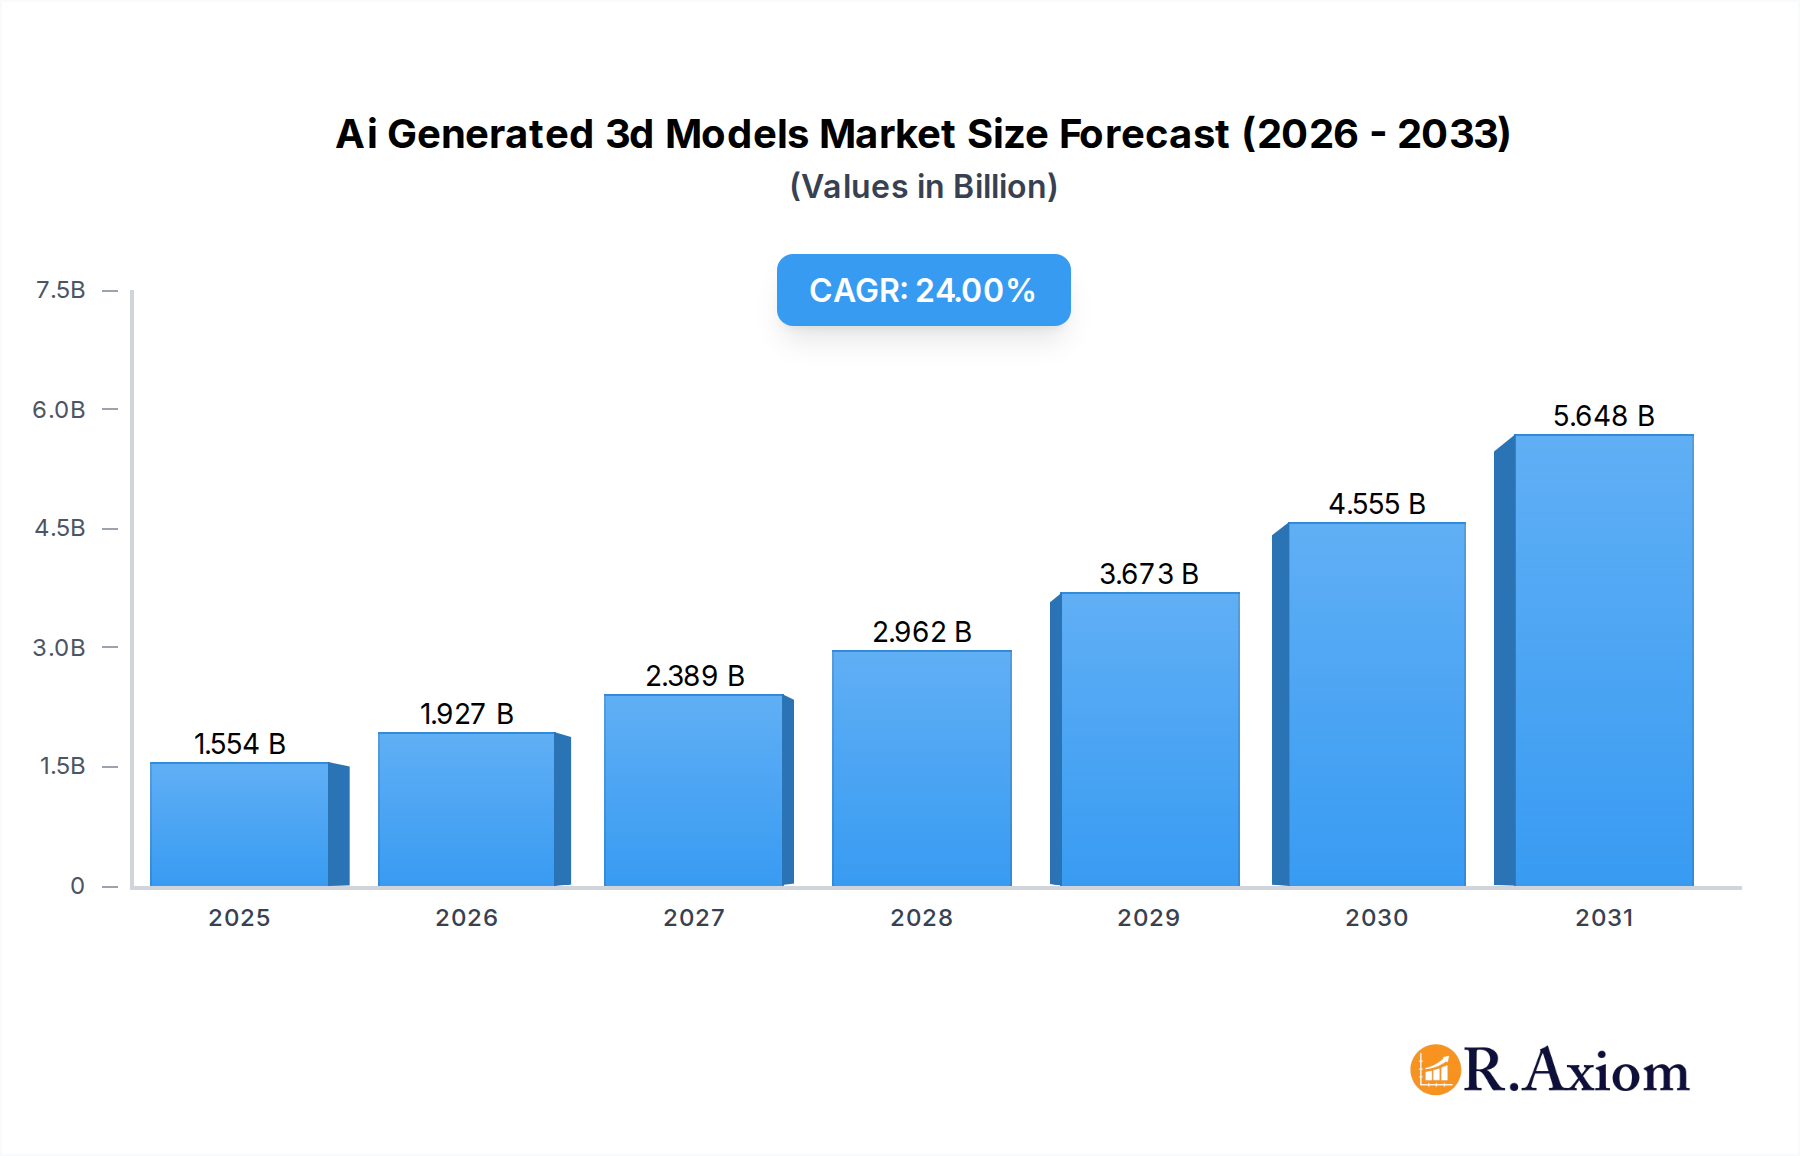
Ai Generated 3d Models Company Market Share
Text-to-3D Software Dominance in the Ai Generated 3d Models Market
The Type segment of the Ai Generated 3d Models Market is characterized by various methodologies, with the Text-to-3D Software Market emerging as a significant and rapidly expanding sub-segment. This category, alongside Image-to-3D Software Market, underpins the market's innovation, but Text-to-3D holds a particular prominence due to its intuitive interface and profound implications for content accessibility. Text-to-3D technology empowers users to generate intricate 3D models merely by providing textual prompts, effectively lowering the barrier to entry for 3D content creation. This eliminates the need for specialized 3D modeling skills or extensive knowledge of traditional Computer Graphics Software Market tools, thus democratizing access to professional-grade 3D assets.
The dominance of the Text-to-3D Software Market within the Ai Generated 3d Models Market can be attributed to several factors. Firstly, its unparalleled speed in concept visualization and rapid prototyping is invaluable for industries like product design, marketing, and game development. Designers can iterate on ideas in minutes, translating abstract concepts into tangible 3D representations, which significantly compresses development cycles in the Product Design Software Market. Secondly, the increasing sophistication of underlying AI models, particularly diffusion models and large language models, allows for higher fidelity and more semantically accurate interpretations of user prompts. This means more complex and detailed models can be generated with greater control and consistency, bridging the gap between AI output and professional requirements.
Key players like OpenAI, Google DeepMind, and specialized startups such as Luma AI and MESHY LLC. are at the forefront of advancing Text-to-3D capabilities. Their continuous research and development efforts are enhancing model understanding, improving mesh topology, and optimizing texture generation, making the outputs increasingly suitable for production environments. While challenges remain in achieving absolute photorealism and precise control over highly specific details, the trajectory of improvement is steep. The expanding integration of Text-to-3D tools into broader 3D Modeling Software Market ecosystems suggests its share will continue to grow, consolidating its position as a transformative force in the Ai Generated 3d Models Market by enabling unprecedented scalability and personalization in 3D content generation.
Key Market Drivers & Constraints in the Ai Generated 3d Models Market
Drivers:
Accelerated Demand for Digital Content and Immersive Experiences: The proliferation of digital platforms, the emergence of the metaverse, and the sustained growth of the Gaming & Entertainment Market are creating an insatiable demand for 3D content. AI-generated 3D models offer a scalable solution to produce the vast quantities of unique assets required for these evolving digital ecosystems. This driver is quantified by industry projections indicating a compound annual growth rate in digital media consumption exceeding 15% year-over-year, directly correlating with the need for efficient 3D asset pipelines. The efficiency gain in content creation directly benefits the overall Artificial Intelligence Software Market by integrating sophisticated generation tools.
Enhanced Efficiency and Reduced Time-to-Market: AI-driven 3D generation tools drastically reduce the time and resources traditionally required for 3D modeling. Tasks that previously took days or weeks for human artists can now be accomplished in minutes. This operational efficiency is critical for sectors like the Product Design Software Market, where rapid prototyping and iteration are paramount. A 2023 industry report noted that AI tools could cut model generation time by up to 80%, empowering faster product development cycles and responsiveness to market trends.
Democratization of 3D Content Creation: The development of user-friendly interfaces for Text-to-3D Software Market and Image-to-3D Software Market platforms allows individuals without extensive 3D design expertise to create complex models. This broadens the creator base, fostering innovation and reducing reliance on specialized talent, which aligns with trends in the broader Computer Graphics Software Market seeking user-friendly solutions. This expansion of accessible tools is leading to a substantial increase in generated 3D content from diverse sources.
Constraints:
Quality and Fidelity Limitations: Despite rapid advancements, AI-generated 3D models often require post-processing and manual refinement to achieve production-ready quality, especially for highly photorealistic or technically precise applications. Achieving perfect mesh topology, texture mapping, and material accuracy consistently remains a challenge, limiting autonomous deployment in high-stakes projects. This often necessitates human intervention, adding to overall project timelines and costs.
Computational Resource Intensity and Cost: Training and deploying advanced generative AI models for 3D content creation demand significant computational power, including high-performance GPUs and extensive data storage. This translates into substantial operational costs, particularly for smaller enterprises or individual creators, and highlights the reliance on cost-effective Cloud Computing Services Market. The energy consumption associated with large-scale AI operations also presents an environmental and economic consideration.
Intellectual Property and Data Sourcing Concerns: The ethical sourcing and licensing of training data for AI models present a significant constraint. Questions regarding copyright ownership of generated assets and the potential for models to reproduce copyrighted material are critical legal hurdles. The lack of clear regulatory frameworks surrounding AI-generated content creates uncertainty, impacting the confidence of businesses and creators in utilizing the AI Training Data Market for model development and commercial deployment.
Competitive Ecosystem of the Ai Generated 3d Models Market
The Ai Generated 3d Models Market is characterized by a dynamic competitive landscape, encompassing established tech giants, specialized AI startups, and traditional 3D software providers. Innovation in generative AI and cloud-based platforms is driving market differentiation.
- Google DeepMind: A leading AI research lab, pushing boundaries in generative AI, including multi-modal models that can translate text/images into complex 3D structures, often setting industry benchmarks for AI capabilities.
- Adobe: A major player in creative software, integrating AI tools (e.g., Sensei) into its suite to streamline 3D content creation workflows, thereby enhancing its offerings within the 3D Modeling Software Market and expanding creative possibilities for its users.
- Microsoft: Investing heavily in AI research and cloud infrastructure (Azure), developing foundational models and platforms that support AI-driven 3D generation across various applications, from gaming to enterprise solutions.
- Tencent: A Chinese multinational tech conglomerate with significant investments in gaming and AI, actively exploring AI-powered tools for game asset generation, virtual world creation, and content production for its vast digital ecosystem.
- OpenAI: A pioneer in generative AI, known for models like DALL-E and GPT, which are foundational to advanced text-to-3D capabilities and broader Artificial Intelligence Software Market innovation, pushing the frontiers of what AI can create.
- Autodesk Inc.: A global leader in 3D design, engineering, and entertainment software, integrating AI features into its established tools (e.g., Maya, 3ds Max) to enhance automation and efficiency in 3D asset production for professional users.
- Luma AI: Specializing in generative AI for 3D, known for its "Text-to-3D" and NeRF (Neural Radiance Fields) technologies, making complex 3D capture and generation accessible to a wider audience with impressive visual fidelity.
- MESHY LLC.: An emerging player focused on developing user-friendly AI-powered tools for generating 3D models from text and images, catering to a wide range of creators, from hobbyists to professional developers.
- Spline, Inc.: Offers a collaborative 3D design tool that leverages AI to simplify creation and animation, making it easier for designers to produce interactive 3D content for web and mobile platforms with advanced visual effects.
- Kaedim Inc.: Provides an AI-powered platform to convert 2D images and videos into high-quality 3D models, significantly accelerating asset creation for game developers and other industries requiring rapid iteration.
- Sloyd: Focuses on instant 3D model generation through AI, offering a vast library and custom creation tools for rapid prototyping and deployment in various applications, particularly in virtual environments.
- Others: This category includes a diverse group of innovative startups and smaller firms continually developing specialized solutions and pushing the boundaries of AI-driven 3D content creation in niche segments of the Ai Generated 3d Models Market.
Recent Developments & Milestones in the Ai Generated 3d Models Market
Key advancements and strategic shifts are continually shaping the Ai Generated 3d Models Market, driven by breakthroughs in AI research and increasing industry adoption.
- Mid-2023: Several major AI research labs and technology companies announced significant advancements in "Text-to-3D" generative models, showcasing improved fidelity, semantic understanding, and faster generation times for complex objects and scenes.
- Late 2023: Integration of AI-powered 3D model generation capabilities into mainstream 3D modeling software suites, enhancing productivity for professional designers and artists by automating repetitive tasks and enabling rapid conceptualization.
- Early 2024: Emergence of new startups specializing in specific applications of AI-generated 3D models, such as rapid asset creation for indie game developers, architectural visualization, and specialized content for the Gaming & Entertainment Market.
- Early 2024: Increased investment and research focus on developing efficient neural rendering techniques, like NeRFs (Neural Radiance Fields) and Gaussian Splatting, to produce high-quality 3D assets directly from 2D inputs, minimizing manual post-processing efforts and reducing computational overhead.
- Mid-2024: Growing collaboration between AI companies and major cloud service providers to offer scalable infrastructure for training and deploying large-scale 3D generation models, critical for meeting the demands of the Cloud Computing Services Market and enabling more complex model architectures.
- Mid-2024: Significant progress in developing hybrid AI models that combine the strengths of Text-to-3D Software Market and Image-to-3D Software Market approaches, allowing for more nuanced control and higher quality outputs, addressing the diverse needs of the 3D Modeling Software Market.
Regional Market Breakdown for Ai Generated 3d Models Market
The Ai Generated 3d Models Market exhibits varied growth dynamics and adoption rates across key regions, influenced by technological infrastructure, industry concentration, and investment in AI. While precise regional market sizes and CAGRs are proprietary, general trends indicate distinct patterns.
North America holds a substantial share of the global Ai Generated 3d Models Market, estimated at approximately 35-40% of total revenue. This dominance is driven by a robust ecosystem of leading AI research institutions, major tech companies (Google DeepMind, Microsoft, Adobe), and significant venture capital investment in generative AI startups. The region benefits from early adoption across the Gaming & Entertainment Market, product design, and advertising sectors. The projected regional CAGR is around 6.8%, indicating mature but consistent growth, primarily fueled by continuous innovation and integration into enterprise workflows.
Europe accounts for an estimated 25-30% of the market share, driven by strong design and manufacturing industries, coupled with increasing digital transformation initiatives. Countries like Germany, France, and the UK are investing in AI research and application, fostering a competitive landscape for the Artificial Intelligence Software Market. The regional CAGR is estimated at 7.1%, reflecting steady growth as businesses adopt AI-powered tools to enhance efficiency in design and content creation.
Asia Pacific is identified as the fastest-growing region in the Ai Generated 3d Models Market, with an estimated CAGR of 8.5% and a projected market share of 20-25%. This rapid expansion is primarily propelled by the burgeoning digital economies in China, India, Japan, and South Korea. Factors such as rapid urbanization, a massive consumer base for digital entertainment, substantial investments in AI infrastructure, and a booming Gaming & Entertainment Market are accelerating the adoption of AI-generated 3D models. Companies like Tencent are leading significant advancements in this domain. The region is quickly becoming a hub for both AI development and deployment.
Middle East & Africa (MEA) and South America collectively represent the remaining market share, estimated between 10-15%, with an aggregated CAGR around 7.0%. MEA is an emerging market, driven by smart city initiatives, digital economy diversification efforts, and increasing investment in digital media and advertising, creating new demand for scalable 3D content. South America shows localized growth opportunities, particularly in entertainment, marketing, and architectural visualization, as digital infrastructure improves and awareness of AI benefits expands.
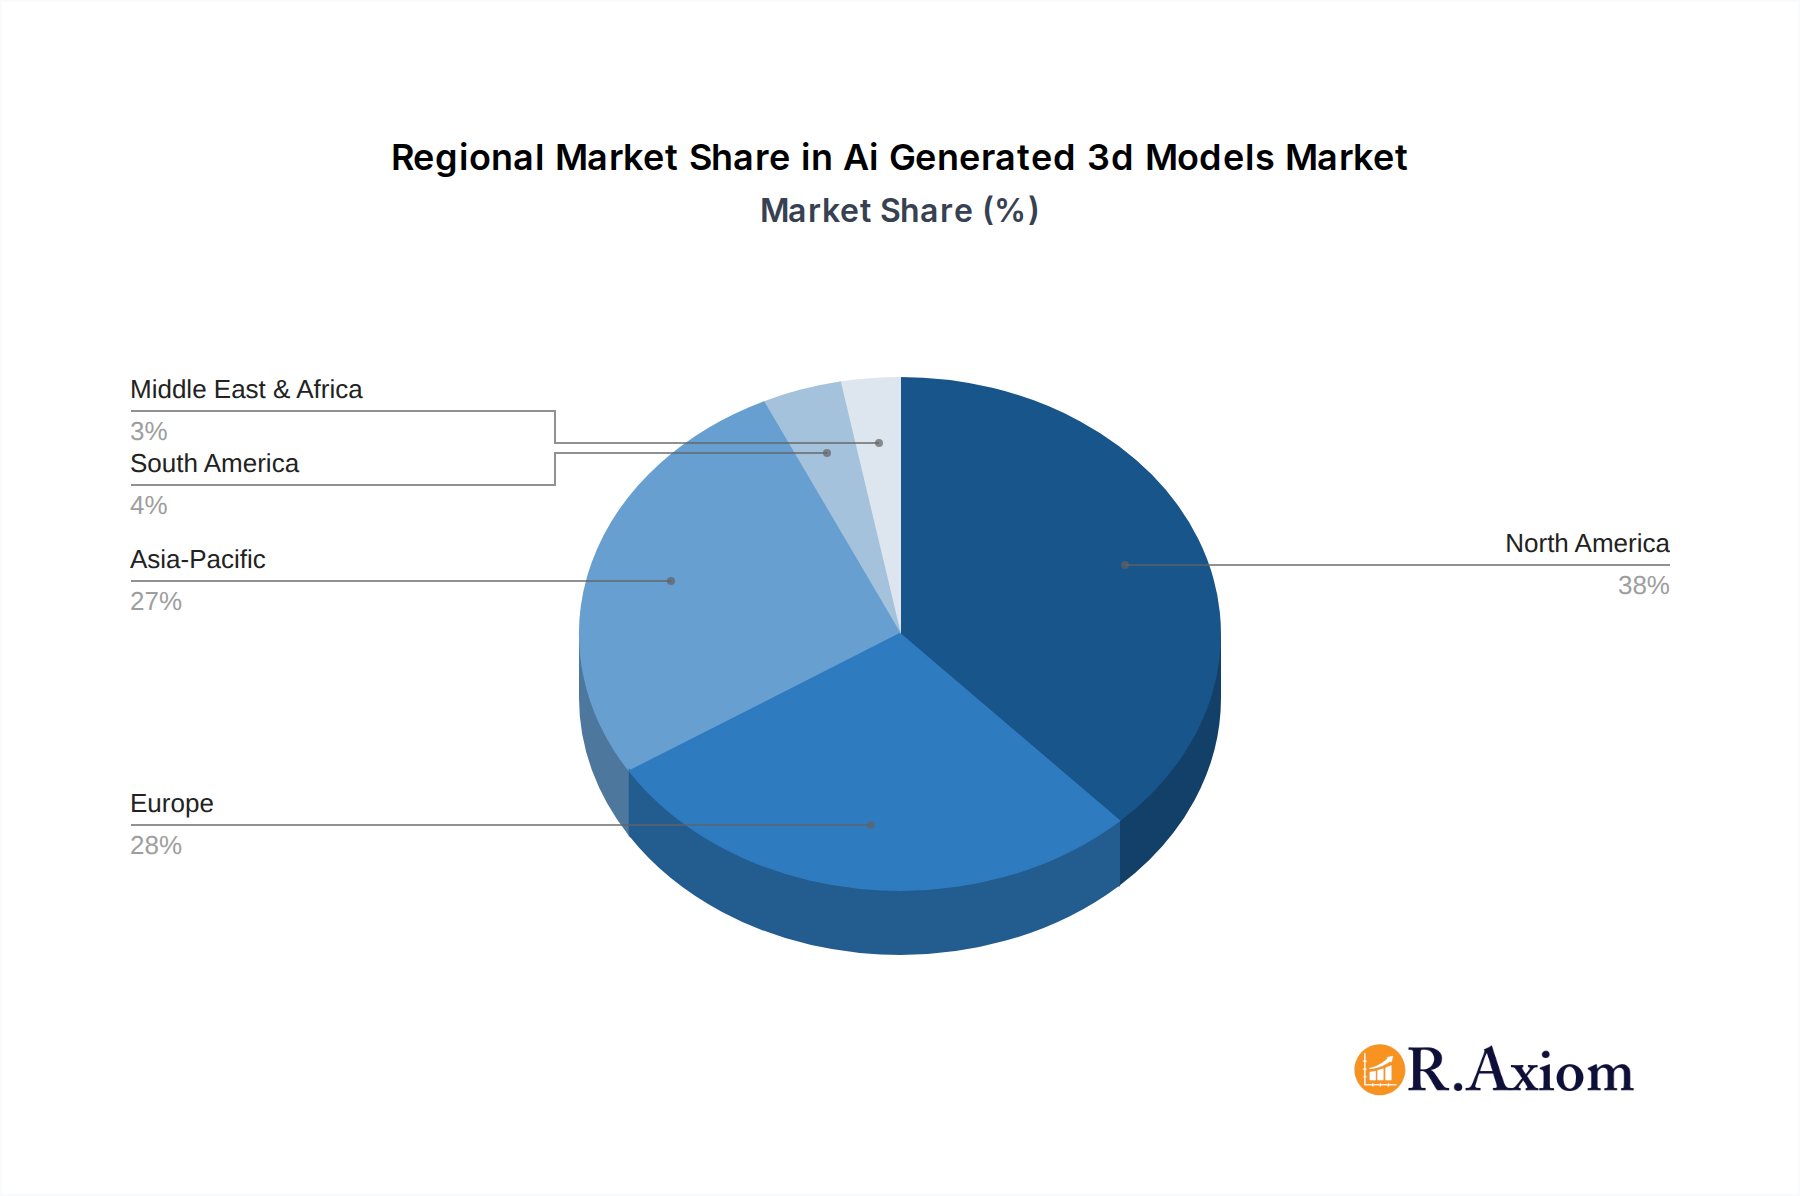
Ai Generated 3d Models Regional Market Share
Technology Innovation Trajectory in the Ai Generated 3d Models Market
The Ai Generated 3d Models Market is experiencing a rapid evolution driven by several disruptive technological innovations that are reshaping content creation paradigms. These advancements threaten traditional manual modeling workflows while simultaneously reinforcing new business models centered on AI-assisted design.
Generative AI Models (Diffusion Models & GANs): These foundational models, particularly diffusion models, are at the core of the current Ai Generated 3d Models Market. They enable high-fidelity generation from various inputs, giving rise to the Text-to-3D Software Market and Image-to-3D Software Market. Adoption is accelerating rapidly, with significant R&D investment from companies like OpenAI, Google DeepMind, and Adobe. These models are democratizing 3D creation, drastically cutting down asset production time, and shifting creative focus from intricate manual modeling to prompt engineering and refinement. They directly threaten traditional 3D artists involved in repetitive asset creation, while enabling them to become high-level art directors.
Neural Radiance Fields (NeRFs) and Gaussian Splatting: These emerging techniques represent a paradigm shift in capturing and rendering 3D scenes. NeRFs create incredibly realistic 3D representations from a few 2D images or videos, offering superior visual quality and continuous scene representation compared to traditional mesh-based models. Gaussian Splatting further optimizes this, significantly improving real-time rendering performance. While still in early to mid-stage adoption, R&D from entities like Luma AI is pushing these technologies toward broader commercial viability. They pose a significant threat to traditional photogrammetry and established 3D capture methods due to their fidelity and ease of use, simultaneously opening new avenues for immersive content creation in the Virtual Reality Content Market.
Foundation Models for 3D: Similar to large language models, the development of massive, pre-trained AI models specifically designed for 3D generation and manipulation is on the horizon. These models, trained on vast datasets of 3D objects and scenes, aim to provide a universal backbone for various 3D tasks, from asset generation to scene composition. This represents significant R&D investment from major tech players and will fundamentally transform the entire 3D Modeling Software Market. Such models promise unparalleled consistency, scalability, and semantic understanding, potentially rendering many current specialized 3D tools obsolete unless they integrate deeply with these new foundational architectures.
Supply Chain & Raw Material Dynamics for the Ai Generated 3d Models Market
The Ai Generated 3d Models Market, while primarily software-driven, has critical upstream dependencies on hardware, data, and infrastructure that form its unique supply chain. Understanding these dynamics is crucial for assessing market resilience and growth potential.
Upstream dependencies are largely concentrated on high-performance computing components. Specialized processors, predominantly Graphics Processing Units (GPUs) from manufacturers like NVIDIA and AMD, are the fundamental "raw material" enabling the intensive computations required for training and inference of generative AI models. These are essential for the efficient operation of both the Text-to-3D Software Market and Image-to-3D Software Market. Furthermore, access to extensive and diverse datasets forms the bedrock of the AI Training Data Market, which is critical for developing and refining robust AI models.
Sourcing risks are significant. Geopolitical tensions and global events, such as the semiconductor chip shortage experienced between 2020 and 2022, directly impact the availability and pricing of high-end GPUs. This can constrain the development and deployment of new AI models and increase operational costs for service providers. Ethical sourcing of training data is another growing concern, with legal and reputational risks associated with using improperly licensed or biased datasets, potentially affecting the quality and fairness of generated 3D models.
Price volatility of key inputs includes fluctuations in the cost of high-performance hardware, which can be influenced by demand from other sectors (e.g., cryptocurrency mining booms) and global supply chain disruptions. Energy costs for operating large-scale data centers, which provide the Cloud Computing Services Market infrastructure for AI model training and inference, also contribute to overall operational expenses. The price trends for silicon, a core component of chips, have generally been upward due to global demand across all technology sectors, impacting the long-term cost structure.
Historically, supply chain disruptions, particularly those affecting semiconductor manufacturing, have led to delays in AI model development and increased capital expenditure for companies in the Ai Generated 3d Models Market. The reliability of the Cloud Computing Services Market, which provides scalable computational resources, is also a critical factor. Any outages or cost increases in these services can directly impact the operational continuity and profitability of AI 3D generation platforms.
Ai Generated 3d Models Segmentation
-
1. Type
- 1.1. Text-to-3D
- 1.2. Image-to-3D
- 1.3. Hybrid
-
2. Output Representation
- 2.1. Mesh
- 2.2. Voxel
- 2.3. Point Cloud
- 2.4. Others
-
3. Level of Detail
- 3.1. LOD0
- 3.2. LOD1
- 3.3. LOD2
- 3.4. Others
-
4. LOD Techniques
- 4.1. Discrete LOD
- 4.2. Continuous LOD
-
5. End-use Industry
- 5.1. Marketing & Advertising
- 5.2. Healthcare & Pharma
- 5.3. Gaming & Entertainment
- 5.4. Manufacturing & Product Design
- 5.5. Others
Ai Generated 3d Models Segmentation By Geography
-
1. North America
- 1.1. United States
- 1.2. Canada
- 1.3. Mexico
-
2. South America
- 2.1. Brazil
- 2.2. Argentina
- 2.3. Rest of South America
-
3. Europe
- 3.1. United Kingdom
- 3.2. Germany
- 3.3. France
- 3.4. Italy
- 3.5. Spain
- 3.6. Russia
- 3.7. Benelux
- 3.8. Nordics
- 3.9. Rest of Europe
-
4. Middle East & Africa
- 4.1. Turkey
- 4.2. Israel
- 4.3. GCC
- 4.4. North Africa
- 4.5. South Africa
- 4.6. Rest of Middle East & Africa
-
5. Asia Pacific
- 5.1. China
- 5.2. India
- 5.3. Japan
- 5.4. South Korea
- 5.5. ASEAN
- 5.6. Oceania
- 5.7. Rest of Asia Pacific
Ai Generated 3d Models Regional Market Share
Geographic Coverage of Ai Generated 3d Models
Ai Generated 3d Models REPORT HIGHLIGHTS
| Aspects | Details |
|---|---|
| Study Period | 2020-2034 |
| Base Year | 2025 |
| Estimated Year | 2026 |
| Forecast Period | 2026-2034 |
| Historical Period | 2020-2025 |
| Growth Rate | CAGR of 7.4% from 2020-2034 |
| Segmentation |
|
Table of Contents
- 1. Introduction
- 1.1. Research Scope
- 1.2. Market Segmentation
- 1.3. Research Objective
- 1.4. Definitions and Assumptions
- 2. Executive Summary
- 2.1. Market Snapshot
- 3. Market Dynamics
- 3.1. Market Drivers
- 3.2. Market Restrains
- 3.3. Market Trends
- 3.4. Market Opportunities
- 4. Market Factor Analysis
- 4.1. Porters Five Forces
- 4.1.1. Bargaining Power of Suppliers
- 4.1.2. Bargaining Power of Buyers
- 4.1.3. Threat of New Entrants
- 4.1.4. Threat of Substitutes
- 4.1.5. Competitive Rivalry
- 4.2. PESTEL analysis
- 4.3. BCG Analysis
- 4.3.1. Stars (High Growth, High Market Share)
- 4.3.2. Cash Cows (Low Growth, High Market Share)
- 4.3.3. Question Mark (High Growth, Low Market Share)
- 4.3.4. Dogs (Low Growth, Low Market Share)
- 4.4. Ansoff Matrix Analysis
- 4.5. Supply Chain Analysis
- 4.6. Regulatory Landscape
- 4.7. Current Market Potential and Opportunity Assessment (TAM–SAM–SOM Framework)
- 4.8. RAX Analyst Note
- 4.1. Porters Five Forces
- 5. Market Analysis, Insights and Forecast 2021-2033
- 5.1. Market Analysis, Insights and Forecast - by Type
- 5.1.1. Text-to-3D
- 5.1.2. Image-to-3D
- 5.1.3. Hybrid
- 5.2. Market Analysis, Insights and Forecast - by Output Representation
- 5.2.1. Mesh
- 5.2.2. Voxel
- 5.2.3. Point Cloud
- 5.2.4. Others
- 5.3. Market Analysis, Insights and Forecast - by Level of Detail
- 5.3.1. LOD0
- 5.3.2. LOD1
- 5.3.3. LOD2
- 5.3.4. Others
- 5.4. Market Analysis, Insights and Forecast - by LOD Techniques
- 5.4.1. Discrete LOD
- 5.4.2. Continuous LOD
- 5.5. Market Analysis, Insights and Forecast - by End-use Industry
- 5.5.1. Marketing & Advertising
- 5.5.2. Healthcare & Pharma
- 5.5.3. Gaming & Entertainment
- 5.5.4. Manufacturing & Product Design
- 5.5.5. Others
- 5.6. Market Analysis, Insights and Forecast - by Region
- 5.6.1. North America
- 5.6.2. South America
- 5.6.3. Europe
- 5.6.4. Middle East & Africa
- 5.6.5. Asia Pacific
- 5.1. Market Analysis, Insights and Forecast - by Type
- 6. Global Ai Generated 3d Models Analysis, Insights and Forecast, 2021-2033
- 6.1. Market Analysis, Insights and Forecast - by Type
- 6.1.1. Text-to-3D
- 6.1.2. Image-to-3D
- 6.1.3. Hybrid
- 6.2. Market Analysis, Insights and Forecast - by Output Representation
- 6.2.1. Mesh
- 6.2.2. Voxel
- 6.2.3. Point Cloud
- 6.2.4. Others
- 6.3. Market Analysis, Insights and Forecast - by Level of Detail
- 6.3.1. LOD0
- 6.3.2. LOD1
- 6.3.3. LOD2
- 6.3.4. Others
- 6.4. Market Analysis, Insights and Forecast - by LOD Techniques
- 6.4.1. Discrete LOD
- 6.4.2. Continuous LOD
- 6.5. Market Analysis, Insights and Forecast - by End-use Industry
- 6.5.1. Marketing & Advertising
- 6.5.2. Healthcare & Pharma
- 6.5.3. Gaming & Entertainment
- 6.5.4. Manufacturing & Product Design
- 6.5.5. Others
- 6.1. Market Analysis, Insights and Forecast - by Type
- 7. North America Ai Generated 3d Models Analysis, Insights and Forecast, 2020-2032
- 7.1. Market Analysis, Insights and Forecast - by Type
- 7.1.1. Text-to-3D
- 7.1.2. Image-to-3D
- 7.1.3. Hybrid
- 7.2. Market Analysis, Insights and Forecast - by Output Representation
- 7.2.1. Mesh
- 7.2.2. Voxel
- 7.2.3. Point Cloud
- 7.2.4. Others
- 7.3. Market Analysis, Insights and Forecast - by Level of Detail
- 7.3.1. LOD0
- 7.3.2. LOD1
- 7.3.3. LOD2
- 7.3.4. Others
- 7.4. Market Analysis, Insights and Forecast - by LOD Techniques
- 7.4.1. Discrete LOD
- 7.4.2. Continuous LOD
- 7.5. Market Analysis, Insights and Forecast - by End-use Industry
- 7.5.1. Marketing & Advertising
- 7.5.2. Healthcare & Pharma
- 7.5.3. Gaming & Entertainment
- 7.5.4. Manufacturing & Product Design
- 7.5.5. Others
- 7.1. Market Analysis, Insights and Forecast - by Type
- 8. South America Ai Generated 3d Models Analysis, Insights and Forecast, 2020-2032
- 8.1. Market Analysis, Insights and Forecast - by Type
- 8.1.1. Text-to-3D
- 8.1.2. Image-to-3D
- 8.1.3. Hybrid
- 8.2. Market Analysis, Insights and Forecast - by Output Representation
- 8.2.1. Mesh
- 8.2.2. Voxel
- 8.2.3. Point Cloud
- 8.2.4. Others
- 8.3. Market Analysis, Insights and Forecast - by Level of Detail
- 8.3.1. LOD0
- 8.3.2. LOD1
- 8.3.3. LOD2
- 8.3.4. Others
- 8.4. Market Analysis, Insights and Forecast - by LOD Techniques
- 8.4.1. Discrete LOD
- 8.4.2. Continuous LOD
- 8.5. Market Analysis, Insights and Forecast - by End-use Industry
- 8.5.1. Marketing & Advertising
- 8.5.2. Healthcare & Pharma
- 8.5.3. Gaming & Entertainment
- 8.5.4. Manufacturing & Product Design
- 8.5.5. Others
- 8.1. Market Analysis, Insights and Forecast - by Type
- 9. Europe Ai Generated 3d Models Analysis, Insights and Forecast, 2020-2032
- 9.1. Market Analysis, Insights and Forecast - by Type
- 9.1.1. Text-to-3D
- 9.1.2. Image-to-3D
- 9.1.3. Hybrid
- 9.2. Market Analysis, Insights and Forecast - by Output Representation
- 9.2.1. Mesh
- 9.2.2. Voxel
- 9.2.3. Point Cloud
- 9.2.4. Others
- 9.3. Market Analysis, Insights and Forecast - by Level of Detail
- 9.3.1. LOD0
- 9.3.2. LOD1
- 9.3.3. LOD2
- 9.3.4. Others
- 9.4. Market Analysis, Insights and Forecast - by LOD Techniques
- 9.4.1. Discrete LOD
- 9.4.2. Continuous LOD
- 9.5. Market Analysis, Insights and Forecast - by End-use Industry
- 9.5.1. Marketing & Advertising
- 9.5.2. Healthcare & Pharma
- 9.5.3. Gaming & Entertainment
- 9.5.4. Manufacturing & Product Design
- 9.5.5. Others
- 9.1. Market Analysis, Insights and Forecast - by Type
- 10. Middle East & Africa Ai Generated 3d Models Analysis, Insights and Forecast, 2020-2032
- 10.1. Market Analysis, Insights and Forecast - by Type
- 10.1.1. Text-to-3D
- 10.1.2. Image-to-3D
- 10.1.3. Hybrid
- 10.2. Market Analysis, Insights and Forecast - by Output Representation
- 10.2.1. Mesh
- 10.2.2. Voxel
- 10.2.3. Point Cloud
- 10.2.4. Others
- 10.3. Market Analysis, Insights and Forecast - by Level of Detail
- 10.3.1. LOD0
- 10.3.2. LOD1
- 10.3.3. LOD2
- 10.3.4. Others
- 10.4. Market Analysis, Insights and Forecast - by LOD Techniques
- 10.4.1. Discrete LOD
- 10.4.2. Continuous LOD
- 10.5. Market Analysis, Insights and Forecast - by End-use Industry
- 10.5.1. Marketing & Advertising
- 10.5.2. Healthcare & Pharma
- 10.5.3. Gaming & Entertainment
- 10.5.4. Manufacturing & Product Design
- 10.5.5. Others
- 10.1. Market Analysis, Insights and Forecast - by Type
- 11. Asia Pacific Ai Generated 3d Models Analysis, Insights and Forecast, 2020-2032
- 11.1. Market Analysis, Insights and Forecast - by Type
- 11.1.1. Text-to-3D
- 11.1.2. Image-to-3D
- 11.1.3. Hybrid
- 11.2. Market Analysis, Insights and Forecast - by Output Representation
- 11.2.1. Mesh
- 11.2.2. Voxel
- 11.2.3. Point Cloud
- 11.2.4. Others
- 11.3. Market Analysis, Insights and Forecast - by Level of Detail
- 11.3.1. LOD0
- 11.3.2. LOD1
- 11.3.3. LOD2
- 11.3.4. Others
- 11.4. Market Analysis, Insights and Forecast - by LOD Techniques
- 11.4.1. Discrete LOD
- 11.4.2. Continuous LOD
- 11.5. Market Analysis, Insights and Forecast - by End-use Industry
- 11.5.1. Marketing & Advertising
- 11.5.2. Healthcare & Pharma
- 11.5.3. Gaming & Entertainment
- 11.5.4. Manufacturing & Product Design
- 11.5.5. Others
- 11.1. Market Analysis, Insights and Forecast - by Type
- 12. Competitive Analysis
- 12.1. Company Profiles
- 12.1.1 Google DeepMind
- 12.1.1.1. Company Overview
- 12.1.1.2. Products
- 12.1.1.3. Company Financials
- 12.1.1.4. SWOT Analysis
- 12.1.2 Adobe
- 12.1.2.1. Company Overview
- 12.1.2.2. Products
- 12.1.2.3. Company Financials
- 12.1.2.4. SWOT Analysis
- 12.1.3 Microsoft
- 12.1.3.1. Company Overview
- 12.1.3.2. Products
- 12.1.3.3. Company Financials
- 12.1.3.4. SWOT Analysis
- 12.1.4 Tencent
- 12.1.4.1. Company Overview
- 12.1.4.2. Products
- 12.1.4.3. Company Financials
- 12.1.4.4. SWOT Analysis
- 12.1.5 OpenAI
- 12.1.5.1. Company Overview
- 12.1.5.2. Products
- 12.1.5.3. Company Financials
- 12.1.5.4. SWOT Analysis
- 12.1.6 Autodesk Inc.
- 12.1.6.1. Company Overview
- 12.1.6.2. Products
- 12.1.6.3. Company Financials
- 12.1.6.4. SWOT Analysis
- 12.1.7 Luma AI
- 12.1.7.1. Company Overview
- 12.1.7.2. Products
- 12.1.7.3. Company Financials
- 12.1.7.4. SWOT Analysis
- 12.1.8 MESHY LLC.
- 12.1.8.1. Company Overview
- 12.1.8.2. Products
- 12.1.8.3. Company Financials
- 12.1.8.4. SWOT Analysis
- 12.1.9 Spline Inc.
- 12.1.9.1. Company Overview
- 12.1.9.2. Products
- 12.1.9.3. Company Financials
- 12.1.9.4. SWOT Analysis
- 12.1.10 Kaedim Inc.
- 12.1.10.1. Company Overview
- 12.1.10.2. Products
- 12.1.10.3. Company Financials
- 12.1.10.4. SWOT Analysis
- 12.1.11 Sloyd
- 12.1.11.1. Company Overview
- 12.1.11.2. Products
- 12.1.11.3. Company Financials
- 12.1.11.4. SWOT Analysis
- 12.1.12 Others
- 12.1.12.1. Company Overview
- 12.1.12.2. Products
- 12.1.12.3. Company Financials
- 12.1.12.4. SWOT Analysis
- 12.1.1 Google DeepMind
- 12.2. Market Entropy
- 12.2.1 Company's Key Areas Served
- 12.2.2 Recent Developments
- 12.3. Company Market Share Analysis 2025
- 12.3.1 Top 5 Companies Market Share Analysis
- 12.3.2 Top 3 Companies Market Share Analysis
- 12.4. List of Potential Customers
- 13. Research Methodology
List of Figures
- Figure 1: Global Ai Generated 3d Models Revenue Breakdown (million, %) by Region 2025 & 2033
- Figure 2: North America Ai Generated 3d Models Revenue (million), by Type 2025 & 2033
- Figure 3: North America Ai Generated 3d Models Revenue Share (%), by Type 2025 & 2033
- Figure 4: North America Ai Generated 3d Models Revenue (million), by Output Representation 2025 & 2033
- Figure 5: North America Ai Generated 3d Models Revenue Share (%), by Output Representation 2025 & 2033
- Figure 6: North America Ai Generated 3d Models Revenue (million), by Level of Detail 2025 & 2033
- Figure 7: North America Ai Generated 3d Models Revenue Share (%), by Level of Detail 2025 & 2033
- Figure 8: North America Ai Generated 3d Models Revenue (million), by LOD Techniques 2025 & 2033
- Figure 9: North America Ai Generated 3d Models Revenue Share (%), by LOD Techniques 2025 & 2033
- Figure 10: North America Ai Generated 3d Models Revenue (million), by End-use Industry 2025 & 2033
- Figure 11: North America Ai Generated 3d Models Revenue Share (%), by End-use Industry 2025 & 2033
- Figure 12: North America Ai Generated 3d Models Revenue (million), by Country 2025 & 2033
- Figure 13: North America Ai Generated 3d Models Revenue Share (%), by Country 2025 & 2033
- Figure 14: South America Ai Generated 3d Models Revenue (million), by Type 2025 & 2033
- Figure 15: South America Ai Generated 3d Models Revenue Share (%), by Type 2025 & 2033
- Figure 16: South America Ai Generated 3d Models Revenue (million), by Output Representation 2025 & 2033
- Figure 17: South America Ai Generated 3d Models Revenue Share (%), by Output Representation 2025 & 2033
- Figure 18: South America Ai Generated 3d Models Revenue (million), by Level of Detail 2025 & 2033
- Figure 19: South America Ai Generated 3d Models Revenue Share (%), by Level of Detail 2025 & 2033
- Figure 20: South America Ai Generated 3d Models Revenue (million), by LOD Techniques 2025 & 2033
- Figure 21: South America Ai Generated 3d Models Revenue Share (%), by LOD Techniques 2025 & 2033
- Figure 22: South America Ai Generated 3d Models Revenue (million), by End-use Industry 2025 & 2033
- Figure 23: South America Ai Generated 3d Models Revenue Share (%), by End-use Industry 2025 & 2033
- Figure 24: South America Ai Generated 3d Models Revenue (million), by Country 2025 & 2033
- Figure 25: South America Ai Generated 3d Models Revenue Share (%), by Country 2025 & 2033
- Figure 26: Europe Ai Generated 3d Models Revenue (million), by Type 2025 & 2033
- Figure 27: Europe Ai Generated 3d Models Revenue Share (%), by Type 2025 & 2033
- Figure 28: Europe Ai Generated 3d Models Revenue (million), by Output Representation 2025 & 2033
- Figure 29: Europe Ai Generated 3d Models Revenue Share (%), by Output Representation 2025 & 2033
- Figure 30: Europe Ai Generated 3d Models Revenue (million), by Level of Detail 2025 & 2033
- Figure 31: Europe Ai Generated 3d Models Revenue Share (%), by Level of Detail 2025 & 2033
- Figure 32: Europe Ai Generated 3d Models Revenue (million), by LOD Techniques 2025 & 2033
- Figure 33: Europe Ai Generated 3d Models Revenue Share (%), by LOD Techniques 2025 & 2033
- Figure 34: Europe Ai Generated 3d Models Revenue (million), by End-use Industry 2025 & 2033
- Figure 35: Europe Ai Generated 3d Models Revenue Share (%), by End-use Industry 2025 & 2033
- Figure 36: Europe Ai Generated 3d Models Revenue (million), by Country 2025 & 2033
- Figure 37: Europe Ai Generated 3d Models Revenue Share (%), by Country 2025 & 2033
- Figure 38: Middle East & Africa Ai Generated 3d Models Revenue (million), by Type 2025 & 2033
- Figure 39: Middle East & Africa Ai Generated 3d Models Revenue Share (%), by Type 2025 & 2033
- Figure 40: Middle East & Africa Ai Generated 3d Models Revenue (million), by Output Representation 2025 & 2033
- Figure 41: Middle East & Africa Ai Generated 3d Models Revenue Share (%), by Output Representation 2025 & 2033
- Figure 42: Middle East & Africa Ai Generated 3d Models Revenue (million), by Level of Detail 2025 & 2033
- Figure 43: Middle East & Africa Ai Generated 3d Models Revenue Share (%), by Level of Detail 2025 & 2033
- Figure 44: Middle East & Africa Ai Generated 3d Models Revenue (million), by LOD Techniques 2025 & 2033
- Figure 45: Middle East & Africa Ai Generated 3d Models Revenue Share (%), by LOD Techniques 2025 & 2033
- Figure 46: Middle East & Africa Ai Generated 3d Models Revenue (million), by End-use Industry 2025 & 2033
- Figure 47: Middle East & Africa Ai Generated 3d Models Revenue Share (%), by End-use Industry 2025 & 2033
- Figure 48: Middle East & Africa Ai Generated 3d Models Revenue (million), by Country 2025 & 2033
- Figure 49: Middle East & Africa Ai Generated 3d Models Revenue Share (%), by Country 2025 & 2033
- Figure 50: Asia Pacific Ai Generated 3d Models Revenue (million), by Type 2025 & 2033
- Figure 51: Asia Pacific Ai Generated 3d Models Revenue Share (%), by Type 2025 & 2033
- Figure 52: Asia Pacific Ai Generated 3d Models Revenue (million), by Output Representation 2025 & 2033
- Figure 53: Asia Pacific Ai Generated 3d Models Revenue Share (%), by Output Representation 2025 & 2033
- Figure 54: Asia Pacific Ai Generated 3d Models Revenue (million), by Level of Detail 2025 & 2033
- Figure 55: Asia Pacific Ai Generated 3d Models Revenue Share (%), by Level of Detail 2025 & 2033
- Figure 56: Asia Pacific Ai Generated 3d Models Revenue (million), by LOD Techniques 2025 & 2033
- Figure 57: Asia Pacific Ai Generated 3d Models Revenue Share (%), by LOD Techniques 2025 & 2033
- Figure 58: Asia Pacific Ai Generated 3d Models Revenue (million), by End-use Industry 2025 & 2033
- Figure 59: Asia Pacific Ai Generated 3d Models Revenue Share (%), by End-use Industry 2025 & 2033
- Figure 60: Asia Pacific Ai Generated 3d Models Revenue (million), by Country 2025 & 2033
- Figure 61: Asia Pacific Ai Generated 3d Models Revenue Share (%), by Country 2025 & 2033
List of Tables
- Table 1: Global Ai Generated 3d Models Revenue million Forecast, by Type 2020 & 2033
- Table 2: Global Ai Generated 3d Models Revenue million Forecast, by Output Representation 2020 & 2033
- Table 3: Global Ai Generated 3d Models Revenue million Forecast, by Level of Detail 2020 & 2033
- Table 4: Global Ai Generated 3d Models Revenue million Forecast, by LOD Techniques 2020 & 2033
- Table 5: Global Ai Generated 3d Models Revenue million Forecast, by End-use Industry 2020 & 2033
- Table 6: Global Ai Generated 3d Models Revenue million Forecast, by Region 2020 & 2033
- Table 7: Global Ai Generated 3d Models Revenue million Forecast, by Type 2020 & 2033
- Table 8: Global Ai Generated 3d Models Revenue million Forecast, by Output Representation 2020 & 2033
- Table 9: Global Ai Generated 3d Models Revenue million Forecast, by Level of Detail 2020 & 2033
- Table 10: Global Ai Generated 3d Models Revenue million Forecast, by LOD Techniques 2020 & 2033
- Table 11: Global Ai Generated 3d Models Revenue million Forecast, by End-use Industry 2020 & 2033
- Table 12: Global Ai Generated 3d Models Revenue million Forecast, by Country 2020 & 2033
- Table 13: United States Ai Generated 3d Models Revenue (million) Forecast, by Application 2020 & 2033
- Table 14: Canada Ai Generated 3d Models Revenue (million) Forecast, by Application 2020 & 2033
- Table 15: Mexico Ai Generated 3d Models Revenue (million) Forecast, by Application 2020 & 2033
- Table 16: Global Ai Generated 3d Models Revenue million Forecast, by Type 2020 & 2033
- Table 17: Global Ai Generated 3d Models Revenue million Forecast, by Output Representation 2020 & 2033
- Table 18: Global Ai Generated 3d Models Revenue million Forecast, by Level of Detail 2020 & 2033
- Table 19: Global Ai Generated 3d Models Revenue million Forecast, by LOD Techniques 2020 & 2033
- Table 20: Global Ai Generated 3d Models Revenue million Forecast, by End-use Industry 2020 & 2033
- Table 21: Global Ai Generated 3d Models Revenue million Forecast, by Country 2020 & 2033
- Table 22: Brazil Ai Generated 3d Models Revenue (million) Forecast, by Application 2020 & 2033
- Table 23: Argentina Ai Generated 3d Models Revenue (million) Forecast, by Application 2020 & 2033
- Table 24: Rest of South America Ai Generated 3d Models Revenue (million) Forecast, by Application 2020 & 2033
- Table 25: Global Ai Generated 3d Models Revenue million Forecast, by Type 2020 & 2033
- Table 26: Global Ai Generated 3d Models Revenue million Forecast, by Output Representation 2020 & 2033
- Table 27: Global Ai Generated 3d Models Revenue million Forecast, by Level of Detail 2020 & 2033
- Table 28: Global Ai Generated 3d Models Revenue million Forecast, by LOD Techniques 2020 & 2033
- Table 29: Global Ai Generated 3d Models Revenue million Forecast, by End-use Industry 2020 & 2033
- Table 30: Global Ai Generated 3d Models Revenue million Forecast, by Country 2020 & 2033
- Table 31: United Kingdom Ai Generated 3d Models Revenue (million) Forecast, by Application 2020 & 2033
- Table 32: Germany Ai Generated 3d Models Revenue (million) Forecast, by Application 2020 & 2033
- Table 33: France Ai Generated 3d Models Revenue (million) Forecast, by Application 2020 & 2033
- Table 34: Italy Ai Generated 3d Models Revenue (million) Forecast, by Application 2020 & 2033
- Table 35: Spain Ai Generated 3d Models Revenue (million) Forecast, by Application 2020 & 2033
- Table 36: Russia Ai Generated 3d Models Revenue (million) Forecast, by Application 2020 & 2033
- Table 37: Benelux Ai Generated 3d Models Revenue (million) Forecast, by Application 2020 & 2033
- Table 38: Nordics Ai Generated 3d Models Revenue (million) Forecast, by Application 2020 & 2033
- Table 39: Rest of Europe Ai Generated 3d Models Revenue (million) Forecast, by Application 2020 & 2033
- Table 40: Global Ai Generated 3d Models Revenue million Forecast, by Type 2020 & 2033
- Table 41: Global Ai Generated 3d Models Revenue million Forecast, by Output Representation 2020 & 2033
- Table 42: Global Ai Generated 3d Models Revenue million Forecast, by Level of Detail 2020 & 2033
- Table 43: Global Ai Generated 3d Models Revenue million Forecast, by LOD Techniques 2020 & 2033
- Table 44: Global Ai Generated 3d Models Revenue million Forecast, by End-use Industry 2020 & 2033
- Table 45: Global Ai Generated 3d Models Revenue million Forecast, by Country 2020 & 2033
- Table 46: Turkey Ai Generated 3d Models Revenue (million) Forecast, by Application 2020 & 2033
- Table 47: Israel Ai Generated 3d Models Revenue (million) Forecast, by Application 2020 & 2033
- Table 48: GCC Ai Generated 3d Models Revenue (million) Forecast, by Application 2020 & 2033
- Table 49: North Africa Ai Generated 3d Models Revenue (million) Forecast, by Application 2020 & 2033
- Table 50: South Africa Ai Generated 3d Models Revenue (million) Forecast, by Application 2020 & 2033
- Table 51: Rest of Middle East & Africa Ai Generated 3d Models Revenue (million) Forecast, by Application 2020 & 2033
- Table 52: Global Ai Generated 3d Models Revenue million Forecast, by Type 2020 & 2033
- Table 53: Global Ai Generated 3d Models Revenue million Forecast, by Output Representation 2020 & 2033
- Table 54: Global Ai Generated 3d Models Revenue million Forecast, by Level of Detail 2020 & 2033
- Table 55: Global Ai Generated 3d Models Revenue million Forecast, by LOD Techniques 2020 & 2033
- Table 56: Global Ai Generated 3d Models Revenue million Forecast, by End-use Industry 2020 & 2033
- Table 57: Global Ai Generated 3d Models Revenue million Forecast, by Country 2020 & 2033
- Table 58: China Ai Generated 3d Models Revenue (million) Forecast, by Application 2020 & 2033
- Table 59: India Ai Generated 3d Models Revenue (million) Forecast, by Application 2020 & 2033
- Table 60: Japan Ai Generated 3d Models Revenue (million) Forecast, by Application 2020 & 2033
- Table 61: South Korea Ai Generated 3d Models Revenue (million) Forecast, by Application 2020 & 2033
- Table 62: ASEAN Ai Generated 3d Models Revenue (million) Forecast, by Application 2020 & 2033
- Table 63: Oceania Ai Generated 3d Models Revenue (million) Forecast, by Application 2020 & 2033
- Table 64: Rest of Asia Pacific Ai Generated 3d Models Revenue (million) Forecast, by Application 2020 & 2033
Frequently Asked Questions
1. What is the projected Compound Annual Growth Rate (CAGR) of the Ai Generated 3d Models?
The projected CAGR is approximately 7.4%.
2. Which companies are prominent players in the Ai Generated 3d Models?
Key companies in the market include Google DeepMind, Adobe, Microsoft , Tencent, OpenAI, Autodesk Inc. , Luma AI, MESHY LLC., Spline, Inc., Kaedim Inc., Sloyd, Others.
3. What are the main segments of the Ai Generated 3d Models?
The market segments include Type, Output Representation, Level of Detail, LOD Techniques, End-use Industry.
4. Can you provide details about the market size?
The market size is estimated to be USD 1253 million as of 2022.
5. What are some drivers contributing to market growth?
N/A
6. What are the notable trends driving market growth?
N/A
7. Are there any restraints impacting market growth?
N/A
8. Can you provide examples of recent developments in the market?
N/A
9. What pricing options are available for accessing the report?
Pricing options include single-user, multi-user, and enterprise licenses priced at USD 2900.00, USD 4350.00, and USD 5800.00 respectively.
10. Is the market size provided in terms of value or volume?
The market size is provided in terms of value, measured in million.
11. Are there any specific market keywords associated with the report?
Yes, the market keyword associated with the report is "Ai Generated 3d Models," which aids in identifying and referencing the specific market segment covered.
12. How do I determine which pricing option suits my needs best?
The pricing options vary based on user requirements and access needs. Individual users may opt for single-user licenses, while businesses requiring broader access may choose multi-user or enterprise licenses for cost-effective access to the report.
13. Are there any additional resources or data provided in the Ai Generated 3d Models report?
While the report offers comprehensive insights, it's advisable to review the specific contents or supplementary materials provided to ascertain if additional resources or data are available.
14. How can I stay updated on further developments or reports in the Ai Generated 3d Models?
To stay informed about further developments, trends, and reports in the Ai Generated 3d Models, consider subscribing to industry newsletters, following relevant companies and organizations, or regularly checking reputable industry news sources and publications.
Methodology
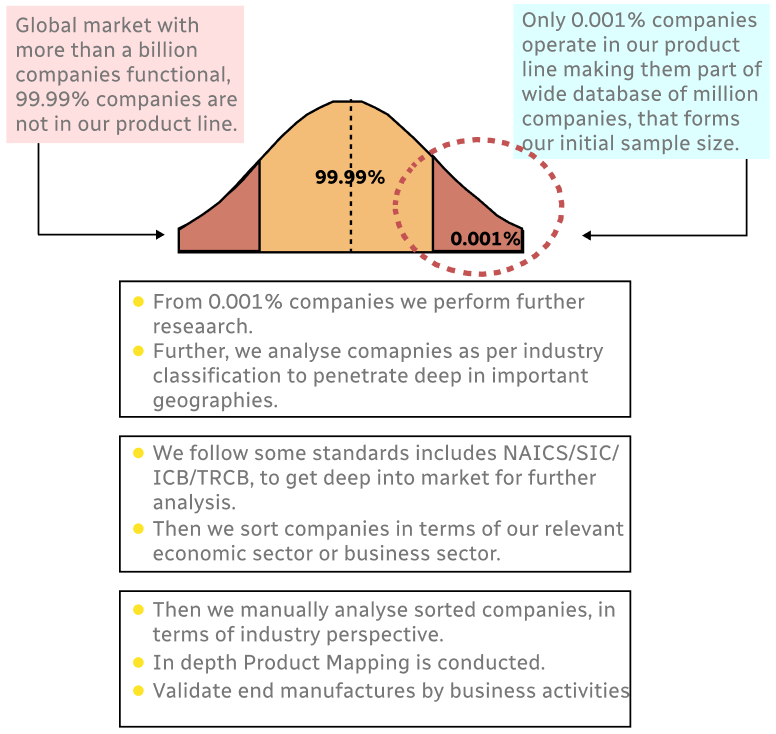
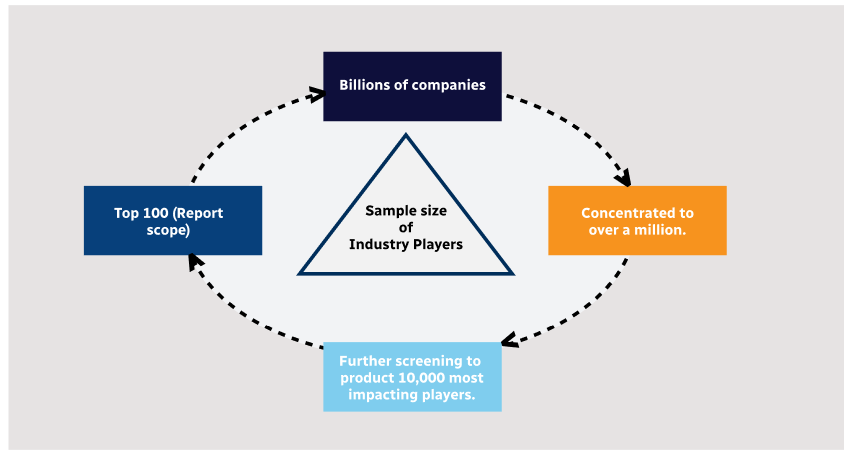
Step 1 - Identification of Relevant Samples Size from Population Database
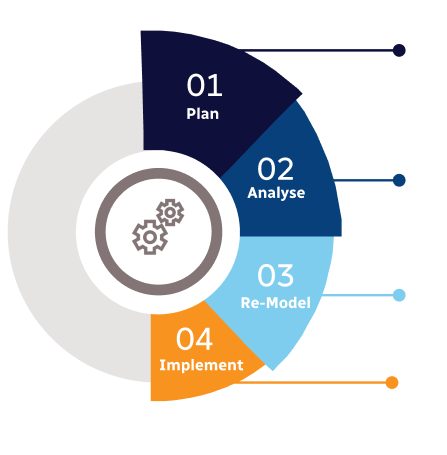
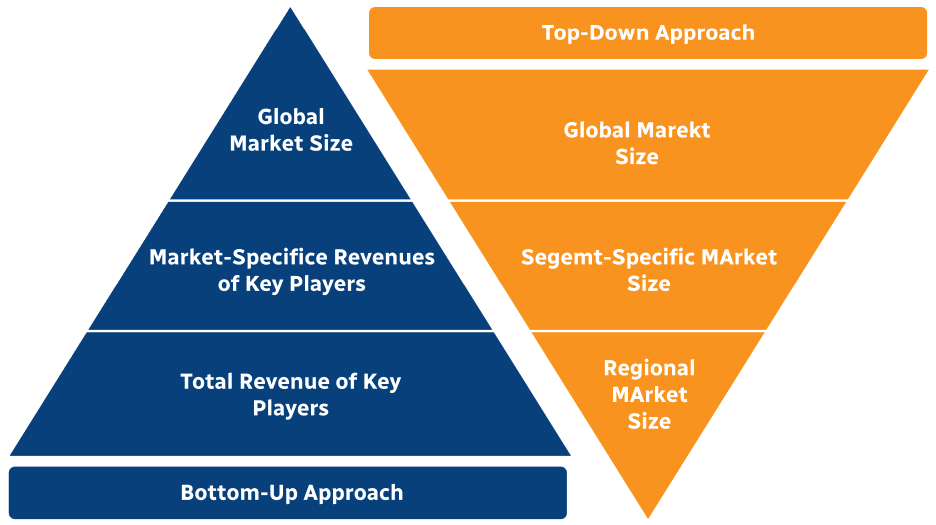
Step 2 - Approaches for Defining Global Market Size (Value, Volume* & Price*)
Note*: In applicable scenarios
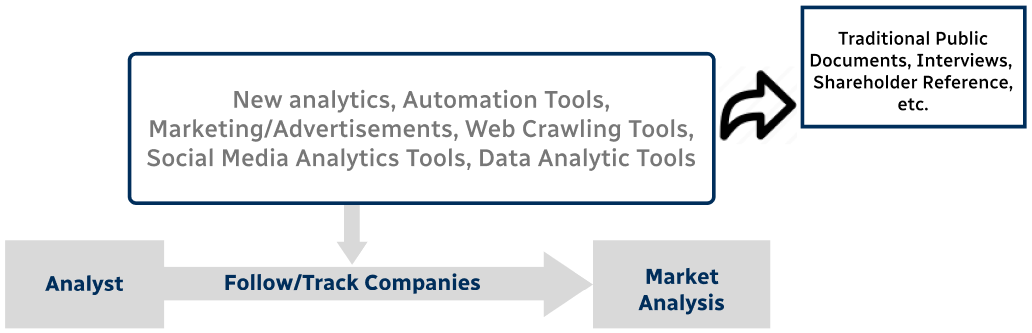
Step 3 - Data Sources
Primary Research
- Web Analytics
- Survey Reports
- Research Institute
- Latest Research Reports
- Opinion Leaders
Secondary Research
- Annual Reports
- White Paper
- Latest Press Release
- Industry Association
- Paid Database
- Investor Presentations
Step 4 - Data Triangulation
Involves using different sources of information in order to increase the validity of a study
These sources are likely to be stakeholders in a program - participants, other researchers, program staff, other community members, and so on.
Then we put all data in single framework & apply various statistical tools to find out the dynamic on the market.
During the analysis stage, feedback from the stakeholder groups would be compared to determine areas of agreement as well as areas of divergence