
Key Insights
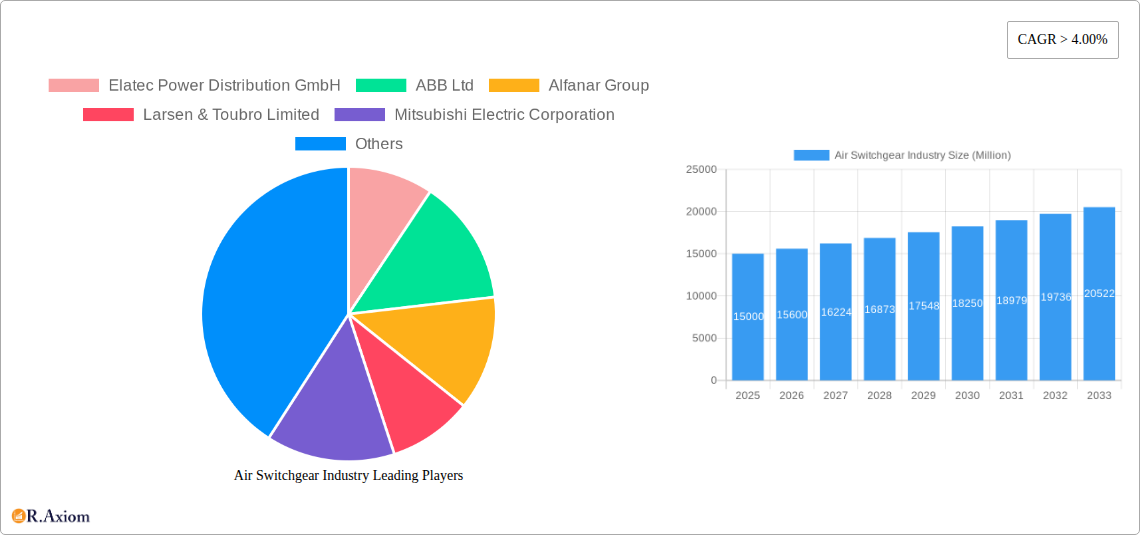
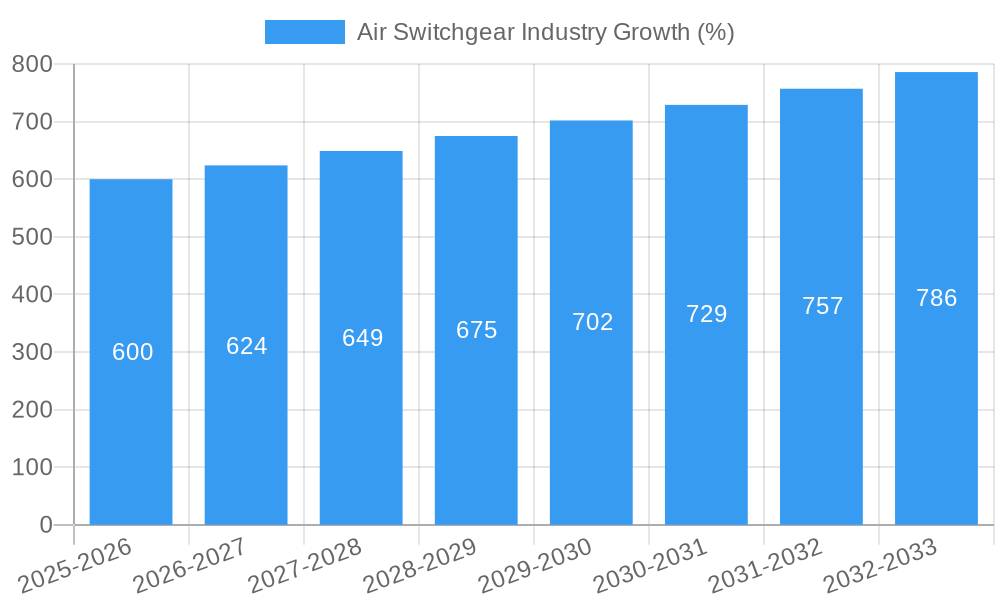
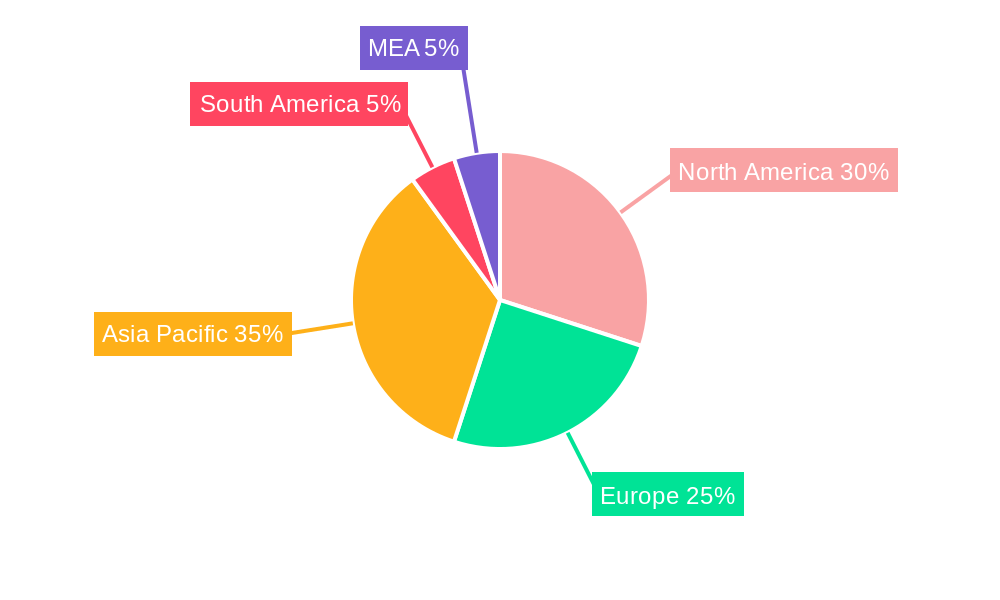
The global air switchgear market is experiencing robust growth, projected to maintain a Compound Annual Growth Rate (CAGR) exceeding 4.00% from 2025 to 2033. This expansion is driven by several key factors. The increasing demand for reliable and efficient power distribution across various sectors, including power utilities, industrial facilities, commercial buildings, and residential complexes, fuels market growth. Furthermore, the rising adoption of smart grids and advanced metering infrastructure (AMI) necessitates sophisticated switchgear solutions capable of handling increased power loads and integrating with smart grid technologies. Stringent safety regulations and a growing focus on preventing power outages also contribute significantly to market expansion. While the high initial investment cost of advanced air switchgear systems might present a restraint, the long-term benefits in terms of enhanced safety, reliability, and reduced maintenance costs outweigh this factor for many consumers. Segmentation analysis reveals that high-voltage switchgear is likely to dominate due to its application in large-scale power transmission and distribution networks. Geographically, North America and Europe currently hold significant market shares, driven by robust infrastructure development and high adoption rates. However, rapid industrialization and urbanization in Asia-Pacific are projected to fuel substantial growth in this region in the coming years.
The competitive landscape is characterized by a mix of established global players and regional manufacturers. Companies such as ABB Ltd, Siemens AG, Schneider Electric SE, and Eaton Corporation PLC hold significant market share due to their strong brand reputation, extensive product portfolios, and global distribution networks. However, the market also witnesses the emergence of regional players who leverage their understanding of local market demands and offer competitive pricing. Future growth opportunities will likely stem from innovations in smart switchgear technologies, incorporating features like remote monitoring, predictive maintenance capabilities, and improved safety features. The integration of digital technologies and the implementation of Industry 4.0 principles within the power sector will continue to drive demand for advanced and intelligent air switchgear solutions. The market is poised for sustained growth, driven by ongoing infrastructure development globally and the imperative for reliable and efficient power systems.
Air Switchgear Industry Market Report: 2019-2033
This comprehensive report provides a detailed analysis of the global air switchgear industry, offering invaluable insights for stakeholders seeking to navigate this dynamic market. The report covers the period 2019-2033, with a base year of 2025 and a forecast period of 2025-2033. Market sizing is provided in Millions of dollars (USD). The report incorporates extensive data analysis, examining key market trends, competitive landscapes, and future growth prospects.
Air Switchgear Industry Market Concentration & Innovation
The air switchgear market exhibits a moderately concentrated structure, with several key players holding significant market share. Leading companies, including ABB Ltd, Siemens AG, Schneider Electric SE, Eaton Corporation PLC, and Mitsubishi Electric Corporation, control a substantial portion of the global market, estimated at xx%. These companies leverage their established brands, extensive distribution networks, and technological expertise to maintain their competitive edge. However, regional players and emerging companies are actively challenging this dominance, driving innovation and market dynamism.
Market innovation is driven by the increasing demand for enhanced safety, reliability, and efficiency in power distribution. Key innovations include:
- Smart switchgear: incorporating advanced sensors, communication protocols, and cloud-based analytics for predictive maintenance and improved grid management.
- Compact designs: reducing footprint and installation costs.
- Eco-friendly materials: minimizing environmental impact.
Regulatory frameworks, particularly those focusing on grid modernization and renewable energy integration, significantly influence market growth. While direct product substitutes are limited, competition arises from alternative technologies like gas-insulated switchgear (GIS), influencing market segmentation and pricing strategies. Mergers and acquisitions (M&A) activities are prevalent, with deal values exceeding xx Million in recent years, indicating the consolidation trend within the industry. Examples of notable M&A activities include [Insert specific example if available, otherwise replace with "xx"].
Air Switchgear Industry Industry Trends & Insights
The air switchgear market is experiencing robust growth, driven by the increasing global demand for electricity and the expansion of power grids. The compound annual growth rate (CAGR) during the forecast period (2025-2033) is projected to be xx%, surpassing the historical CAGR (2019-2024) of xx%. This growth is fueled by several key factors:
- Infrastructure development: Significant investments in power infrastructure modernization across developing economies.
- Renewable energy integration: The increasing adoption of renewable energy sources, requiring robust and reliable switchgear solutions.
- Smart grid initiatives: Government support and funding for smart grid projects boosting demand for smart switchgear.
- Industrial automation: The growing automation of industrial processes increases the need for advanced switchgear technologies.
- Stringent safety regulations: Enforcing standards for enhanced safety in electrical installations driving demand for reliable switchgear.
Technological disruptions, such as the adoption of digital technologies and IoT (Internet of Things) capabilities in switchgear design and operation, are fundamentally transforming the industry. Consumer preferences are shifting towards switchgear solutions with enhanced safety features, reduced maintenance requirements, and improved energy efficiency. The competitive landscape is characterized by intense rivalry among established players and emerging market entrants, driving innovation and price competition.
Dominant Markets & Segments in Air Switchgear Industry
The High Voltage segment is expected to dominate the market, capturing a significant market share of xx%. This dominance is primarily driven by the substantial investments in high-voltage transmission lines and substations. The Power Utilities end-user segment also holds a considerable market share due to their extensive requirements for switchgear across their power distribution networks.
Key Drivers for High Voltage and Power Utilities Dominance:
- Grid modernization and expansion: Major investments by power utilities in upgrading and expanding their transmission and distribution networks.
- Increased electricity demand: Growing population and industrialization are leading to higher power consumption globally.
- Government initiatives: Funding and support for grid infrastructure improvements through various government programs.
Geographical dominance is likely to be concentrated in regions like Asia-Pacific, owing to rapid urbanization, industrialization, and substantial investments in power infrastructure. Europe and North America also represent significant market segments due to sustained infrastructure upgrades and smart grid deployments.
The Medium Voltage and Low Voltage segments are expected to exhibit steady growth. The Industrial and Commercial end-user segments are also contributing significantly to the overall market growth. The Residential segment, while showing gradual growth, is limited by the smaller scale of installations compared to other segments.
Air Switchgear Industry Product Developments
Recent product innovations emphasize enhanced safety features, advanced monitoring capabilities, and improved reliability. The integration of digital technologies and IoT allows for predictive maintenance, optimizing operational efficiency and minimizing downtime. For example, Schneider Electric’s GenieEvo Connected range sets a new standard for primary air-insulated switchgear, integrating 24/7 cloud-based service for efficient maintenance. These advancements are addressing the increasing demand for smarter, more reliable, and efficient power distribution solutions, enhancing their market fit significantly.
Report Scope & Segmentation Analysis
This report segments the air switchgear market based on voltage level (Low Voltage, Medium Voltage, High Voltage) and end-user (Power Utilities, Industrial, Commercial, and Residential).
Voltage Level: Each voltage level presents unique technological requirements and market dynamics, impacting pricing, competition, and growth projections. High-voltage segments show significant growth driven by grid modernization, while low and medium voltage segments experience steady growth driven by industrial and commercial applications.
End-User: The Power Utilities segment dominates due to large-scale grid infrastructure projects. Industrial and Commercial segments showcase robust growth based on automation needs and increased power consumption. The Residential segment displays moderate growth. Market size projections, competitive analyses, and growth rates are provided for each segment within the full report.
Key Drivers of Air Switchgear Industry Growth
Several factors fuel the growth of the air switchgear industry:
- Expanding power grids: Global increase in electricity demand necessitates grid expansion and modernization.
- Renewable energy integration: The rising adoption of renewable energy sources demands reliable switchgear to manage intermittent power supply.
- Smart grid development: Government initiatives promoting smart grid technologies drive the adoption of advanced switchgear solutions.
- Industrial automation: Increased automation in industrial facilities increases the demand for reliable and efficient power distribution systems.
Challenges in the Air Switchgear Industry Sector
The air switchgear industry faces several challenges:
- Stringent safety regulations: Meeting increasingly stringent safety and environmental standards adds to manufacturing costs.
- Supply chain disruptions: Global supply chain uncertainties impact component availability and production timelines.
- Intense competition: Competition among established players and new entrants results in price pressures.
Emerging Opportunities in Air Switchgear Industry
Emerging opportunities in the air switchgear market include:
- Smart grid technologies: Integrating advanced sensors and communication technologies for real-time monitoring and control.
- Microgrids and distributed generation: Growing adoption of microgrids and distributed generation systems creates opportunities for specialized switchgear solutions.
- Developing economies: Rapid infrastructure development in emerging economies presents significant growth prospects.
Leading Players in the Air Switchgear Industry Market
- Elatec Power Distribution GmbH
- ABB Ltd
- Alfanar Group
- Larsen & Toubro Limited
- Mitsubishi Electric Corporation
- Siemens AG
- Schneider Electric SE
- Eaton Corporation PLC
- Wenzhou Unisun Electric Co Ltd
- Tavrida Electric
Key Developments in Air Switchgear Industry Industry
- August 2021: Schneider Electric launched GenieEvo Connected, a comprehensive, reliable switchgear range with unparalleled connectivity for asset health monitoring, setting a new standard for primary air-insulated switchgear with 24/7 cloud-based service for efficient maintenance. This launch significantly impacted market dynamics by introducing a more advanced and service-oriented product. [Add other key developments if available with year and month]
Strategic Outlook for Air Switchgear Industry Market
The air switchgear market is poised for significant growth driven by continued investment in grid infrastructure, increasing electricity demand, and the integration of renewable energy sources. The strategic focus will be on innovation, particularly in the development of smart and connected switchgear solutions that enhance grid reliability, efficiency, and safety. Emerging markets in developing economies present significant untapped potential, offering attractive growth opportunities for established and new market players. Continued focus on sustainability and environmentally friendly materials will also play a major role in shaping the future of the industry.
Air Switchgear Industry Segmentation
-
1. Voltage Level
- 1.1. Low Voltage
- 1.2. Medium Voltage
- 1.3. High Voltage
-
2. End-User
- 2.1. Power Utilities
- 2.2. Industrial
- 2.3. Commercial and Residential
Air Switchgear Industry Segmentation By Geography
- 1. North America
- 2. Europe
- 3. Asia Pacific
- 4. South America
- 5. Middle East and Africa
Air Switchgear Industry REPORT HIGHLIGHTS
| Aspects | Details |
|---|---|
| Study Period | 2019-2033 |
| Base Year | 2024 |
| Estimated Year | 2025 |
| Forecast Period | 2025-2033 |
| Historical Period | 2019-2024 |
| Growth Rate | CAGR of > 4.00% from 2019-2033 |
| Segmentation |
|
Table of Contents
- 1. Introduction
- 1.1. Research Scope
- 1.2. Market Segmentation
- 1.3. Research Methodology
- 1.4. Definitions and Assumptions
- 2. Executive Summary
- 2.1. Introduction
- 3. Market Dynamics
- 3.1. Introduction
- 3.2. Market Drivers
- 3.2.1. 4.; Increasing Integration Of Renewable Energy Generation4.; Aging Power Grids And Investments In Transmission And Distribution Infrastructure
- 3.3. Market Restrains
- 3.3.1. 4.; Lack Of Investor Confidence Due To Sociopolitical Instability In Some Countries
- 3.4. Market Trends
- 3.4.1. Power Utilities Segment to Witness Significant Demand
- 4. Market Factor Analysis
- 4.1. Porters Five Forces
- 4.2. Supply/Value Chain
- 4.3. PESTEL analysis
- 4.4. Market Entropy
- 4.5. Patent/Trademark Analysis
- 5. Global Air Switchgear Industry Analysis, Insights and Forecast, 2019-2031
- 5.1. Market Analysis, Insights and Forecast - by Voltage Level
- 5.1.1. Low Voltage
- 5.1.2. Medium Voltage
- 5.1.3. High Voltage
- 5.2. Market Analysis, Insights and Forecast - by End-User
- 5.2.1. Power Utilities
- 5.2.2. Industrial
- 5.2.3. Commercial and Residential
- 5.3. Market Analysis, Insights and Forecast - by Region
- 5.3.1. North America
- 5.3.2. Europe
- 5.3.3. Asia Pacific
- 5.3.4. South America
- 5.3.5. Middle East and Africa
- 5.1. Market Analysis, Insights and Forecast - by Voltage Level
- 6. North America Air Switchgear Industry Analysis, Insights and Forecast, 2019-2031
- 6.1. Market Analysis, Insights and Forecast - by Voltage Level
- 6.1.1. Low Voltage
- 6.1.2. Medium Voltage
- 6.1.3. High Voltage
- 6.2. Market Analysis, Insights and Forecast - by End-User
- 6.2.1. Power Utilities
- 6.2.2. Industrial
- 6.2.3. Commercial and Residential
- 6.1. Market Analysis, Insights and Forecast - by Voltage Level
- 7. Europe Air Switchgear Industry Analysis, Insights and Forecast, 2019-2031
- 7.1. Market Analysis, Insights and Forecast - by Voltage Level
- 7.1.1. Low Voltage
- 7.1.2. Medium Voltage
- 7.1.3. High Voltage
- 7.2. Market Analysis, Insights and Forecast - by End-User
- 7.2.1. Power Utilities
- 7.2.2. Industrial
- 7.2.3. Commercial and Residential
- 7.1. Market Analysis, Insights and Forecast - by Voltage Level
- 8. Asia Pacific Air Switchgear Industry Analysis, Insights and Forecast, 2019-2031
- 8.1. Market Analysis, Insights and Forecast - by Voltage Level
- 8.1.1. Low Voltage
- 8.1.2. Medium Voltage
- 8.1.3. High Voltage
- 8.2. Market Analysis, Insights and Forecast - by End-User
- 8.2.1. Power Utilities
- 8.2.2. Industrial
- 8.2.3. Commercial and Residential
- 8.1. Market Analysis, Insights and Forecast - by Voltage Level
- 9. South America Air Switchgear Industry Analysis, Insights and Forecast, 2019-2031
- 9.1. Market Analysis, Insights and Forecast - by Voltage Level
- 9.1.1. Low Voltage
- 9.1.2. Medium Voltage
- 9.1.3. High Voltage
- 9.2. Market Analysis, Insights and Forecast - by End-User
- 9.2.1. Power Utilities
- 9.2.2. Industrial
- 9.2.3. Commercial and Residential
- 9.1. Market Analysis, Insights and Forecast - by Voltage Level
- 10. Middle East and Africa Air Switchgear Industry Analysis, Insights and Forecast, 2019-2031
- 10.1. Market Analysis, Insights and Forecast - by Voltage Level
- 10.1.1. Low Voltage
- 10.1.2. Medium Voltage
- 10.1.3. High Voltage
- 10.2. Market Analysis, Insights and Forecast - by End-User
- 10.2.1. Power Utilities
- 10.2.2. Industrial
- 10.2.3. Commercial and Residential
- 10.1. Market Analysis, Insights and Forecast - by Voltage Level
- 11. North America Air Switchgear Industry Analysis, Insights and Forecast, 2019-2031
- 11.1. Market Analysis, Insights and Forecast - By Country/Sub-region
- 11.1.1 United States
- 11.1.2 Canada
- 11.1.3 Mexico
- 12. Europe Air Switchgear Industry Analysis, Insights and Forecast, 2019-2031
- 12.1. Market Analysis, Insights and Forecast - By Country/Sub-region
- 12.1.1 Germany
- 12.1.2 United Kingdom
- 12.1.3 France
- 12.1.4 Spain
- 12.1.5 Italy
- 12.1.6 Spain
- 12.1.7 Belgium
- 12.1.8 Netherland
- 12.1.9 Nordics
- 12.1.10 Rest of Europe
- 13. Asia Pacific Air Switchgear Industry Analysis, Insights and Forecast, 2019-2031
- 13.1. Market Analysis, Insights and Forecast - By Country/Sub-region
- 13.1.1 China
- 13.1.2 Japan
- 13.1.3 India
- 13.1.4 South Korea
- 13.1.5 Southeast Asia
- 13.1.6 Australia
- 13.1.7 Indonesia
- 13.1.8 Phillipes
- 13.1.9 Singapore
- 13.1.10 Thailandc
- 13.1.11 Rest of Asia Pacific
- 14. South America Air Switchgear Industry Analysis, Insights and Forecast, 2019-2031
- 14.1. Market Analysis, Insights and Forecast - By Country/Sub-region
- 14.1.1 Brazil
- 14.1.2 Argentina
- 14.1.3 Peru
- 14.1.4 Chile
- 14.1.5 Colombia
- 14.1.6 Ecuador
- 14.1.7 Venezuela
- 14.1.8 Rest of South America
- 15. North America Air Switchgear Industry Analysis, Insights and Forecast, 2019-2031
- 15.1. Market Analysis, Insights and Forecast - By Country/Sub-region
- 15.1.1 United States
- 15.1.2 Canada
- 15.1.3 Mexico
- 16. MEA Air Switchgear Industry Analysis, Insights and Forecast, 2019-2031
- 16.1. Market Analysis, Insights and Forecast - By Country/Sub-region
- 16.1.1 United Arab Emirates
- 16.1.2 Saudi Arabia
- 16.1.3 South Africa
- 16.1.4 Rest of Middle East and Africa
- 17. Competitive Analysis
- 17.1. Global Market Share Analysis 2024
- 17.2. Company Profiles
- 17.2.1 Elatec Power Distribution GmbH
- 17.2.1.1. Overview
- 17.2.1.2. Products
- 17.2.1.3. SWOT Analysis
- 17.2.1.4. Recent Developments
- 17.2.1.5. Financials (Based on Availability)
- 17.2.2 ABB Ltd
- 17.2.2.1. Overview
- 17.2.2.2. Products
- 17.2.2.3. SWOT Analysis
- 17.2.2.4. Recent Developments
- 17.2.2.5. Financials (Based on Availability)
- 17.2.3 Alfanar Group
- 17.2.3.1. Overview
- 17.2.3.2. Products
- 17.2.3.3. SWOT Analysis
- 17.2.3.4. Recent Developments
- 17.2.3.5. Financials (Based on Availability)
- 17.2.4 Larsen & Toubro Limited
- 17.2.4.1. Overview
- 17.2.4.2. Products
- 17.2.4.3. SWOT Analysis
- 17.2.4.4. Recent Developments
- 17.2.4.5. Financials (Based on Availability)
- 17.2.5 Mitsubishi Electric Corporation
- 17.2.5.1. Overview
- 17.2.5.2. Products
- 17.2.5.3. SWOT Analysis
- 17.2.5.4. Recent Developments
- 17.2.5.5. Financials (Based on Availability)
- 17.2.6 Siemens AG
- 17.2.6.1. Overview
- 17.2.6.2. Products
- 17.2.6.3. SWOT Analysis
- 17.2.6.4. Recent Developments
- 17.2.6.5. Financials (Based on Availability)
- 17.2.7 Schneider Electric SE
- 17.2.7.1. Overview
- 17.2.7.2. Products
- 17.2.7.3. SWOT Analysis
- 17.2.7.4. Recent Developments
- 17.2.7.5. Financials (Based on Availability)
- 17.2.8 Eaton Corporation PLC
- 17.2.8.1. Overview
- 17.2.8.2. Products
- 17.2.8.3. SWOT Analysis
- 17.2.8.4. Recent Developments
- 17.2.8.5. Financials (Based on Availability)
- 17.2.9 Wenzhou Unisun Electric Co Ltd
- 17.2.9.1. Overview
- 17.2.9.2. Products
- 17.2.9.3. SWOT Analysis
- 17.2.9.4. Recent Developments
- 17.2.9.5. Financials (Based on Availability)
- 17.2.10 Tavrida Electric*List Not Exhaustive
- 17.2.10.1. Overview
- 17.2.10.2. Products
- 17.2.10.3. SWOT Analysis
- 17.2.10.4. Recent Developments
- 17.2.10.5. Financials (Based on Availability)
- 17.2.1 Elatec Power Distribution GmbH
List of Figures
- Figure 1: Global Air Switchgear Industry Revenue Breakdown (Million, %) by Region 2024 & 2032
- Figure 2: North America Air Switchgear Industry Revenue (Million), by Country 2024 & 2032
- Figure 3: North America Air Switchgear Industry Revenue Share (%), by Country 2024 & 2032
- Figure 4: Europe Air Switchgear Industry Revenue (Million), by Country 2024 & 2032
- Figure 5: Europe Air Switchgear Industry Revenue Share (%), by Country 2024 & 2032
- Figure 6: Asia Pacific Air Switchgear Industry Revenue (Million), by Country 2024 & 2032
- Figure 7: Asia Pacific Air Switchgear Industry Revenue Share (%), by Country 2024 & 2032
- Figure 8: South America Air Switchgear Industry Revenue (Million), by Country 2024 & 2032
- Figure 9: South America Air Switchgear Industry Revenue Share (%), by Country 2024 & 2032
- Figure 10: North America Air Switchgear Industry Revenue (Million), by Country 2024 & 2032
- Figure 11: North America Air Switchgear Industry Revenue Share (%), by Country 2024 & 2032
- Figure 12: MEA Air Switchgear Industry Revenue (Million), by Country 2024 & 2032
- Figure 13: MEA Air Switchgear Industry Revenue Share (%), by Country 2024 & 2032
- Figure 14: North America Air Switchgear Industry Revenue (Million), by Voltage Level 2024 & 2032
- Figure 15: North America Air Switchgear Industry Revenue Share (%), by Voltage Level 2024 & 2032
- Figure 16: North America Air Switchgear Industry Revenue (Million), by End-User 2024 & 2032
- Figure 17: North America Air Switchgear Industry Revenue Share (%), by End-User 2024 & 2032
- Figure 18: North America Air Switchgear Industry Revenue (Million), by Country 2024 & 2032
- Figure 19: North America Air Switchgear Industry Revenue Share (%), by Country 2024 & 2032
- Figure 20: Europe Air Switchgear Industry Revenue (Million), by Voltage Level 2024 & 2032
- Figure 21: Europe Air Switchgear Industry Revenue Share (%), by Voltage Level 2024 & 2032
- Figure 22: Europe Air Switchgear Industry Revenue (Million), by End-User 2024 & 2032
- Figure 23: Europe Air Switchgear Industry Revenue Share (%), by End-User 2024 & 2032
- Figure 24: Europe Air Switchgear Industry Revenue (Million), by Country 2024 & 2032
- Figure 25: Europe Air Switchgear Industry Revenue Share (%), by Country 2024 & 2032
- Figure 26: Asia Pacific Air Switchgear Industry Revenue (Million), by Voltage Level 2024 & 2032
- Figure 27: Asia Pacific Air Switchgear Industry Revenue Share (%), by Voltage Level 2024 & 2032
- Figure 28: Asia Pacific Air Switchgear Industry Revenue (Million), by End-User 2024 & 2032
- Figure 29: Asia Pacific Air Switchgear Industry Revenue Share (%), by End-User 2024 & 2032
- Figure 30: Asia Pacific Air Switchgear Industry Revenue (Million), by Country 2024 & 2032
- Figure 31: Asia Pacific Air Switchgear Industry Revenue Share (%), by Country 2024 & 2032
- Figure 32: South America Air Switchgear Industry Revenue (Million), by Voltage Level 2024 & 2032
- Figure 33: South America Air Switchgear Industry Revenue Share (%), by Voltage Level 2024 & 2032
- Figure 34: South America Air Switchgear Industry Revenue (Million), by End-User 2024 & 2032
- Figure 35: South America Air Switchgear Industry Revenue Share (%), by End-User 2024 & 2032
- Figure 36: South America Air Switchgear Industry Revenue (Million), by Country 2024 & 2032
- Figure 37: South America Air Switchgear Industry Revenue Share (%), by Country 2024 & 2032
- Figure 38: Middle East and Africa Air Switchgear Industry Revenue (Million), by Voltage Level 2024 & 2032
- Figure 39: Middle East and Africa Air Switchgear Industry Revenue Share (%), by Voltage Level 2024 & 2032
- Figure 40: Middle East and Africa Air Switchgear Industry Revenue (Million), by End-User 2024 & 2032
- Figure 41: Middle East and Africa Air Switchgear Industry Revenue Share (%), by End-User 2024 & 2032
- Figure 42: Middle East and Africa Air Switchgear Industry Revenue (Million), by Country 2024 & 2032
- Figure 43: Middle East and Africa Air Switchgear Industry Revenue Share (%), by Country 2024 & 2032
List of Tables
- Table 1: Global Air Switchgear Industry Revenue Million Forecast, by Region 2019 & 2032
- Table 2: Global Air Switchgear Industry Revenue Million Forecast, by Voltage Level 2019 & 2032
- Table 3: Global Air Switchgear Industry Revenue Million Forecast, by End-User 2019 & 2032
- Table 4: Global Air Switchgear Industry Revenue Million Forecast, by Region 2019 & 2032
- Table 5: Global Air Switchgear Industry Revenue Million Forecast, by Country 2019 & 2032
- Table 6: United States Air Switchgear Industry Revenue (Million) Forecast, by Application 2019 & 2032
- Table 7: Canada Air Switchgear Industry Revenue (Million) Forecast, by Application 2019 & 2032
- Table 8: Mexico Air Switchgear Industry Revenue (Million) Forecast, by Application 2019 & 2032
- Table 9: Global Air Switchgear Industry Revenue Million Forecast, by Country 2019 & 2032
- Table 10: Germany Air Switchgear Industry Revenue (Million) Forecast, by Application 2019 & 2032
- Table 11: United Kingdom Air Switchgear Industry Revenue (Million) Forecast, by Application 2019 & 2032
- Table 12: France Air Switchgear Industry Revenue (Million) Forecast, by Application 2019 & 2032
- Table 13: Spain Air Switchgear Industry Revenue (Million) Forecast, by Application 2019 & 2032
- Table 14: Italy Air Switchgear Industry Revenue (Million) Forecast, by Application 2019 & 2032
- Table 15: Spain Air Switchgear Industry Revenue (Million) Forecast, by Application 2019 & 2032
- Table 16: Belgium Air Switchgear Industry Revenue (Million) Forecast, by Application 2019 & 2032
- Table 17: Netherland Air Switchgear Industry Revenue (Million) Forecast, by Application 2019 & 2032
- Table 18: Nordics Air Switchgear Industry Revenue (Million) Forecast, by Application 2019 & 2032
- Table 19: Rest of Europe Air Switchgear Industry Revenue (Million) Forecast, by Application 2019 & 2032
- Table 20: Global Air Switchgear Industry Revenue Million Forecast, by Country 2019 & 2032
- Table 21: China Air Switchgear Industry Revenue (Million) Forecast, by Application 2019 & 2032
- Table 22: Japan Air Switchgear Industry Revenue (Million) Forecast, by Application 2019 & 2032
- Table 23: India Air Switchgear Industry Revenue (Million) Forecast, by Application 2019 & 2032
- Table 24: South Korea Air Switchgear Industry Revenue (Million) Forecast, by Application 2019 & 2032
- Table 25: Southeast Asia Air Switchgear Industry Revenue (Million) Forecast, by Application 2019 & 2032
- Table 26: Australia Air Switchgear Industry Revenue (Million) Forecast, by Application 2019 & 2032
- Table 27: Indonesia Air Switchgear Industry Revenue (Million) Forecast, by Application 2019 & 2032
- Table 28: Phillipes Air Switchgear Industry Revenue (Million) Forecast, by Application 2019 & 2032
- Table 29: Singapore Air Switchgear Industry Revenue (Million) Forecast, by Application 2019 & 2032
- Table 30: Thailandc Air Switchgear Industry Revenue (Million) Forecast, by Application 2019 & 2032
- Table 31: Rest of Asia Pacific Air Switchgear Industry Revenue (Million) Forecast, by Application 2019 & 2032
- Table 32: Global Air Switchgear Industry Revenue Million Forecast, by Country 2019 & 2032
- Table 33: Brazil Air Switchgear Industry Revenue (Million) Forecast, by Application 2019 & 2032
- Table 34: Argentina Air Switchgear Industry Revenue (Million) Forecast, by Application 2019 & 2032
- Table 35: Peru Air Switchgear Industry Revenue (Million) Forecast, by Application 2019 & 2032
- Table 36: Chile Air Switchgear Industry Revenue (Million) Forecast, by Application 2019 & 2032
- Table 37: Colombia Air Switchgear Industry Revenue (Million) Forecast, by Application 2019 & 2032
- Table 38: Ecuador Air Switchgear Industry Revenue (Million) Forecast, by Application 2019 & 2032
- Table 39: Venezuela Air Switchgear Industry Revenue (Million) Forecast, by Application 2019 & 2032
- Table 40: Rest of South America Air Switchgear Industry Revenue (Million) Forecast, by Application 2019 & 2032
- Table 41: Global Air Switchgear Industry Revenue Million Forecast, by Country 2019 & 2032
- Table 42: United States Air Switchgear Industry Revenue (Million) Forecast, by Application 2019 & 2032
- Table 43: Canada Air Switchgear Industry Revenue (Million) Forecast, by Application 2019 & 2032
- Table 44: Mexico Air Switchgear Industry Revenue (Million) Forecast, by Application 2019 & 2032
- Table 45: Global Air Switchgear Industry Revenue Million Forecast, by Country 2019 & 2032
- Table 46: United Arab Emirates Air Switchgear Industry Revenue (Million) Forecast, by Application 2019 & 2032
- Table 47: Saudi Arabia Air Switchgear Industry Revenue (Million) Forecast, by Application 2019 & 2032
- Table 48: South Africa Air Switchgear Industry Revenue (Million) Forecast, by Application 2019 & 2032
- Table 49: Rest of Middle East and Africa Air Switchgear Industry Revenue (Million) Forecast, by Application 2019 & 2032
- Table 50: Global Air Switchgear Industry Revenue Million Forecast, by Voltage Level 2019 & 2032
- Table 51: Global Air Switchgear Industry Revenue Million Forecast, by End-User 2019 & 2032
- Table 52: Global Air Switchgear Industry Revenue Million Forecast, by Country 2019 & 2032
- Table 53: Global Air Switchgear Industry Revenue Million Forecast, by Voltage Level 2019 & 2032
- Table 54: Global Air Switchgear Industry Revenue Million Forecast, by End-User 2019 & 2032
- Table 55: Global Air Switchgear Industry Revenue Million Forecast, by Country 2019 & 2032
- Table 56: Global Air Switchgear Industry Revenue Million Forecast, by Voltage Level 2019 & 2032
- Table 57: Global Air Switchgear Industry Revenue Million Forecast, by End-User 2019 & 2032
- Table 58: Global Air Switchgear Industry Revenue Million Forecast, by Country 2019 & 2032
- Table 59: Global Air Switchgear Industry Revenue Million Forecast, by Voltage Level 2019 & 2032
- Table 60: Global Air Switchgear Industry Revenue Million Forecast, by End-User 2019 & 2032
- Table 61: Global Air Switchgear Industry Revenue Million Forecast, by Country 2019 & 2032
- Table 62: Global Air Switchgear Industry Revenue Million Forecast, by Voltage Level 2019 & 2032
- Table 63: Global Air Switchgear Industry Revenue Million Forecast, by End-User 2019 & 2032
- Table 64: Global Air Switchgear Industry Revenue Million Forecast, by Country 2019 & 2032
Frequently Asked Questions
1. What is the projected Compound Annual Growth Rate (CAGR) of the Air Switchgear Industry?
The projected CAGR is approximately > 4.00%.
2. Which companies are prominent players in the Air Switchgear Industry?
Key companies in the market include Elatec Power Distribution GmbH, ABB Ltd, Alfanar Group, Larsen & Toubro Limited, Mitsubishi Electric Corporation, Siemens AG, Schneider Electric SE, Eaton Corporation PLC, Wenzhou Unisun Electric Co Ltd, Tavrida Electric*List Not Exhaustive.
3. What are the main segments of the Air Switchgear Industry?
The market segments include Voltage Level, End-User.
4. Can you provide details about the market size?
The market size is estimated to be USD XX Million as of 2022.
5. What are some drivers contributing to market growth?
4.; Increasing Integration Of Renewable Energy Generation4.; Aging Power Grids And Investments In Transmission And Distribution Infrastructure.
6. What are the notable trends driving market growth?
Power Utilities Segment to Witness Significant Demand.
7. Are there any restraints impacting market growth?
4.; Lack Of Investor Confidence Due To Sociopolitical Instability In Some Countries.
8. Can you provide examples of recent developments in the market?
In August 2021, Schneider Electric launched GenieEvo Connected, a comprehensive, reliable switchgear range with unparalleled connectivity for asset health monitoring. GenieEvo connected, setting a new standard for primary air-insulated switchgear completely with 24/7 cloud-based service for efficient maintenance.
9. What pricing options are available for accessing the report?
Pricing options include single-user, multi-user, and enterprise licenses priced at USD 4750, USD 5250, and USD 8750 respectively.
10. Is the market size provided in terms of value or volume?
The market size is provided in terms of value, measured in Million.
11. Are there any specific market keywords associated with the report?
Yes, the market keyword associated with the report is "Air Switchgear Industry," which aids in identifying and referencing the specific market segment covered.
12. How do I determine which pricing option suits my needs best?
The pricing options vary based on user requirements and access needs. Individual users may opt for single-user licenses, while businesses requiring broader access may choose multi-user or enterprise licenses for cost-effective access to the report.
13. Are there any additional resources or data provided in the Air Switchgear Industry report?
While the report offers comprehensive insights, it's advisable to review the specific contents or supplementary materials provided to ascertain if additional resources or data are available.
14. How can I stay updated on further developments or reports in the Air Switchgear Industry?
To stay informed about further developments, trends, and reports in the Air Switchgear Industry, consider subscribing to industry newsletters, following relevant companies and organizations, or regularly checking reputable industry news sources and publications.
Methodology
Step 1 - Identification of Relevant Samples Size from Population Database


Step 2 - Approaches for Defining Global Market Size (Value, Volume* & Price*)

Note*: In applicable scenarios
Step 3 - Data Sources
Primary Research
- Web Analytics
- Survey Reports
- Research Institute
- Latest Research Reports
- Opinion Leaders
Secondary Research
- Annual Reports
- White Paper
- Latest Press Release
- Industry Association
- Paid Database
- Investor Presentations

Step 4 - Data Triangulation
Involves using different sources of information in order to increase the validity of a study
These sources are likely to be stakeholders in a program - participants, other researchers, program staff, other community members, and so on.
Then we put all data in single framework & apply various statistical tools to find out the dynamic on the market.
During the analysis stage, feedback from the stakeholder groups would be compared to determine areas of agreement as well as areas of divergence


