
Key Insights
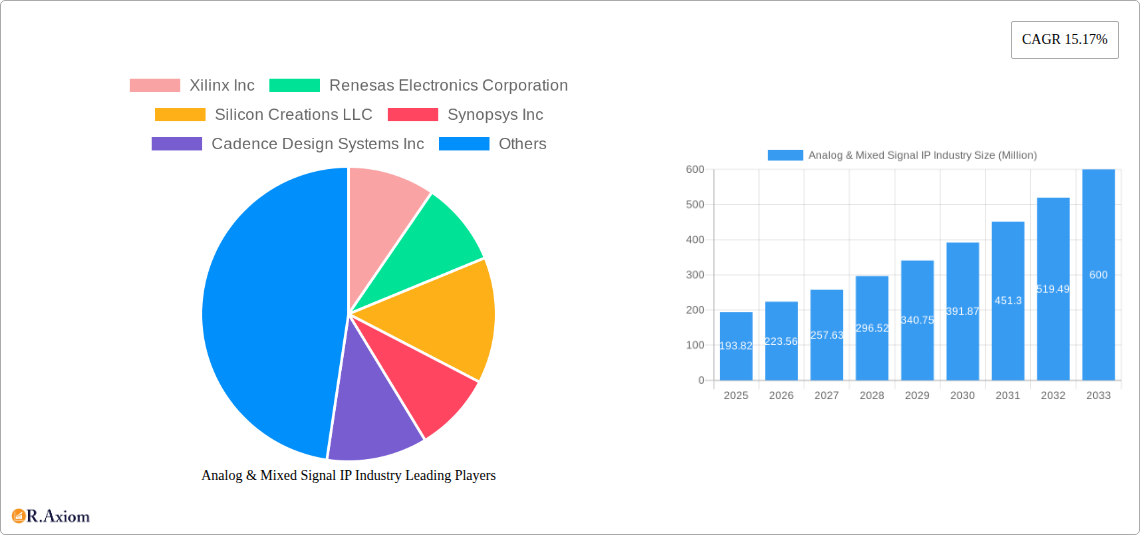
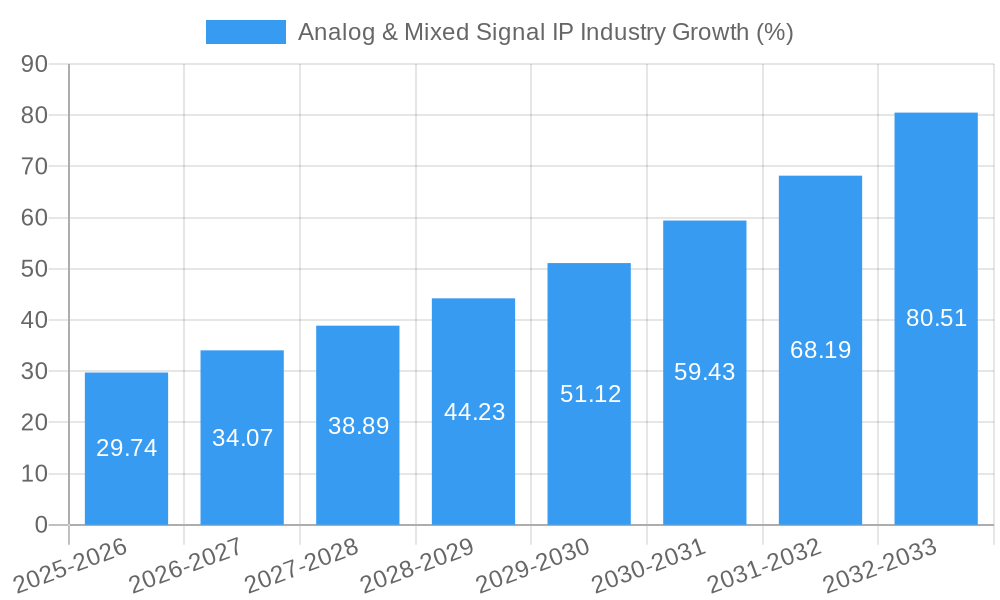
The Analog & Mixed Signal (AMS) IP market is experiencing robust growth, projected to reach $193.82 million in 2025 and exhibiting a Compound Annual Growth Rate (CAGR) of 15.17%. This expansion is fueled by several key drivers. The increasing demand for advanced features in consumer electronics, particularly in smartphones, wearables, and IoT devices, is a significant factor. The automotive industry's shift towards electric vehicles (EVs) and advanced driver-assistance systems (ADAS) further boosts demand for high-performance AMS IPs for power management, sensor integration, and communication. Furthermore, the growth of 5G and other high-speed communication networks necessitates sophisticated RF and mixed-signal solutions, driving market expansion. The market segmentation reveals a strong presence across various product categories, including A2D and D2A converters, power management modules, and RF components. The prevalent use of both hard and soft IP underscores the flexibility and design choices available to manufacturers. Major players like Xilinx, Renesas, and Synopsys are actively contributing to this growth through continuous innovation and product diversification.
Looking forward, the AMS IP market is poised for sustained growth through 2033. Continued technological advancements in semiconductor technology, particularly in areas like low-power design and advanced process nodes, will enable the development of more efficient and sophisticated AMS IPs. The rising adoption of AI and machine learning applications across various industries will also create new opportunities for AMS IP providers. While challenges remain, such as the complexities of integrating diverse IPs and the need for robust testing methodologies, the overall market outlook remains positive, supported by strong demand from key end-user industries. Geographical expansion, particularly in the Asia-Pacific region driven by substantial growth in electronics manufacturing, will contribute to this overall market expansion.
This comprehensive report provides a detailed analysis of the Analog & Mixed Signal IP industry, covering market trends, competitive landscape, and future growth prospects from 2019 to 2033. The study period spans 2019-2024 (historical), with 2025 as the base and estimated year, and a forecast period of 2025-2033. Key players such as Xilinx Inc, Renesas Electronics Corporation, Silicon Creations LLC, Synopsys Inc, Cadence Design Systems Inc, VeriSilicon Holdings Co Ltd, Analog Devices Inc, Maxim Integrated Products Inc, Texas Instruments Limited, ARM Holdings PLC, and Intel Corporation are thoroughly analyzed. The report segments the market by product (A2D and D2A Converter, Power Management Modules, RF, Other Products), end-user industry (Consumer Electronics, Telecommunication, Automotive, Industrial, Other End-user Industries), and design (Firm/Soft IP, Hard IP). This report offers actionable insights for industry stakeholders, investors, and strategic decision-makers.
Analog & Mixed Signal IP Industry Market Concentration & Innovation
The Analog & Mixed Signal IP market exhibits a moderately concentrated landscape, with a few major players holding significant market share. Xilinx, Synopsys, and Cadence Design Systems collectively control a substantial portion of the market (xx%), primarily driven by their extensive product portfolios and strong brand recognition. However, smaller, specialized companies like Silicon Creations are gaining traction by offering innovative solutions in niche segments. This competition fuels continuous innovation.
Key Innovation Drivers:
- Miniaturization and power efficiency demands in consumer electronics and IoT devices.
- The increasing adoption of 5G and other advanced wireless technologies driving demand for high-performance RF components.
- Advancements in process technology enabling more sophisticated and integrated solutions.
- Growing demand for automotive electronics and industrial automation.
Regulatory Landscape:
Government regulations, particularly concerning safety and performance standards in automotive and industrial applications, significantly impact product development and market access.
Mergers & Acquisitions (M&A) Activity: The industry has witnessed several significant M&A deals in the past few years, with deal values exceeding xx Million. These transactions often aim to expand product portfolios, gain access to new technologies, or strengthen market presence. For example, the collaboration between Marvell and Analog Devices in 2020 signifies a strategic move toward consolidating 5G technology leadership.
Analog & Mixed Signal IP Industry Industry Trends & Insights
The Analog & Mixed Signal IP market is experiencing robust growth, driven by increasing demand across various end-user industries. The global market is projected to witness a Compound Annual Growth Rate (CAGR) of xx% during the forecast period (2025-2033), reaching a market value of xx Million by 2033. This growth is fueled by several factors:
- The proliferation of connected devices and the Internet of Things (IoT).
- The rapid expansion of the 5G wireless infrastructure.
- The increasing integration of electronics in the automotive sector (Autonomous vehicles, ADAS).
- The rising demand for high-performance computing and data processing capabilities.
- The continued miniaturization and improved power efficiency of electronic devices.
Technological disruptions, such as the adoption of advanced process nodes (e.g., 12nm and below), are enabling higher levels of integration and performance in analog and mixed-signal IPs. Consumer preference for high-quality, power-efficient electronics is also driving demand. However, intense competition among established players and emerging startups creates a dynamic market landscape. Market penetration of various product segments is continuously evolving, with RF components and power management modules witnessing the highest growth rates.
Dominant Markets & Segments in Analog & Mixed Signal IP Industry
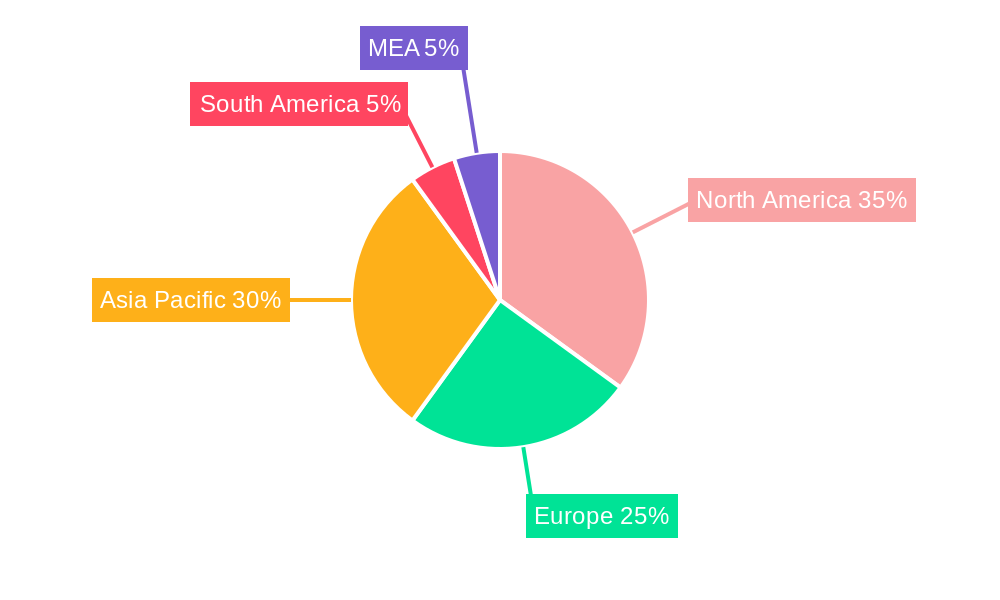
Leading Region/Country: North America currently holds the largest market share, followed by Asia-Pacific. However, Asia-Pacific is projected to experience the fastest growth in the forecast period due to the expanding electronics manufacturing base and the increasing adoption of smartphones, consumer electronics, and automotive applications within the region.
Dominant Segments:
- Product: RF components are currently the dominant segment driven by the growth of 5G and other wireless technologies. Power management modules are also significant owing to the importance of efficient power consumption across various applications.
- End-user Industry: Consumer electronics and automotive represent major market segments. Automotive's share is rapidly increasing with the advent of electric vehicles and advanced driver-assistance systems (ADAS).
- Design: Hard IP dominates the market due to its superior performance and security features; however, soft IP continues to hold a considerable share for its flexibility and cost-effectiveness.
Key Drivers for Regional Dominance:
- North America: Strong presence of major IP vendors, robust R&D investments, and early adoption of advanced technologies.
- Asia-Pacific: Large manufacturing base, burgeoning consumer electronics market, and supportive government policies.
Dominance Analysis: The dominance of specific segments and regions is influenced by economic policies, infrastructure development, government support for technological innovation, and market maturity.
Analog & Mixed Signal IP Industry Product Developments
Recent advancements focus on increased integration, reduced power consumption, improved performance, and enhanced security features. This includes the development of highly integrated SoCs incorporating multiple analog and mixed-signal functionalities and the incorporation of advanced process technologies like FinFET to optimize performance and minimize power consumption. The shift is towards smaller, more power-efficient devices catering to the needs of the growing IoT and mobile markets.
Report Scope & Segmentation Analysis
This report comprehensively analyzes the Analog & Mixed Signal IP market, segmented by product type (A2D and D2A Converter, Power Management Modules, RF, Other Products), end-user industry (Consumer Electronics, Telecommunication, Automotive, Industrial, Other End-user Industries), and design type (Firm/Soft IP, Hard IP). Each segment is analyzed in terms of its current market size, growth projections, competitive dynamics, and key drivers. For example, the Automotive segment is expected to experience rapid growth due to the increasing demand for advanced driver-assistance systems and electric vehicles. Similarly, the RF segment is expected to be a high-growth segment due to the global rollout of 5G networks. The Hard IP segment commands a larger market share owing to its performance advantages over Soft IP, but Soft IP maintains a considerable presence due to cost-effectiveness and flexibility.
Key Drivers of Analog & Mixed Signal IP Industry Growth
Several factors are propelling the growth of the Analog & Mixed Signal IP market:
- Technological advancements: Continuous innovation in semiconductor technology and process nodes drives better performance, power efficiency, and smaller form factors.
- Expanding end-user industries: Growth in automotive electronics, telecommunications, and industrial automation creates substantial demand.
- Increasing demand for connected devices: The proliferation of IoT devices and the expansion of 5G networks necessitates efficient analog and mixed-signal components.
Challenges in the Analog & Mixed Signal IP Industry Sector
Several challenges hinder the industry's growth:
- High development costs: Developing advanced analog and mixed-signal IPs requires significant investments in R&D and specialized expertise.
- Supply chain disruptions: Global supply chain uncertainties, particularly related to semiconductor manufacturing, can impact availability and pricing.
- Intense competition: The presence of several established players and new entrants creates competitive pressures.
Emerging Opportunities in Analog & Mixed Signal IP Industry
Several emerging trends create significant opportunities:
- The rise of AI and machine learning in various applications presents opportunities for specialized analog and mixed-signal IPs.
- Growth in high-speed data transmission technologies and the need for power-efficient solutions create market opportunities.
- Expansion into new applications in healthcare and wearable technology opens new avenues for growth.
Leading Players in the Analog & Mixed Signal IP Industry Market
- Xilinx Inc
- Renesas Electronics Corporation
- Silicon Creations LLC
- Synopsys Inc
- Cadence Design Systems Inc
- VeriSilicon Holdings Co Ltd
- Analog Devices Inc
- Maxim Integrated Products Inc
- Texas Instruments Limited
- ARM Holdings PLC
- Intel Corporation
Key Developments in Analog & Mixed Signal IP Industry Industry
August 2020: Silicon Creations' SerDes technology was deployed in a V-by-One HS receiver for an 8K digital TV SoC by NovatekMicroelectronics Corp., using TSMC's 12nm process. This highlights the increasing demand for high-bandwidth interfaces in advanced display applications.
February 2020: Marvell and Analog Devices announced a technology collaboration leveraging Marvell's 5G digital platform and ADI's wideband RF transceiver technology for 5G base stations. This signifies a strategic move towards providing fully integrated 5G DFE ASIC solutions.
Strategic Outlook for Analog & Mixed Signal IP Industry Market
The Analog & Mixed Signal IP market is poised for sustained growth driven by several factors including the expanding adoption of 5G and other advanced wireless technologies, the continued miniaturization and increasing power efficiency demands in consumer electronics, the significant growth of the automotive electronics sector, and the emergence of new applications in the IoT and other sectors. The market will remain highly competitive, with companies focusing on innovation, strategic partnerships, and efficient supply chains to capitalize on future opportunities.
Analog & Mixed Signal IP Industry Segmentation
-
1. Design
- 1.1. Firm/Soft IP
- 1.2. Hard IP
-
2. Product
- 2.1. A2D and D2A Converter
- 2.2. Power Management Modules
- 2.3. RF
- 2.4. Other Products
-
3. End-user Industry
- 3.1. Consumer Electronics
- 3.2. Telecommunication
- 3.3. Automotive
- 3.4. Industrial
- 3.5. Other End-user Industries
Analog & Mixed Signal IP Industry Segmentation By Geography
- 1. North America
- 2. Europe
- 3. Asia Pacific
- 4. Latin America
- 5. Middle East
Analog & Mixed Signal IP Industry REPORT HIGHLIGHTS
| Aspects | Details |
|---|---|
| Study Period | 2019-2033 |
| Base Year | 2024 |
| Estimated Year | 2025 |
| Forecast Period | 2025-2033 |
| Historical Period | 2019-2024 |
| Growth Rate | CAGR of 15.17% from 2019-2033 |
| Segmentation |
|
Table of Contents
- 1. Introduction
- 1.1. Research Scope
- 1.2. Market Segmentation
- 1.3. Research Methodology
- 1.4. Definitions and Assumptions
- 2. Executive Summary
- 2.1. Introduction
- 3. Market Dynamics
- 3.1. Introduction
- 3.2. Market Drivers
- 3.2.1. Increasing Reusability of AMS Block; Growing Prevalence of Wireless Communications
- 3.3. Market Restrains
- 3.3.1. Complexity and Sensitivity of Analog/Mixed-Signal (AMS) design
- 3.4. Market Trends
- 3.4.1. Telecommunication is Expected Hold a Significant Share
- 4. Market Factor Analysis
- 4.1. Porters Five Forces
- 4.2. Supply/Value Chain
- 4.3. PESTEL analysis
- 4.4. Market Entropy
- 4.5. Patent/Trademark Analysis
- 5. Global Analog & Mixed Signal IP Industry Analysis, Insights and Forecast, 2019-2031
- 5.1. Market Analysis, Insights and Forecast - by Design
- 5.1.1. Firm/Soft IP
- 5.1.2. Hard IP
- 5.2. Market Analysis, Insights and Forecast - by Product
- 5.2.1. A2D and D2A Converter
- 5.2.2. Power Management Modules
- 5.2.3. RF
- 5.2.4. Other Products
- 5.3. Market Analysis, Insights and Forecast - by End-user Industry
- 5.3.1. Consumer Electronics
- 5.3.2. Telecommunication
- 5.3.3. Automotive
- 5.3.4. Industrial
- 5.3.5. Other End-user Industries
- 5.4. Market Analysis, Insights and Forecast - by Region
- 5.4.1. North America
- 5.4.2. Europe
- 5.4.3. Asia Pacific
- 5.4.4. Latin America
- 5.4.5. Middle East
- 5.1. Market Analysis, Insights and Forecast - by Design
- 6. North America Analog & Mixed Signal IP Industry Analysis, Insights and Forecast, 2019-2031
- 6.1. Market Analysis, Insights and Forecast - by Design
- 6.1.1. Firm/Soft IP
- 6.1.2. Hard IP
- 6.2. Market Analysis, Insights and Forecast - by Product
- 6.2.1. A2D and D2A Converter
- 6.2.2. Power Management Modules
- 6.2.3. RF
- 6.2.4. Other Products
- 6.3. Market Analysis, Insights and Forecast - by End-user Industry
- 6.3.1. Consumer Electronics
- 6.3.2. Telecommunication
- 6.3.3. Automotive
- 6.3.4. Industrial
- 6.3.5. Other End-user Industries
- 6.1. Market Analysis, Insights and Forecast - by Design
- 7. Europe Analog & Mixed Signal IP Industry Analysis, Insights and Forecast, 2019-2031
- 7.1. Market Analysis, Insights and Forecast - by Design
- 7.1.1. Firm/Soft IP
- 7.1.2. Hard IP
- 7.2. Market Analysis, Insights and Forecast - by Product
- 7.2.1. A2D and D2A Converter
- 7.2.2. Power Management Modules
- 7.2.3. RF
- 7.2.4. Other Products
- 7.3. Market Analysis, Insights and Forecast - by End-user Industry
- 7.3.1. Consumer Electronics
- 7.3.2. Telecommunication
- 7.3.3. Automotive
- 7.3.4. Industrial
- 7.3.5. Other End-user Industries
- 7.1. Market Analysis, Insights and Forecast - by Design
- 8. Asia Pacific Analog & Mixed Signal IP Industry Analysis, Insights and Forecast, 2019-2031
- 8.1. Market Analysis, Insights and Forecast - by Design
- 8.1.1. Firm/Soft IP
- 8.1.2. Hard IP
- 8.2. Market Analysis, Insights and Forecast - by Product
- 8.2.1. A2D and D2A Converter
- 8.2.2. Power Management Modules
- 8.2.3. RF
- 8.2.4. Other Products
- 8.3. Market Analysis, Insights and Forecast - by End-user Industry
- 8.3.1. Consumer Electronics
- 8.3.2. Telecommunication
- 8.3.3. Automotive
- 8.3.4. Industrial
- 8.3.5. Other End-user Industries
- 8.1. Market Analysis, Insights and Forecast - by Design
- 9. Latin America Analog & Mixed Signal IP Industry Analysis, Insights and Forecast, 2019-2031
- 9.1. Market Analysis, Insights and Forecast - by Design
- 9.1.1. Firm/Soft IP
- 9.1.2. Hard IP
- 9.2. Market Analysis, Insights and Forecast - by Product
- 9.2.1. A2D and D2A Converter
- 9.2.2. Power Management Modules
- 9.2.3. RF
- 9.2.4. Other Products
- 9.3. Market Analysis, Insights and Forecast - by End-user Industry
- 9.3.1. Consumer Electronics
- 9.3.2. Telecommunication
- 9.3.3. Automotive
- 9.3.4. Industrial
- 9.3.5. Other End-user Industries
- 9.1. Market Analysis, Insights and Forecast - by Design
- 10. Middle East Analog & Mixed Signal IP Industry Analysis, Insights and Forecast, 2019-2031
- 10.1. Market Analysis, Insights and Forecast - by Design
- 10.1.1. Firm/Soft IP
- 10.1.2. Hard IP
- 10.2. Market Analysis, Insights and Forecast - by Product
- 10.2.1. A2D and D2A Converter
- 10.2.2. Power Management Modules
- 10.2.3. RF
- 10.2.4. Other Products
- 10.3. Market Analysis, Insights and Forecast - by End-user Industry
- 10.3.1. Consumer Electronics
- 10.3.2. Telecommunication
- 10.3.3. Automotive
- 10.3.4. Industrial
- 10.3.5. Other End-user Industries
- 10.1. Market Analysis, Insights and Forecast - by Design
- 11. North America Analog & Mixed Signal IP Industry Analysis, Insights and Forecast, 2019-2031
- 11.1. Market Analysis, Insights and Forecast - By Country/Sub-region
- 11.1.1 United States
- 11.1.2 Canada
- 11.1.3 Mexico
- 12. Europe Analog & Mixed Signal IP Industry Analysis, Insights and Forecast, 2019-2031
- 12.1. Market Analysis, Insights and Forecast - By Country/Sub-region
- 12.1.1 Germany
- 12.1.2 United Kingdom
- 12.1.3 France
- 12.1.4 Spain
- 12.1.5 Italy
- 12.1.6 Spain
- 12.1.7 Belgium
- 12.1.8 Netherland
- 12.1.9 Nordics
- 12.1.10 Rest of Europe
- 13. Asia Pacific Analog & Mixed Signal IP Industry Analysis, Insights and Forecast, 2019-2031
- 13.1. Market Analysis, Insights and Forecast - By Country/Sub-region
- 13.1.1 China
- 13.1.2 Japan
- 13.1.3 India
- 13.1.4 South Korea
- 13.1.5 Southeast Asia
- 13.1.6 Australia
- 13.1.7 Indonesia
- 13.1.8 Phillipes
- 13.1.9 Singapore
- 13.1.10 Thailandc
- 13.1.11 Rest of Asia Pacific
- 14. South America Analog & Mixed Signal IP Industry Analysis, Insights and Forecast, 2019-2031
- 14.1. Market Analysis, Insights and Forecast - By Country/Sub-region
- 14.1.1 Brazil
- 14.1.2 Argentina
- 14.1.3 Peru
- 14.1.4 Chile
- 14.1.5 Colombia
- 14.1.6 Ecuador
- 14.1.7 Venezuela
- 14.1.8 Rest of South America
- 15. North America Analog & Mixed Signal IP Industry Analysis, Insights and Forecast, 2019-2031
- 15.1. Market Analysis, Insights and Forecast - By Country/Sub-region
- 15.1.1 United States
- 15.1.2 Canada
- 15.1.3 Mexico
- 16. MEA Analog & Mixed Signal IP Industry Analysis, Insights and Forecast, 2019-2031
- 16.1. Market Analysis, Insights and Forecast - By Country/Sub-region
- 16.1.1 United Arab Emirates
- 16.1.2 Saudi Arabia
- 16.1.3 South Africa
- 16.1.4 Rest of Middle East and Africa
- 17. Competitive Analysis
- 17.1. Global Market Share Analysis 2024
- 17.2. Company Profiles
- 17.2.1 Xilinx Inc
- 17.2.1.1. Overview
- 17.2.1.2. Products
- 17.2.1.3. SWOT Analysis
- 17.2.1.4. Recent Developments
- 17.2.1.5. Financials (Based on Availability)
- 17.2.2 Renesas Electronics Corporation
- 17.2.2.1. Overview
- 17.2.2.2. Products
- 17.2.2.3. SWOT Analysis
- 17.2.2.4. Recent Developments
- 17.2.2.5. Financials (Based on Availability)
- 17.2.3 Silicon Creations LLC
- 17.2.3.1. Overview
- 17.2.3.2. Products
- 17.2.3.3. SWOT Analysis
- 17.2.3.4. Recent Developments
- 17.2.3.5. Financials (Based on Availability)
- 17.2.4 Synopsys Inc
- 17.2.4.1. Overview
- 17.2.4.2. Products
- 17.2.4.3. SWOT Analysis
- 17.2.4.4. Recent Developments
- 17.2.4.5. Financials (Based on Availability)
- 17.2.5 Cadence Design Systems Inc
- 17.2.5.1. Overview
- 17.2.5.2. Products
- 17.2.5.3. SWOT Analysis
- 17.2.5.4. Recent Developments
- 17.2.5.5. Financials (Based on Availability)
- 17.2.6 VeriSilicon Holdings Co Ltd
- 17.2.6.1. Overview
- 17.2.6.2. Products
- 17.2.6.3. SWOT Analysis
- 17.2.6.4. Recent Developments
- 17.2.6.5. Financials (Based on Availability)
- 17.2.7 Analog Devices Inc
- 17.2.7.1. Overview
- 17.2.7.2. Products
- 17.2.7.3. SWOT Analysis
- 17.2.7.4. Recent Developments
- 17.2.7.5. Financials (Based on Availability)
- 17.2.8 Maxim Integrated Products Inc
- 17.2.8.1. Overview
- 17.2.8.2. Products
- 17.2.8.3. SWOT Analysis
- 17.2.8.4. Recent Developments
- 17.2.8.5. Financials (Based on Availability)
- 17.2.9 Texas Instruments Limite
- 17.2.9.1. Overview
- 17.2.9.2. Products
- 17.2.9.3. SWOT Analysis
- 17.2.9.4. Recent Developments
- 17.2.9.5. Financials (Based on Availability)
- 17.2.10 ARM Holdings PLC
- 17.2.10.1. Overview
- 17.2.10.2. Products
- 17.2.10.3. SWOT Analysis
- 17.2.10.4. Recent Developments
- 17.2.10.5. Financials (Based on Availability)
- 17.2.11 Intel Corporation
- 17.2.11.1. Overview
- 17.2.11.2. Products
- 17.2.11.3. SWOT Analysis
- 17.2.11.4. Recent Developments
- 17.2.11.5. Financials (Based on Availability)
- 17.2.1 Xilinx Inc
List of Figures
- Figure 1: Global Analog & Mixed Signal IP Industry Revenue Breakdown (Million, %) by Region 2024 & 2032
- Figure 2: North America Analog & Mixed Signal IP Industry Revenue (Million), by Country 2024 & 2032
- Figure 3: North America Analog & Mixed Signal IP Industry Revenue Share (%), by Country 2024 & 2032
- Figure 4: Europe Analog & Mixed Signal IP Industry Revenue (Million), by Country 2024 & 2032
- Figure 5: Europe Analog & Mixed Signal IP Industry Revenue Share (%), by Country 2024 & 2032
- Figure 6: Asia Pacific Analog & Mixed Signal IP Industry Revenue (Million), by Country 2024 & 2032
- Figure 7: Asia Pacific Analog & Mixed Signal IP Industry Revenue Share (%), by Country 2024 & 2032
- Figure 8: South America Analog & Mixed Signal IP Industry Revenue (Million), by Country 2024 & 2032
- Figure 9: South America Analog & Mixed Signal IP Industry Revenue Share (%), by Country 2024 & 2032
- Figure 10: North America Analog & Mixed Signal IP Industry Revenue (Million), by Country 2024 & 2032
- Figure 11: North America Analog & Mixed Signal IP Industry Revenue Share (%), by Country 2024 & 2032
- Figure 12: MEA Analog & Mixed Signal IP Industry Revenue (Million), by Country 2024 & 2032
- Figure 13: MEA Analog & Mixed Signal IP Industry Revenue Share (%), by Country 2024 & 2032
- Figure 14: North America Analog & Mixed Signal IP Industry Revenue (Million), by Design 2024 & 2032
- Figure 15: North America Analog & Mixed Signal IP Industry Revenue Share (%), by Design 2024 & 2032
- Figure 16: North America Analog & Mixed Signal IP Industry Revenue (Million), by Product 2024 & 2032
- Figure 17: North America Analog & Mixed Signal IP Industry Revenue Share (%), by Product 2024 & 2032
- Figure 18: North America Analog & Mixed Signal IP Industry Revenue (Million), by End-user Industry 2024 & 2032
- Figure 19: North America Analog & Mixed Signal IP Industry Revenue Share (%), by End-user Industry 2024 & 2032
- Figure 20: North America Analog & Mixed Signal IP Industry Revenue (Million), by Country 2024 & 2032
- Figure 21: North America Analog & Mixed Signal IP Industry Revenue Share (%), by Country 2024 & 2032
- Figure 22: Europe Analog & Mixed Signal IP Industry Revenue (Million), by Design 2024 & 2032
- Figure 23: Europe Analog & Mixed Signal IP Industry Revenue Share (%), by Design 2024 & 2032
- Figure 24: Europe Analog & Mixed Signal IP Industry Revenue (Million), by Product 2024 & 2032
- Figure 25: Europe Analog & Mixed Signal IP Industry Revenue Share (%), by Product 2024 & 2032
- Figure 26: Europe Analog & Mixed Signal IP Industry Revenue (Million), by End-user Industry 2024 & 2032
- Figure 27: Europe Analog & Mixed Signal IP Industry Revenue Share (%), by End-user Industry 2024 & 2032
- Figure 28: Europe Analog & Mixed Signal IP Industry Revenue (Million), by Country 2024 & 2032
- Figure 29: Europe Analog & Mixed Signal IP Industry Revenue Share (%), by Country 2024 & 2032
- Figure 30: Asia Pacific Analog & Mixed Signal IP Industry Revenue (Million), by Design 2024 & 2032
- Figure 31: Asia Pacific Analog & Mixed Signal IP Industry Revenue Share (%), by Design 2024 & 2032
- Figure 32: Asia Pacific Analog & Mixed Signal IP Industry Revenue (Million), by Product 2024 & 2032
- Figure 33: Asia Pacific Analog & Mixed Signal IP Industry Revenue Share (%), by Product 2024 & 2032
- Figure 34: Asia Pacific Analog & Mixed Signal IP Industry Revenue (Million), by End-user Industry 2024 & 2032
- Figure 35: Asia Pacific Analog & Mixed Signal IP Industry Revenue Share (%), by End-user Industry 2024 & 2032
- Figure 36: Asia Pacific Analog & Mixed Signal IP Industry Revenue (Million), by Country 2024 & 2032
- Figure 37: Asia Pacific Analog & Mixed Signal IP Industry Revenue Share (%), by Country 2024 & 2032
- Figure 38: Latin America Analog & Mixed Signal IP Industry Revenue (Million), by Design 2024 & 2032
- Figure 39: Latin America Analog & Mixed Signal IP Industry Revenue Share (%), by Design 2024 & 2032
- Figure 40: Latin America Analog & Mixed Signal IP Industry Revenue (Million), by Product 2024 & 2032
- Figure 41: Latin America Analog & Mixed Signal IP Industry Revenue Share (%), by Product 2024 & 2032
- Figure 42: Latin America Analog & Mixed Signal IP Industry Revenue (Million), by End-user Industry 2024 & 2032
- Figure 43: Latin America Analog & Mixed Signal IP Industry Revenue Share (%), by End-user Industry 2024 & 2032
- Figure 44: Latin America Analog & Mixed Signal IP Industry Revenue (Million), by Country 2024 & 2032
- Figure 45: Latin America Analog & Mixed Signal IP Industry Revenue Share (%), by Country 2024 & 2032
- Figure 46: Middle East Analog & Mixed Signal IP Industry Revenue (Million), by Design 2024 & 2032
- Figure 47: Middle East Analog & Mixed Signal IP Industry Revenue Share (%), by Design 2024 & 2032
- Figure 48: Middle East Analog & Mixed Signal IP Industry Revenue (Million), by Product 2024 & 2032
- Figure 49: Middle East Analog & Mixed Signal IP Industry Revenue Share (%), by Product 2024 & 2032
- Figure 50: Middle East Analog & Mixed Signal IP Industry Revenue (Million), by End-user Industry 2024 & 2032
- Figure 51: Middle East Analog & Mixed Signal IP Industry Revenue Share (%), by End-user Industry 2024 & 2032
- Figure 52: Middle East Analog & Mixed Signal IP Industry Revenue (Million), by Country 2024 & 2032
- Figure 53: Middle East Analog & Mixed Signal IP Industry Revenue Share (%), by Country 2024 & 2032
List of Tables
- Table 1: Global Analog & Mixed Signal IP Industry Revenue Million Forecast, by Region 2019 & 2032
- Table 2: Global Analog & Mixed Signal IP Industry Revenue Million Forecast, by Design 2019 & 2032
- Table 3: Global Analog & Mixed Signal IP Industry Revenue Million Forecast, by Product 2019 & 2032
- Table 4: Global Analog & Mixed Signal IP Industry Revenue Million Forecast, by End-user Industry 2019 & 2032
- Table 5: Global Analog & Mixed Signal IP Industry Revenue Million Forecast, by Region 2019 & 2032
- Table 6: Global Analog & Mixed Signal IP Industry Revenue Million Forecast, by Country 2019 & 2032
- Table 7: United States Analog & Mixed Signal IP Industry Revenue (Million) Forecast, by Application 2019 & 2032
- Table 8: Canada Analog & Mixed Signal IP Industry Revenue (Million) Forecast, by Application 2019 & 2032
- Table 9: Mexico Analog & Mixed Signal IP Industry Revenue (Million) Forecast, by Application 2019 & 2032
- Table 10: Global Analog & Mixed Signal IP Industry Revenue Million Forecast, by Country 2019 & 2032
- Table 11: Germany Analog & Mixed Signal IP Industry Revenue (Million) Forecast, by Application 2019 & 2032
- Table 12: United Kingdom Analog & Mixed Signal IP Industry Revenue (Million) Forecast, by Application 2019 & 2032
- Table 13: France Analog & Mixed Signal IP Industry Revenue (Million) Forecast, by Application 2019 & 2032
- Table 14: Spain Analog & Mixed Signal IP Industry Revenue (Million) Forecast, by Application 2019 & 2032
- Table 15: Italy Analog & Mixed Signal IP Industry Revenue (Million) Forecast, by Application 2019 & 2032
- Table 16: Spain Analog & Mixed Signal IP Industry Revenue (Million) Forecast, by Application 2019 & 2032
- Table 17: Belgium Analog & Mixed Signal IP Industry Revenue (Million) Forecast, by Application 2019 & 2032
- Table 18: Netherland Analog & Mixed Signal IP Industry Revenue (Million) Forecast, by Application 2019 & 2032
- Table 19: Nordics Analog & Mixed Signal IP Industry Revenue (Million) Forecast, by Application 2019 & 2032
- Table 20: Rest of Europe Analog & Mixed Signal IP Industry Revenue (Million) Forecast, by Application 2019 & 2032
- Table 21: Global Analog & Mixed Signal IP Industry Revenue Million Forecast, by Country 2019 & 2032
- Table 22: China Analog & Mixed Signal IP Industry Revenue (Million) Forecast, by Application 2019 & 2032
- Table 23: Japan Analog & Mixed Signal IP Industry Revenue (Million) Forecast, by Application 2019 & 2032
- Table 24: India Analog & Mixed Signal IP Industry Revenue (Million) Forecast, by Application 2019 & 2032
- Table 25: South Korea Analog & Mixed Signal IP Industry Revenue (Million) Forecast, by Application 2019 & 2032
- Table 26: Southeast Asia Analog & Mixed Signal IP Industry Revenue (Million) Forecast, by Application 2019 & 2032
- Table 27: Australia Analog & Mixed Signal IP Industry Revenue (Million) Forecast, by Application 2019 & 2032
- Table 28: Indonesia Analog & Mixed Signal IP Industry Revenue (Million) Forecast, by Application 2019 & 2032
- Table 29: Phillipes Analog & Mixed Signal IP Industry Revenue (Million) Forecast, by Application 2019 & 2032
- Table 30: Singapore Analog & Mixed Signal IP Industry Revenue (Million) Forecast, by Application 2019 & 2032
- Table 31: Thailandc Analog & Mixed Signal IP Industry Revenue (Million) Forecast, by Application 2019 & 2032
- Table 32: Rest of Asia Pacific Analog & Mixed Signal IP Industry Revenue (Million) Forecast, by Application 2019 & 2032
- Table 33: Global Analog & Mixed Signal IP Industry Revenue Million Forecast, by Country 2019 & 2032
- Table 34: Brazil Analog & Mixed Signal IP Industry Revenue (Million) Forecast, by Application 2019 & 2032
- Table 35: Argentina Analog & Mixed Signal IP Industry Revenue (Million) Forecast, by Application 2019 & 2032
- Table 36: Peru Analog & Mixed Signal IP Industry Revenue (Million) Forecast, by Application 2019 & 2032
- Table 37: Chile Analog & Mixed Signal IP Industry Revenue (Million) Forecast, by Application 2019 & 2032
- Table 38: Colombia Analog & Mixed Signal IP Industry Revenue (Million) Forecast, by Application 2019 & 2032
- Table 39: Ecuador Analog & Mixed Signal IP Industry Revenue (Million) Forecast, by Application 2019 & 2032
- Table 40: Venezuela Analog & Mixed Signal IP Industry Revenue (Million) Forecast, by Application 2019 & 2032
- Table 41: Rest of South America Analog & Mixed Signal IP Industry Revenue (Million) Forecast, by Application 2019 & 2032
- Table 42: Global Analog & Mixed Signal IP Industry Revenue Million Forecast, by Country 2019 & 2032
- Table 43: United States Analog & Mixed Signal IP Industry Revenue (Million) Forecast, by Application 2019 & 2032
- Table 44: Canada Analog & Mixed Signal IP Industry Revenue (Million) Forecast, by Application 2019 & 2032
- Table 45: Mexico Analog & Mixed Signal IP Industry Revenue (Million) Forecast, by Application 2019 & 2032
- Table 46: Global Analog & Mixed Signal IP Industry Revenue Million Forecast, by Country 2019 & 2032
- Table 47: United Arab Emirates Analog & Mixed Signal IP Industry Revenue (Million) Forecast, by Application 2019 & 2032
- Table 48: Saudi Arabia Analog & Mixed Signal IP Industry Revenue (Million) Forecast, by Application 2019 & 2032
- Table 49: South Africa Analog & Mixed Signal IP Industry Revenue (Million) Forecast, by Application 2019 & 2032
- Table 50: Rest of Middle East and Africa Analog & Mixed Signal IP Industry Revenue (Million) Forecast, by Application 2019 & 2032
- Table 51: Global Analog & Mixed Signal IP Industry Revenue Million Forecast, by Design 2019 & 2032
- Table 52: Global Analog & Mixed Signal IP Industry Revenue Million Forecast, by Product 2019 & 2032
- Table 53: Global Analog & Mixed Signal IP Industry Revenue Million Forecast, by End-user Industry 2019 & 2032
- Table 54: Global Analog & Mixed Signal IP Industry Revenue Million Forecast, by Country 2019 & 2032
- Table 55: Global Analog & Mixed Signal IP Industry Revenue Million Forecast, by Design 2019 & 2032
- Table 56: Global Analog & Mixed Signal IP Industry Revenue Million Forecast, by Product 2019 & 2032
- Table 57: Global Analog & Mixed Signal IP Industry Revenue Million Forecast, by End-user Industry 2019 & 2032
- Table 58: Global Analog & Mixed Signal IP Industry Revenue Million Forecast, by Country 2019 & 2032
- Table 59: Global Analog & Mixed Signal IP Industry Revenue Million Forecast, by Design 2019 & 2032
- Table 60: Global Analog & Mixed Signal IP Industry Revenue Million Forecast, by Product 2019 & 2032
- Table 61: Global Analog & Mixed Signal IP Industry Revenue Million Forecast, by End-user Industry 2019 & 2032
- Table 62: Global Analog & Mixed Signal IP Industry Revenue Million Forecast, by Country 2019 & 2032
- Table 63: Global Analog & Mixed Signal IP Industry Revenue Million Forecast, by Design 2019 & 2032
- Table 64: Global Analog & Mixed Signal IP Industry Revenue Million Forecast, by Product 2019 & 2032
- Table 65: Global Analog & Mixed Signal IP Industry Revenue Million Forecast, by End-user Industry 2019 & 2032
- Table 66: Global Analog & Mixed Signal IP Industry Revenue Million Forecast, by Country 2019 & 2032
- Table 67: Global Analog & Mixed Signal IP Industry Revenue Million Forecast, by Design 2019 & 2032
- Table 68: Global Analog & Mixed Signal IP Industry Revenue Million Forecast, by Product 2019 & 2032
- Table 69: Global Analog & Mixed Signal IP Industry Revenue Million Forecast, by End-user Industry 2019 & 2032
- Table 70: Global Analog & Mixed Signal IP Industry Revenue Million Forecast, by Country 2019 & 2032
Frequently Asked Questions
1. What is the projected Compound Annual Growth Rate (CAGR) of the Analog & Mixed Signal IP Industry?
The projected CAGR is approximately 15.17%.
2. Which companies are prominent players in the Analog & Mixed Signal IP Industry?
Key companies in the market include Xilinx Inc, Renesas Electronics Corporation, Silicon Creations LLC, Synopsys Inc, Cadence Design Systems Inc, VeriSilicon Holdings Co Ltd, Analog Devices Inc, Maxim Integrated Products Inc, Texas Instruments Limite, ARM Holdings PLC, Intel Corporation.
3. What are the main segments of the Analog & Mixed Signal IP Industry?
The market segments include Design, Product, End-user Industry.
4. Can you provide details about the market size?
The market size is estimated to be USD 193.82 Million as of 2022.
5. What are some drivers contributing to market growth?
Increasing Reusability of AMS Block; Growing Prevalence of Wireless Communications.
6. What are the notable trends driving market growth?
Telecommunication is Expected Hold a Significant Share.
7. Are there any restraints impacting market growth?
Complexity and Sensitivity of Analog/Mixed-Signal (AMS) design.
8. Can you provide examples of recent developments in the market?
August 2020 - The SerDes Technology of Silicon Creations was deployed as a V-by-One HS receiver in an SoC designed by NovatekMicroelectronics Corp. for an 8K digital TV application. The company designed the frame-rate converter SoC on TSMC's 12nm process.
9. What pricing options are available for accessing the report?
Pricing options include single-user, multi-user, and enterprise licenses priced at USD 4750, USD 5250, and USD 8750 respectively.
10. Is the market size provided in terms of value or volume?
The market size is provided in terms of value, measured in Million.
11. Are there any specific market keywords associated with the report?
Yes, the market keyword associated with the report is "Analog & Mixed Signal IP Industry," which aids in identifying and referencing the specific market segment covered.
12. How do I determine which pricing option suits my needs best?
The pricing options vary based on user requirements and access needs. Individual users may opt for single-user licenses, while businesses requiring broader access may choose multi-user or enterprise licenses for cost-effective access to the report.
13. Are there any additional resources or data provided in the Analog & Mixed Signal IP Industry report?
While the report offers comprehensive insights, it's advisable to review the specific contents or supplementary materials provided to ascertain if additional resources or data are available.
14. How can I stay updated on further developments or reports in the Analog & Mixed Signal IP Industry?
To stay informed about further developments, trends, and reports in the Analog & Mixed Signal IP Industry, consider subscribing to industry newsletters, following relevant companies and organizations, or regularly checking reputable industry news sources and publications.
Methodology
Step 1 - Identification of Relevant Samples Size from Population Database


Step 2 - Approaches for Defining Global Market Size (Value, Volume* & Price*)

Note*: In applicable scenarios
Step 3 - Data Sources
Primary Research
- Web Analytics
- Survey Reports
- Research Institute
- Latest Research Reports
- Opinion Leaders
Secondary Research
- Annual Reports
- White Paper
- Latest Press Release
- Industry Association
- Paid Database
- Investor Presentations

Step 4 - Data Triangulation
Involves using different sources of information in order to increase the validity of a study
These sources are likely to be stakeholders in a program - participants, other researchers, program staff, other community members, and so on.
Then we put all data in single framework & apply various statistical tools to find out the dynamic on the market.
During the analysis stage, feedback from the stakeholder groups would be compared to determine areas of agreement as well as areas of divergence


