
Key Insights
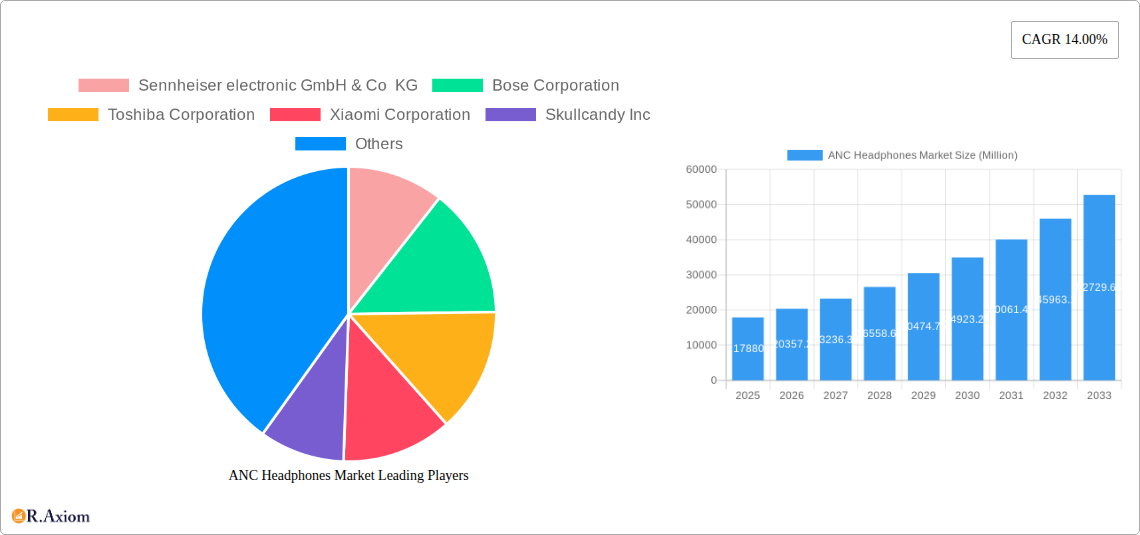
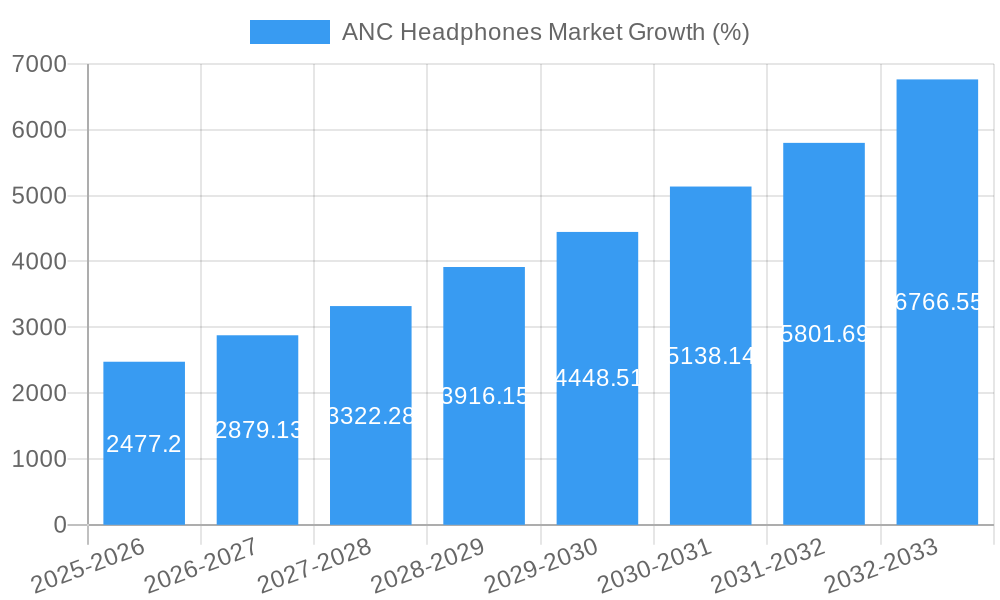
The global Active Noise Cancellation (ANC) headphone market is experiencing robust growth, projected to reach \$17.88 billion in 2025 and exhibiting a Compound Annual Growth Rate (CAGR) of 14.00% from 2025 to 2033. This expansion is driven by several key factors. The increasing demand for enhanced audio experiences in noisy environments, particularly amongst commuters and frequent travelers, is a significant driver. Furthermore, technological advancements leading to smaller, lighter, and more effective ANC technology are making these headphones more appealing and accessible. The rising adoption of wireless technologies, such as Bluetooth, further fuels market growth, alongside the increasing affordability of premium features like ANC. The market is segmented by product type (in-ear, on-ear, over-ear), price range (premium, moderate, low), and distribution channel (retail, online), each segment contributing uniquely to the overall market dynamics. The popularity of wireless and premium ANC headphones is pushing the average selling price upwards, impacting the market's overall valuation. Competition is fierce, with major players such as Sennheiser, Bose, Sony, Apple, and others constantly innovating to capture market share.
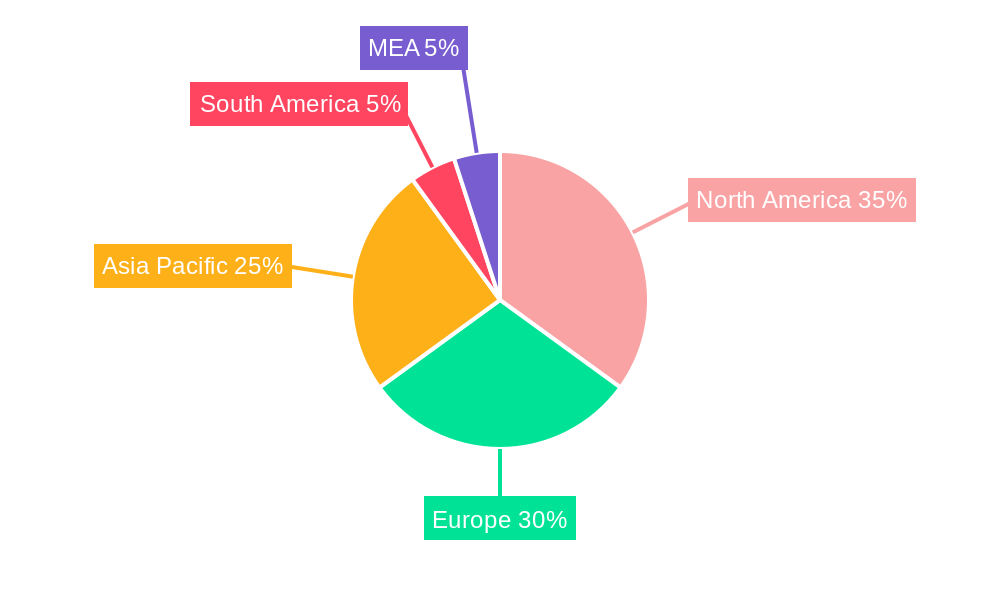
Regional analysis reveals North America and Europe as dominant markets, fueled by high disposable incomes and early adoption of advanced audio technologies. However, the Asia-Pacific region is projected to witness the fastest growth, driven by increasing smartphone penetration, rising middle-class populations, and a growing preference for premium audio products. The market faces challenges, such as the potential for increased competition from smaller brands and the ongoing development of even more sophisticated noise-cancellation technologies which could accelerate the replacement cycle and create market volatility. Nevertheless, the long-term outlook for the ANC headphone market remains positive, fueled by sustained technological advancements and the ever-growing demand for superior audio experiences.
ANC Headphones Market: A Comprehensive Report (2019-2033)
This in-depth report provides a comprehensive analysis of the Active Noise Cancellation (ANC) Headphones market, offering valuable insights for industry stakeholders, investors, and strategic decision-makers. Covering the period from 2019 to 2033, with a focus on 2025, this report dissects market trends, competitive landscapes, and future growth potential. The report leverages extensive data analysis to provide actionable intelligence, facilitating informed business strategies.
ANC Headphones Market Concentration & Innovation
The ANC headphones market exhibits a moderately concentrated landscape, dominated by established players like Sony, Bose, and Apple, who collectively hold a significant market share (estimated at xx%). However, the market also features several smaller, innovative companies, contributing to a dynamic competitive environment. Innovation is a key driver, with continuous advancements in noise cancellation technology, audio quality, and design features. Regulatory frameworks, particularly related to safety and electromagnetic compatibility, influence product development and market access. Product substitutes, such as traditional wired headphones and earplugs, continue to compete, albeit with declining market share. End-user preferences are shifting towards wireless, feature-rich ANC headphones, driving market growth. M&A activities have been moderate, with deal values averaging around xx Million USD in recent years, primarily focused on consolidating technology or expanding distribution channels.
- Key Metrics:
- Market share of top 3 players: xx%
- Average M&A deal value (2019-2024): xx Million USD
- Number of M&A deals (2019-2024): xx
ANC Headphones Market Industry Trends & Insights
The global ANC headphones market is experiencing robust growth, driven by increasing consumer demand for superior audio quality and noise cancellation capabilities. Technological advancements, such as improved ANC algorithms and the integration of smart features, are further fueling market expansion. The market is witnessing a shift towards wireless ANC headphones, propelled by convenience and enhanced user experience. Consumer preferences are trending towards compact designs, longer battery life, and seamless integration with smart devices. Competitive dynamics are intense, with key players focusing on innovation, brand building, and aggressive pricing strategies. The market's CAGR is projected at xx% during the forecast period (2025-2033), with market penetration steadily increasing across diverse demographics.
Dominant Markets & Segments in ANC Headphones Market
The North American region currently holds the largest market share for ANC headphones, fueled by strong consumer spending power and early adoption of new technologies. Within the product type segment, over-ear headphones dominate, accounting for xx% of the market, due to their superior noise cancellation capabilities and audio quality. In the price range segment, the premium segment displays the highest growth rate (xx%), driven by increasing consumer willingness to invest in high-quality audio experiences. Online distribution channels are experiencing significant growth, outpacing retail channels due to ease of access and competitive pricing.
- Key Drivers:
- North America: High disposable income, early technology adoption.
- Over-ear Headphones: Superior noise cancellation and audio quality.
- Premium Price Range: Demand for high-quality audio and features.
- Online Channels: Convenience, competitive pricing, and wider selection.
ANC Headphones Market Product Developments
Recent product innovations in the ANC headphones market focus on enhancing noise cancellation effectiveness, improving battery life, and integrating advanced features like spatial audio and personalized sound profiles. These advancements cater to evolving consumer preferences and enhance the overall user experience. Companies are also concentrating on improving comfort and fit, making the headphones more appealing for extended use. The integration of health and fitness tracking features is also gaining traction, expanding the market beyond entertainment into the wellness sector.
Report Scope & Segmentation Analysis
This report segments the ANC headphone market based on product type (in-ear, on-ear, over-ear), price range (premium, moderate, low), and distribution channel (retail, online). Each segment's growth trajectory is detailed, along with an assessment of competitive dynamics. The over-ear segment is projected to witness the highest growth due to its superior sound quality and noise cancellation. The premium segment shows strong growth, reflecting increased consumer spending on high-quality products. Online sales are expected to surpass retail sales due to e-commerce expansion. Market sizes for each segment are provided for the historical period (2019-2024), base year (2025), and forecast period (2025-2033).
Key Drivers of ANC Headphones Market Growth
Several factors are driving the growth of the ANC headphones market. Technological advancements in noise cancellation and audio processing are key enablers. Increasing disposable income, especially in developing economies, fuels demand for premium audio products. Favorable government regulations promoting technological advancement and consumer electronics adoption also contribute. The rising adoption of smartphones and other smart devices creates a synergy, increasing demand for compatible wireless headphones. Moreover, the growing popularity of remote work and travel further boosts the demand for ANC headphones.
Challenges in the ANC Headphones Market Sector
The ANC headphones market faces challenges, including the high cost of premium models, limiting accessibility for some consumers. Supply chain disruptions can impact production and pricing. Intense competition from established and emerging players exerts pressure on profit margins. Stringent regulatory compliance requirements for safety and electromagnetic compatibility add complexity. Furthermore, fluctuating raw material prices pose a potential risk to manufacturing costs. Finally, counterfeit products can erode market trust and threaten legitimate businesses.
Emerging Opportunities in ANC Headphones Market
Emerging opportunities lie in expanding into untapped markets, particularly in developing countries with growing middle classes. The integration of advanced features like biometric sensors, health monitoring capabilities, and enhanced personalization options presents new growth avenues. The rise of augmented reality (AR) and virtual reality (VR) applications opens up potential for specialized ANC headphones designed for immersive experiences. Moreover, sustainable and eco-friendly headphone designs are increasingly becoming a significant differentiator in the market.
Leading Players in the ANC Headphones Market Market
- Sennheiser electronic GmbH & Co KG
- Bose Corporation
- Toshiba Corporation
- Xiaomi Corporation
- Skullcandy Inc
- AsusTek Computer Inc
- Logitech International S A
- Apple Inc
- Samsung
- Pioneer Corporation
- Sony Corporation
- Plantronics Inc
Key Developments in ANC Headphones Market Industry
- October 2022: Sony India launched the WH-1000XM5, enhancing its industry-leading noise cancellation and audio quality. This significantly impacted the premium segment.
- October 2022: Apple launched second-generation AirPods Pro, featuring improved noise cancellation and an H2 chip, impacting the mid-to-high price range.
- August 2022: Samsung launched Galaxy Buds 2 Pro TWS headphones with enhanced sound and battery life, further intensifying competition in the TWS segment.
Strategic Outlook for ANC Headphones Market Market
The ANC headphones market is poised for continued growth, driven by technological innovation, rising consumer disposable incomes, and the expansion of e-commerce. The integration of new features and the expansion into emerging markets present significant opportunities for market players. Companies focusing on sustainability and personalization are expected to gain a competitive edge. The market’s future is bright, with significant potential for expansion in the coming years.
ANC Headphones Market Segmentation
-
1. Product Type
- 1.1. In-ear
- 1.2. On-ear
- 1.3. Over-ear
-
2. Price Range
- 2.1. Premium
- 2.2. Moderate
- 2.3. Low
-
3. Distribution Channel
- 3.1. Retail
- 3.2. Online
ANC Headphones Market Segmentation By Geography
- 1. North America
- 2. Europe
- 3. Asia Pacific
- 4. Rest of the World
ANC Headphones Market REPORT HIGHLIGHTS
| Aspects | Details |
|---|---|
| Study Period | 2019-2033 |
| Base Year | 2024 |
| Estimated Year | 2025 |
| Forecast Period | 2025-2033 |
| Historical Period | 2019-2024 |
| Growth Rate | CAGR of 14.00% from 2019-2033 |
| Segmentation |
|
Table of Contents
- 1. Introduction
- 1.1. Research Scope
- 1.2. Market Segmentation
- 1.3. Research Methodology
- 1.4. Definitions and Assumptions
- 2. Executive Summary
- 2.1. Introduction
- 3. Market Dynamics
- 3.1. Introduction
- 3.2. Market Drivers
- 3.2.1. Increasing Affinity of the Millennial Population toward Technologically Advanced Appliances
- 3.3. Market Restrains
- 3.3.1. Need for High Capital and Technological Expertise
- 3.4. Market Trends
- 3.4.1. Increasing Adoption of Smart Phones is Expected to Drive the Market Growth
- 4. Market Factor Analysis
- 4.1. Porters Five Forces
- 4.2. Supply/Value Chain
- 4.3. PESTEL analysis
- 4.4. Market Entropy
- 4.5. Patent/Trademark Analysis
- 5. Global ANC Headphones Market Analysis, Insights and Forecast, 2019-2031
- 5.1. Market Analysis, Insights and Forecast - by Product Type
- 5.1.1. In-ear
- 5.1.2. On-ear
- 5.1.3. Over-ear
- 5.2. Market Analysis, Insights and Forecast - by Price Range
- 5.2.1. Premium
- 5.2.2. Moderate
- 5.2.3. Low
- 5.3. Market Analysis, Insights and Forecast - by Distribution Channel
- 5.3.1. Retail
- 5.3.2. Online
- 5.4. Market Analysis, Insights and Forecast - by Region
- 5.4.1. North America
- 5.4.2. Europe
- 5.4.3. Asia Pacific
- 5.4.4. Rest of the World
- 5.1. Market Analysis, Insights and Forecast - by Product Type
- 6. North America ANC Headphones Market Analysis, Insights and Forecast, 2019-2031
- 6.1. Market Analysis, Insights and Forecast - by Product Type
- 6.1.1. In-ear
- 6.1.2. On-ear
- 6.1.3. Over-ear
- 6.2. Market Analysis, Insights and Forecast - by Price Range
- 6.2.1. Premium
- 6.2.2. Moderate
- 6.2.3. Low
- 6.3. Market Analysis, Insights and Forecast - by Distribution Channel
- 6.3.1. Retail
- 6.3.2. Online
- 6.1. Market Analysis, Insights and Forecast - by Product Type
- 7. Europe ANC Headphones Market Analysis, Insights and Forecast, 2019-2031
- 7.1. Market Analysis, Insights and Forecast - by Product Type
- 7.1.1. In-ear
- 7.1.2. On-ear
- 7.1.3. Over-ear
- 7.2. Market Analysis, Insights and Forecast - by Price Range
- 7.2.1. Premium
- 7.2.2. Moderate
- 7.2.3. Low
- 7.3. Market Analysis, Insights and Forecast - by Distribution Channel
- 7.3.1. Retail
- 7.3.2. Online
- 7.1. Market Analysis, Insights and Forecast - by Product Type
- 8. Asia Pacific ANC Headphones Market Analysis, Insights and Forecast, 2019-2031
- 8.1. Market Analysis, Insights and Forecast - by Product Type
- 8.1.1. In-ear
- 8.1.2. On-ear
- 8.1.3. Over-ear
- 8.2. Market Analysis, Insights and Forecast - by Price Range
- 8.2.1. Premium
- 8.2.2. Moderate
- 8.2.3. Low
- 8.3. Market Analysis, Insights and Forecast - by Distribution Channel
- 8.3.1. Retail
- 8.3.2. Online
- 8.1. Market Analysis, Insights and Forecast - by Product Type
- 9. Rest of the World ANC Headphones Market Analysis, Insights and Forecast, 2019-2031
- 9.1. Market Analysis, Insights and Forecast - by Product Type
- 9.1.1. In-ear
- 9.1.2. On-ear
- 9.1.3. Over-ear
- 9.2. Market Analysis, Insights and Forecast - by Price Range
- 9.2.1. Premium
- 9.2.2. Moderate
- 9.2.3. Low
- 9.3. Market Analysis, Insights and Forecast - by Distribution Channel
- 9.3.1. Retail
- 9.3.2. Online
- 9.1. Market Analysis, Insights and Forecast - by Product Type
- 10. North America ANC Headphones Market Analysis, Insights and Forecast, 2019-2031
- 10.1. Market Analysis, Insights and Forecast - By Country/Sub-region
- 10.1.1 United States
- 10.1.2 Canada
- 10.1.3 Mexico
- 11. Europe ANC Headphones Market Analysis, Insights and Forecast, 2019-2031
- 11.1. Market Analysis, Insights and Forecast - By Country/Sub-region
- 11.1.1 Germany
- 11.1.2 United Kingdom
- 11.1.3 France
- 11.1.4 Spain
- 11.1.5 Italy
- 11.1.6 Spain
- 11.1.7 Belgium
- 11.1.8 Netherland
- 11.1.9 Nordics
- 11.1.10 Rest of Europe
- 12. Asia Pacific ANC Headphones Market Analysis, Insights and Forecast, 2019-2031
- 12.1. Market Analysis, Insights and Forecast - By Country/Sub-region
- 12.1.1 China
- 12.1.2 Japan
- 12.1.3 India
- 12.1.4 South Korea
- 12.1.5 Southeast Asia
- 12.1.6 Australia
- 12.1.7 Indonesia
- 12.1.8 Phillipes
- 12.1.9 Singapore
- 12.1.10 Thailandc
- 12.1.11 Rest of Asia Pacific
- 13. South America ANC Headphones Market Analysis, Insights and Forecast, 2019-2031
- 13.1. Market Analysis, Insights and Forecast - By Country/Sub-region
- 13.1.1 Brazil
- 13.1.2 Argentina
- 13.1.3 Peru
- 13.1.4 Chile
- 13.1.5 Colombia
- 13.1.6 Ecuador
- 13.1.7 Venezuela
- 13.1.8 Rest of South America
- 14. North America ANC Headphones Market Analysis, Insights and Forecast, 2019-2031
- 14.1. Market Analysis, Insights and Forecast - By Country/Sub-region
- 14.1.1 United States
- 14.1.2 Canada
- 14.1.3 Mexico
- 15. MEA ANC Headphones Market Analysis, Insights and Forecast, 2019-2031
- 15.1. Market Analysis, Insights and Forecast - By Country/Sub-region
- 15.1.1 United Arab Emirates
- 15.1.2 Saudi Arabia
- 15.1.3 South Africa
- 15.1.4 Rest of Middle East and Africa
- 16. Competitive Analysis
- 16.1. Global Market Share Analysis 2024
- 16.2. Company Profiles
- 16.2.1 Sennheiser electronic GmbH & Co KG
- 16.2.1.1. Overview
- 16.2.1.2. Products
- 16.2.1.3. SWOT Analysis
- 16.2.1.4. Recent Developments
- 16.2.1.5. Financials (Based on Availability)
- 16.2.2 Bose Corporation
- 16.2.2.1. Overview
- 16.2.2.2. Products
- 16.2.2.3. SWOT Analysis
- 16.2.2.4. Recent Developments
- 16.2.2.5. Financials (Based on Availability)
- 16.2.3 Toshiba Corporation
- 16.2.3.1. Overview
- 16.2.3.2. Products
- 16.2.3.3. SWOT Analysis
- 16.2.3.4. Recent Developments
- 16.2.3.5. Financials (Based on Availability)
- 16.2.4 Xiaomi Corporation
- 16.2.4.1. Overview
- 16.2.4.2. Products
- 16.2.4.3. SWOT Analysis
- 16.2.4.4. Recent Developments
- 16.2.4.5. Financials (Based on Availability)
- 16.2.5 Skullcandy Inc
- 16.2.5.1. Overview
- 16.2.5.2. Products
- 16.2.5.3. SWOT Analysis
- 16.2.5.4. Recent Developments
- 16.2.5.5. Financials (Based on Availability)
- 16.2.6 AsusTek Computer Inc
- 16.2.6.1. Overview
- 16.2.6.2. Products
- 16.2.6.3. SWOT Analysis
- 16.2.6.4. Recent Developments
- 16.2.6.5. Financials (Based on Availability)
- 16.2.7 Logitech International S A
- 16.2.7.1. Overview
- 16.2.7.2. Products
- 16.2.7.3. SWOT Analysis
- 16.2.7.4. Recent Developments
- 16.2.7.5. Financials (Based on Availability)
- 16.2.8 Apple Inc
- 16.2.8.1. Overview
- 16.2.8.2. Products
- 16.2.8.3. SWOT Analysis
- 16.2.8.4. Recent Developments
- 16.2.8.5. Financials (Based on Availability)
- 16.2.9 Samsung
- 16.2.9.1. Overview
- 16.2.9.2. Products
- 16.2.9.3. SWOT Analysis
- 16.2.9.4. Recent Developments
- 16.2.9.5. Financials (Based on Availability)
- 16.2.10 Pioneer Corporation
- 16.2.10.1. Overview
- 16.2.10.2. Products
- 16.2.10.3. SWOT Analysis
- 16.2.10.4. Recent Developments
- 16.2.10.5. Financials (Based on Availability)
- 16.2.11 Sony Corporation
- 16.2.11.1. Overview
- 16.2.11.2. Products
- 16.2.11.3. SWOT Analysis
- 16.2.11.4. Recent Developments
- 16.2.11.5. Financials (Based on Availability)
- 16.2.12 Plantronics Inc
- 16.2.12.1. Overview
- 16.2.12.2. Products
- 16.2.12.3. SWOT Analysis
- 16.2.12.4. Recent Developments
- 16.2.12.5. Financials (Based on Availability)
- 16.2.1 Sennheiser electronic GmbH & Co KG
List of Figures
- Figure 1: Global ANC Headphones Market Revenue Breakdown (Million, %) by Region 2024 & 2032
- Figure 2: Global ANC Headphones Market Volume Breakdown (K Unit, %) by Region 2024 & 2032
- Figure 3: North America ANC Headphones Market Revenue (Million), by Country 2024 & 2032
- Figure 4: North America ANC Headphones Market Volume (K Unit), by Country 2024 & 2032
- Figure 5: North America ANC Headphones Market Revenue Share (%), by Country 2024 & 2032
- Figure 6: North America ANC Headphones Market Volume Share (%), by Country 2024 & 2032
- Figure 7: Europe ANC Headphones Market Revenue (Million), by Country 2024 & 2032
- Figure 8: Europe ANC Headphones Market Volume (K Unit), by Country 2024 & 2032
- Figure 9: Europe ANC Headphones Market Revenue Share (%), by Country 2024 & 2032
- Figure 10: Europe ANC Headphones Market Volume Share (%), by Country 2024 & 2032
- Figure 11: Asia Pacific ANC Headphones Market Revenue (Million), by Country 2024 & 2032
- Figure 12: Asia Pacific ANC Headphones Market Volume (K Unit), by Country 2024 & 2032
- Figure 13: Asia Pacific ANC Headphones Market Revenue Share (%), by Country 2024 & 2032
- Figure 14: Asia Pacific ANC Headphones Market Volume Share (%), by Country 2024 & 2032
- Figure 15: South America ANC Headphones Market Revenue (Million), by Country 2024 & 2032
- Figure 16: South America ANC Headphones Market Volume (K Unit), by Country 2024 & 2032
- Figure 17: South America ANC Headphones Market Revenue Share (%), by Country 2024 & 2032
- Figure 18: South America ANC Headphones Market Volume Share (%), by Country 2024 & 2032
- Figure 19: North America ANC Headphones Market Revenue (Million), by Country 2024 & 2032
- Figure 20: North America ANC Headphones Market Volume (K Unit), by Country 2024 & 2032
- Figure 21: North America ANC Headphones Market Revenue Share (%), by Country 2024 & 2032
- Figure 22: North America ANC Headphones Market Volume Share (%), by Country 2024 & 2032
- Figure 23: MEA ANC Headphones Market Revenue (Million), by Country 2024 & 2032
- Figure 24: MEA ANC Headphones Market Volume (K Unit), by Country 2024 & 2032
- Figure 25: MEA ANC Headphones Market Revenue Share (%), by Country 2024 & 2032
- Figure 26: MEA ANC Headphones Market Volume Share (%), by Country 2024 & 2032
- Figure 27: North America ANC Headphones Market Revenue (Million), by Product Type 2024 & 2032
- Figure 28: North America ANC Headphones Market Volume (K Unit), by Product Type 2024 & 2032
- Figure 29: North America ANC Headphones Market Revenue Share (%), by Product Type 2024 & 2032
- Figure 30: North America ANC Headphones Market Volume Share (%), by Product Type 2024 & 2032
- Figure 31: North America ANC Headphones Market Revenue (Million), by Price Range 2024 & 2032
- Figure 32: North America ANC Headphones Market Volume (K Unit), by Price Range 2024 & 2032
- Figure 33: North America ANC Headphones Market Revenue Share (%), by Price Range 2024 & 2032
- Figure 34: North America ANC Headphones Market Volume Share (%), by Price Range 2024 & 2032
- Figure 35: North America ANC Headphones Market Revenue (Million), by Distribution Channel 2024 & 2032
- Figure 36: North America ANC Headphones Market Volume (K Unit), by Distribution Channel 2024 & 2032
- Figure 37: North America ANC Headphones Market Revenue Share (%), by Distribution Channel 2024 & 2032
- Figure 38: North America ANC Headphones Market Volume Share (%), by Distribution Channel 2024 & 2032
- Figure 39: North America ANC Headphones Market Revenue (Million), by Country 2024 & 2032
- Figure 40: North America ANC Headphones Market Volume (K Unit), by Country 2024 & 2032
- Figure 41: North America ANC Headphones Market Revenue Share (%), by Country 2024 & 2032
- Figure 42: North America ANC Headphones Market Volume Share (%), by Country 2024 & 2032
- Figure 43: Europe ANC Headphones Market Revenue (Million), by Product Type 2024 & 2032
- Figure 44: Europe ANC Headphones Market Volume (K Unit), by Product Type 2024 & 2032
- Figure 45: Europe ANC Headphones Market Revenue Share (%), by Product Type 2024 & 2032
- Figure 46: Europe ANC Headphones Market Volume Share (%), by Product Type 2024 & 2032
- Figure 47: Europe ANC Headphones Market Revenue (Million), by Price Range 2024 & 2032
- Figure 48: Europe ANC Headphones Market Volume (K Unit), by Price Range 2024 & 2032
- Figure 49: Europe ANC Headphones Market Revenue Share (%), by Price Range 2024 & 2032
- Figure 50: Europe ANC Headphones Market Volume Share (%), by Price Range 2024 & 2032
- Figure 51: Europe ANC Headphones Market Revenue (Million), by Distribution Channel 2024 & 2032
- Figure 52: Europe ANC Headphones Market Volume (K Unit), by Distribution Channel 2024 & 2032
- Figure 53: Europe ANC Headphones Market Revenue Share (%), by Distribution Channel 2024 & 2032
- Figure 54: Europe ANC Headphones Market Volume Share (%), by Distribution Channel 2024 & 2032
- Figure 55: Europe ANC Headphones Market Revenue (Million), by Country 2024 & 2032
- Figure 56: Europe ANC Headphones Market Volume (K Unit), by Country 2024 & 2032
- Figure 57: Europe ANC Headphones Market Revenue Share (%), by Country 2024 & 2032
- Figure 58: Europe ANC Headphones Market Volume Share (%), by Country 2024 & 2032
- Figure 59: Asia Pacific ANC Headphones Market Revenue (Million), by Product Type 2024 & 2032
- Figure 60: Asia Pacific ANC Headphones Market Volume (K Unit), by Product Type 2024 & 2032
- Figure 61: Asia Pacific ANC Headphones Market Revenue Share (%), by Product Type 2024 & 2032
- Figure 62: Asia Pacific ANC Headphones Market Volume Share (%), by Product Type 2024 & 2032
- Figure 63: Asia Pacific ANC Headphones Market Revenue (Million), by Price Range 2024 & 2032
- Figure 64: Asia Pacific ANC Headphones Market Volume (K Unit), by Price Range 2024 & 2032
- Figure 65: Asia Pacific ANC Headphones Market Revenue Share (%), by Price Range 2024 & 2032
- Figure 66: Asia Pacific ANC Headphones Market Volume Share (%), by Price Range 2024 & 2032
- Figure 67: Asia Pacific ANC Headphones Market Revenue (Million), by Distribution Channel 2024 & 2032
- Figure 68: Asia Pacific ANC Headphones Market Volume (K Unit), by Distribution Channel 2024 & 2032
- Figure 69: Asia Pacific ANC Headphones Market Revenue Share (%), by Distribution Channel 2024 & 2032
- Figure 70: Asia Pacific ANC Headphones Market Volume Share (%), by Distribution Channel 2024 & 2032
- Figure 71: Asia Pacific ANC Headphones Market Revenue (Million), by Country 2024 & 2032
- Figure 72: Asia Pacific ANC Headphones Market Volume (K Unit), by Country 2024 & 2032
- Figure 73: Asia Pacific ANC Headphones Market Revenue Share (%), by Country 2024 & 2032
- Figure 74: Asia Pacific ANC Headphones Market Volume Share (%), by Country 2024 & 2032
- Figure 75: Rest of the World ANC Headphones Market Revenue (Million), by Product Type 2024 & 2032
- Figure 76: Rest of the World ANC Headphones Market Volume (K Unit), by Product Type 2024 & 2032
- Figure 77: Rest of the World ANC Headphones Market Revenue Share (%), by Product Type 2024 & 2032
- Figure 78: Rest of the World ANC Headphones Market Volume Share (%), by Product Type 2024 & 2032
- Figure 79: Rest of the World ANC Headphones Market Revenue (Million), by Price Range 2024 & 2032
- Figure 80: Rest of the World ANC Headphones Market Volume (K Unit), by Price Range 2024 & 2032
- Figure 81: Rest of the World ANC Headphones Market Revenue Share (%), by Price Range 2024 & 2032
- Figure 82: Rest of the World ANC Headphones Market Volume Share (%), by Price Range 2024 & 2032
- Figure 83: Rest of the World ANC Headphones Market Revenue (Million), by Distribution Channel 2024 & 2032
- Figure 84: Rest of the World ANC Headphones Market Volume (K Unit), by Distribution Channel 2024 & 2032
- Figure 85: Rest of the World ANC Headphones Market Revenue Share (%), by Distribution Channel 2024 & 2032
- Figure 86: Rest of the World ANC Headphones Market Volume Share (%), by Distribution Channel 2024 & 2032
- Figure 87: Rest of the World ANC Headphones Market Revenue (Million), by Country 2024 & 2032
- Figure 88: Rest of the World ANC Headphones Market Volume (K Unit), by Country 2024 & 2032
- Figure 89: Rest of the World ANC Headphones Market Revenue Share (%), by Country 2024 & 2032
- Figure 90: Rest of the World ANC Headphones Market Volume Share (%), by Country 2024 & 2032
List of Tables
- Table 1: Global ANC Headphones Market Revenue Million Forecast, by Region 2019 & 2032
- Table 2: Global ANC Headphones Market Volume K Unit Forecast, by Region 2019 & 2032
- Table 3: Global ANC Headphones Market Revenue Million Forecast, by Product Type 2019 & 2032
- Table 4: Global ANC Headphones Market Volume K Unit Forecast, by Product Type 2019 & 2032
- Table 5: Global ANC Headphones Market Revenue Million Forecast, by Price Range 2019 & 2032
- Table 6: Global ANC Headphones Market Volume K Unit Forecast, by Price Range 2019 & 2032
- Table 7: Global ANC Headphones Market Revenue Million Forecast, by Distribution Channel 2019 & 2032
- Table 8: Global ANC Headphones Market Volume K Unit Forecast, by Distribution Channel 2019 & 2032
- Table 9: Global ANC Headphones Market Revenue Million Forecast, by Region 2019 & 2032
- Table 10: Global ANC Headphones Market Volume K Unit Forecast, by Region 2019 & 2032
- Table 11: Global ANC Headphones Market Revenue Million Forecast, by Country 2019 & 2032
- Table 12: Global ANC Headphones Market Volume K Unit Forecast, by Country 2019 & 2032
- Table 13: United States ANC Headphones Market Revenue (Million) Forecast, by Application 2019 & 2032
- Table 14: United States ANC Headphones Market Volume (K Unit) Forecast, by Application 2019 & 2032
- Table 15: Canada ANC Headphones Market Revenue (Million) Forecast, by Application 2019 & 2032
- Table 16: Canada ANC Headphones Market Volume (K Unit) Forecast, by Application 2019 & 2032
- Table 17: Mexico ANC Headphones Market Revenue (Million) Forecast, by Application 2019 & 2032
- Table 18: Mexico ANC Headphones Market Volume (K Unit) Forecast, by Application 2019 & 2032
- Table 19: Global ANC Headphones Market Revenue Million Forecast, by Country 2019 & 2032
- Table 20: Global ANC Headphones Market Volume K Unit Forecast, by Country 2019 & 2032
- Table 21: Germany ANC Headphones Market Revenue (Million) Forecast, by Application 2019 & 2032
- Table 22: Germany ANC Headphones Market Volume (K Unit) Forecast, by Application 2019 & 2032
- Table 23: United Kingdom ANC Headphones Market Revenue (Million) Forecast, by Application 2019 & 2032
- Table 24: United Kingdom ANC Headphones Market Volume (K Unit) Forecast, by Application 2019 & 2032
- Table 25: France ANC Headphones Market Revenue (Million) Forecast, by Application 2019 & 2032
- Table 26: France ANC Headphones Market Volume (K Unit) Forecast, by Application 2019 & 2032
- Table 27: Spain ANC Headphones Market Revenue (Million) Forecast, by Application 2019 & 2032
- Table 28: Spain ANC Headphones Market Volume (K Unit) Forecast, by Application 2019 & 2032
- Table 29: Italy ANC Headphones Market Revenue (Million) Forecast, by Application 2019 & 2032
- Table 30: Italy ANC Headphones Market Volume (K Unit) Forecast, by Application 2019 & 2032
- Table 31: Spain ANC Headphones Market Revenue (Million) Forecast, by Application 2019 & 2032
- Table 32: Spain ANC Headphones Market Volume (K Unit) Forecast, by Application 2019 & 2032
- Table 33: Belgium ANC Headphones Market Revenue (Million) Forecast, by Application 2019 & 2032
- Table 34: Belgium ANC Headphones Market Volume (K Unit) Forecast, by Application 2019 & 2032
- Table 35: Netherland ANC Headphones Market Revenue (Million) Forecast, by Application 2019 & 2032
- Table 36: Netherland ANC Headphones Market Volume (K Unit) Forecast, by Application 2019 & 2032
- Table 37: Nordics ANC Headphones Market Revenue (Million) Forecast, by Application 2019 & 2032
- Table 38: Nordics ANC Headphones Market Volume (K Unit) Forecast, by Application 2019 & 2032
- Table 39: Rest of Europe ANC Headphones Market Revenue (Million) Forecast, by Application 2019 & 2032
- Table 40: Rest of Europe ANC Headphones Market Volume (K Unit) Forecast, by Application 2019 & 2032
- Table 41: Global ANC Headphones Market Revenue Million Forecast, by Country 2019 & 2032
- Table 42: Global ANC Headphones Market Volume K Unit Forecast, by Country 2019 & 2032
- Table 43: China ANC Headphones Market Revenue (Million) Forecast, by Application 2019 & 2032
- Table 44: China ANC Headphones Market Volume (K Unit) Forecast, by Application 2019 & 2032
- Table 45: Japan ANC Headphones Market Revenue (Million) Forecast, by Application 2019 & 2032
- Table 46: Japan ANC Headphones Market Volume (K Unit) Forecast, by Application 2019 & 2032
- Table 47: India ANC Headphones Market Revenue (Million) Forecast, by Application 2019 & 2032
- Table 48: India ANC Headphones Market Volume (K Unit) Forecast, by Application 2019 & 2032
- Table 49: South Korea ANC Headphones Market Revenue (Million) Forecast, by Application 2019 & 2032
- Table 50: South Korea ANC Headphones Market Volume (K Unit) Forecast, by Application 2019 & 2032
- Table 51: Southeast Asia ANC Headphones Market Revenue (Million) Forecast, by Application 2019 & 2032
- Table 52: Southeast Asia ANC Headphones Market Volume (K Unit) Forecast, by Application 2019 & 2032
- Table 53: Australia ANC Headphones Market Revenue (Million) Forecast, by Application 2019 & 2032
- Table 54: Australia ANC Headphones Market Volume (K Unit) Forecast, by Application 2019 & 2032
- Table 55: Indonesia ANC Headphones Market Revenue (Million) Forecast, by Application 2019 & 2032
- Table 56: Indonesia ANC Headphones Market Volume (K Unit) Forecast, by Application 2019 & 2032
- Table 57: Phillipes ANC Headphones Market Revenue (Million) Forecast, by Application 2019 & 2032
- Table 58: Phillipes ANC Headphones Market Volume (K Unit) Forecast, by Application 2019 & 2032
- Table 59: Singapore ANC Headphones Market Revenue (Million) Forecast, by Application 2019 & 2032
- Table 60: Singapore ANC Headphones Market Volume (K Unit) Forecast, by Application 2019 & 2032
- Table 61: Thailandc ANC Headphones Market Revenue (Million) Forecast, by Application 2019 & 2032
- Table 62: Thailandc ANC Headphones Market Volume (K Unit) Forecast, by Application 2019 & 2032
- Table 63: Rest of Asia Pacific ANC Headphones Market Revenue (Million) Forecast, by Application 2019 & 2032
- Table 64: Rest of Asia Pacific ANC Headphones Market Volume (K Unit) Forecast, by Application 2019 & 2032
- Table 65: Global ANC Headphones Market Revenue Million Forecast, by Country 2019 & 2032
- Table 66: Global ANC Headphones Market Volume K Unit Forecast, by Country 2019 & 2032
- Table 67: Brazil ANC Headphones Market Revenue (Million) Forecast, by Application 2019 & 2032
- Table 68: Brazil ANC Headphones Market Volume (K Unit) Forecast, by Application 2019 & 2032
- Table 69: Argentina ANC Headphones Market Revenue (Million) Forecast, by Application 2019 & 2032
- Table 70: Argentina ANC Headphones Market Volume (K Unit) Forecast, by Application 2019 & 2032
- Table 71: Peru ANC Headphones Market Revenue (Million) Forecast, by Application 2019 & 2032
- Table 72: Peru ANC Headphones Market Volume (K Unit) Forecast, by Application 2019 & 2032
- Table 73: Chile ANC Headphones Market Revenue (Million) Forecast, by Application 2019 & 2032
- Table 74: Chile ANC Headphones Market Volume (K Unit) Forecast, by Application 2019 & 2032
- Table 75: Colombia ANC Headphones Market Revenue (Million) Forecast, by Application 2019 & 2032
- Table 76: Colombia ANC Headphones Market Volume (K Unit) Forecast, by Application 2019 & 2032
- Table 77: Ecuador ANC Headphones Market Revenue (Million) Forecast, by Application 2019 & 2032
- Table 78: Ecuador ANC Headphones Market Volume (K Unit) Forecast, by Application 2019 & 2032
- Table 79: Venezuela ANC Headphones Market Revenue (Million) Forecast, by Application 2019 & 2032
- Table 80: Venezuela ANC Headphones Market Volume (K Unit) Forecast, by Application 2019 & 2032
- Table 81: Rest of South America ANC Headphones Market Revenue (Million) Forecast, by Application 2019 & 2032
- Table 82: Rest of South America ANC Headphones Market Volume (K Unit) Forecast, by Application 2019 & 2032
- Table 83: Global ANC Headphones Market Revenue Million Forecast, by Country 2019 & 2032
- Table 84: Global ANC Headphones Market Volume K Unit Forecast, by Country 2019 & 2032
- Table 85: United States ANC Headphones Market Revenue (Million) Forecast, by Application 2019 & 2032
- Table 86: United States ANC Headphones Market Volume (K Unit) Forecast, by Application 2019 & 2032
- Table 87: Canada ANC Headphones Market Revenue (Million) Forecast, by Application 2019 & 2032
- Table 88: Canada ANC Headphones Market Volume (K Unit) Forecast, by Application 2019 & 2032
- Table 89: Mexico ANC Headphones Market Revenue (Million) Forecast, by Application 2019 & 2032
- Table 90: Mexico ANC Headphones Market Volume (K Unit) Forecast, by Application 2019 & 2032
- Table 91: Global ANC Headphones Market Revenue Million Forecast, by Country 2019 & 2032
- Table 92: Global ANC Headphones Market Volume K Unit Forecast, by Country 2019 & 2032
- Table 93: United Arab Emirates ANC Headphones Market Revenue (Million) Forecast, by Application 2019 & 2032
- Table 94: United Arab Emirates ANC Headphones Market Volume (K Unit) Forecast, by Application 2019 & 2032
- Table 95: Saudi Arabia ANC Headphones Market Revenue (Million) Forecast, by Application 2019 & 2032
- Table 96: Saudi Arabia ANC Headphones Market Volume (K Unit) Forecast, by Application 2019 & 2032
- Table 97: South Africa ANC Headphones Market Revenue (Million) Forecast, by Application 2019 & 2032
- Table 98: South Africa ANC Headphones Market Volume (K Unit) Forecast, by Application 2019 & 2032
- Table 99: Rest of Middle East and Africa ANC Headphones Market Revenue (Million) Forecast, by Application 2019 & 2032
- Table 100: Rest of Middle East and Africa ANC Headphones Market Volume (K Unit) Forecast, by Application 2019 & 2032
- Table 101: Global ANC Headphones Market Revenue Million Forecast, by Product Type 2019 & 2032
- Table 102: Global ANC Headphones Market Volume K Unit Forecast, by Product Type 2019 & 2032
- Table 103: Global ANC Headphones Market Revenue Million Forecast, by Price Range 2019 & 2032
- Table 104: Global ANC Headphones Market Volume K Unit Forecast, by Price Range 2019 & 2032
- Table 105: Global ANC Headphones Market Revenue Million Forecast, by Distribution Channel 2019 & 2032
- Table 106: Global ANC Headphones Market Volume K Unit Forecast, by Distribution Channel 2019 & 2032
- Table 107: Global ANC Headphones Market Revenue Million Forecast, by Country 2019 & 2032
- Table 108: Global ANC Headphones Market Volume K Unit Forecast, by Country 2019 & 2032
- Table 109: Global ANC Headphones Market Revenue Million Forecast, by Product Type 2019 & 2032
- Table 110: Global ANC Headphones Market Volume K Unit Forecast, by Product Type 2019 & 2032
- Table 111: Global ANC Headphones Market Revenue Million Forecast, by Price Range 2019 & 2032
- Table 112: Global ANC Headphones Market Volume K Unit Forecast, by Price Range 2019 & 2032
- Table 113: Global ANC Headphones Market Revenue Million Forecast, by Distribution Channel 2019 & 2032
- Table 114: Global ANC Headphones Market Volume K Unit Forecast, by Distribution Channel 2019 & 2032
- Table 115: Global ANC Headphones Market Revenue Million Forecast, by Country 2019 & 2032
- Table 116: Global ANC Headphones Market Volume K Unit Forecast, by Country 2019 & 2032
- Table 117: Global ANC Headphones Market Revenue Million Forecast, by Product Type 2019 & 2032
- Table 118: Global ANC Headphones Market Volume K Unit Forecast, by Product Type 2019 & 2032
- Table 119: Global ANC Headphones Market Revenue Million Forecast, by Price Range 2019 & 2032
- Table 120: Global ANC Headphones Market Volume K Unit Forecast, by Price Range 2019 & 2032
- Table 121: Global ANC Headphones Market Revenue Million Forecast, by Distribution Channel 2019 & 2032
- Table 122: Global ANC Headphones Market Volume K Unit Forecast, by Distribution Channel 2019 & 2032
- Table 123: Global ANC Headphones Market Revenue Million Forecast, by Country 2019 & 2032
- Table 124: Global ANC Headphones Market Volume K Unit Forecast, by Country 2019 & 2032
- Table 125: Global ANC Headphones Market Revenue Million Forecast, by Product Type 2019 & 2032
- Table 126: Global ANC Headphones Market Volume K Unit Forecast, by Product Type 2019 & 2032
- Table 127: Global ANC Headphones Market Revenue Million Forecast, by Price Range 2019 & 2032
- Table 128: Global ANC Headphones Market Volume K Unit Forecast, by Price Range 2019 & 2032
- Table 129: Global ANC Headphones Market Revenue Million Forecast, by Distribution Channel 2019 & 2032
- Table 130: Global ANC Headphones Market Volume K Unit Forecast, by Distribution Channel 2019 & 2032
- Table 131: Global ANC Headphones Market Revenue Million Forecast, by Country 2019 & 2032
- Table 132: Global ANC Headphones Market Volume K Unit Forecast, by Country 2019 & 2032
Frequently Asked Questions
1. What is the projected Compound Annual Growth Rate (CAGR) of the ANC Headphones Market?
The projected CAGR is approximately 14.00%.
2. Which companies are prominent players in the ANC Headphones Market?
Key companies in the market include Sennheiser electronic GmbH & Co KG, Bose Corporation, Toshiba Corporation, Xiaomi Corporation, Skullcandy Inc, AsusTek Computer Inc, Logitech International S A, Apple Inc, Samsung, Pioneer Corporation, Sony Corporation, Plantronics Inc .
3. What are the main segments of the ANC Headphones Market?
The market segments include Product Type, Price Range, Distribution Channel.
4. Can you provide details about the market size?
The market size is estimated to be USD 17.88 Million as of 2022.
5. What are some drivers contributing to market growth?
Increasing Affinity of the Millennial Population toward Technologically Advanced Appliances.
6. What are the notable trends driving market growth?
Increasing Adoption of Smart Phones is Expected to Drive the Market Growth.
7. Are there any restraints impacting market growth?
Need for High Capital and Technological Expertise.
8. Can you provide examples of recent developments in the market?
October 2022: Sony India announced the release of the WH-1000XM5, the long-awaited successor to Sony's award-winning 1000XM family, which offers Sony's legacy audio quality from the hugely popular WH-1000XM4. This new model provides users with an immersive, distraction-free sound experience, and the implementation of new technologies elevates the WH-1000XM5's already industry-leading noise canceling and audio quality to a new level.
9. What pricing options are available for accessing the report?
Pricing options include single-user, multi-user, and enterprise licenses priced at USD 4750, USD 5250, and USD 8750 respectively.
10. Is the market size provided in terms of value or volume?
The market size is provided in terms of value, measured in Million and volume, measured in K Unit.
11. Are there any specific market keywords associated with the report?
Yes, the market keyword associated with the report is "ANC Headphones Market," which aids in identifying and referencing the specific market segment covered.
12. How do I determine which pricing option suits my needs best?
The pricing options vary based on user requirements and access needs. Individual users may opt for single-user licenses, while businesses requiring broader access may choose multi-user or enterprise licenses for cost-effective access to the report.
13. Are there any additional resources or data provided in the ANC Headphones Market report?
While the report offers comprehensive insights, it's advisable to review the specific contents or supplementary materials provided to ascertain if additional resources or data are available.
14. How can I stay updated on further developments or reports in the ANC Headphones Market?
To stay informed about further developments, trends, and reports in the ANC Headphones Market, consider subscribing to industry newsletters, following relevant companies and organizations, or regularly checking reputable industry news sources and publications.
Methodology
Step 1 - Identification of Relevant Samples Size from Population Database


Step 2 - Approaches for Defining Global Market Size (Value, Volume* & Price*)

Note*: In applicable scenarios
Step 3 - Data Sources
Primary Research
- Web Analytics
- Survey Reports
- Research Institute
- Latest Research Reports
- Opinion Leaders
Secondary Research
- Annual Reports
- White Paper
- Latest Press Release
- Industry Association
- Paid Database
- Investor Presentations

Step 4 - Data Triangulation
Involves using different sources of information in order to increase the validity of a study
These sources are likely to be stakeholders in a program - participants, other researchers, program staff, other community members, and so on.
Then we put all data in single framework & apply various statistical tools to find out the dynamic on the market.
During the analysis stage, feedback from the stakeholder groups would be compared to determine areas of agreement as well as areas of divergence


