

Key Insights
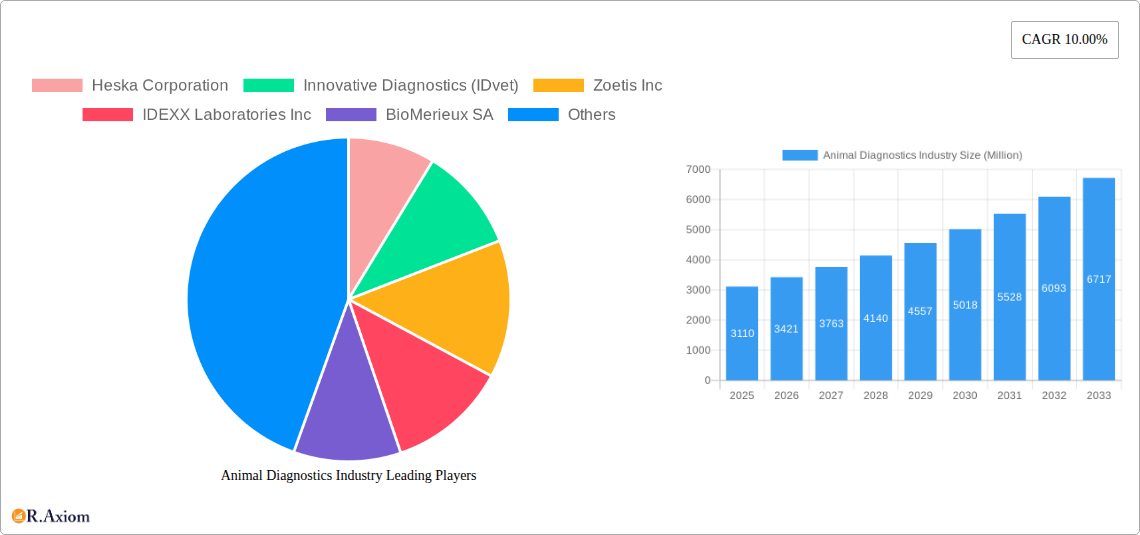
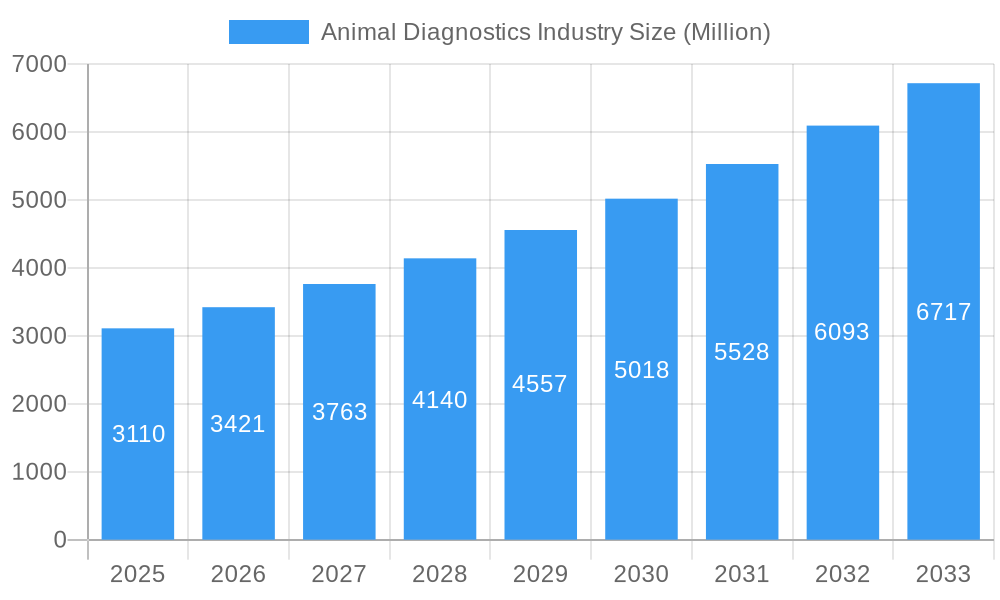
The global animal diagnostics market, valued at $3.11 billion in 2025, is projected to experience robust growth, driven by several key factors. Increasing pet ownership worldwide, coupled with rising pet humanization trends, fuels demand for advanced diagnostic tools to ensure animal health and well-being. This trend is particularly pronounced in developed nations like those in North America and Europe, where pet owners are increasingly willing to invest in sophisticated veterinary care. Technological advancements in areas like immunodiagnostics, molecular diagnostics, and diagnostic imaging are also significantly contributing to market expansion. Improved diagnostic accuracy, faster turnaround times, and minimally invasive procedures are boosting the adoption of these technologies. The market segmentation reveals a strong demand across various animal types, with cats and dogs dominating the market share due to their higher prevalence as companion animals. Within applications, bacteriology, parasitology, and clinical pathology are major segments, showcasing the breadth of diagnostic needs across veterinary practices. The competitive landscape is characterized by both large multinational corporations and specialized animal diagnostics companies, leading to ongoing innovation and product diversification. While certain regulatory hurdles and regional variations in veterinary practices present some challenges, the overall market outlook remains strongly positive, with a projected Compound Annual Growth Rate (CAGR) of 10% throughout the forecast period (2025-2033).
Animal Diagnostics Industry Market Size (In Billion)
The growth trajectory is further influenced by factors such as rising awareness of zoonotic diseases (diseases transmissible from animals to humans), which necessitates enhanced surveillance and diagnostic capabilities. The increasing prevalence of chronic diseases in animals is another major driver, requiring sophisticated and frequent diagnostic testing. Geographic variations in market growth are expected, with developing economies in Asia-Pacific and other emerging regions witnessing accelerated growth due to increasing veterinary infrastructure and rising disposable incomes. However, the high cost of advanced diagnostic equipment and testing procedures, along with the need for skilled professionals to operate and interpret results, may act as constraints in certain regions. The continued focus on research and development, coupled with strategic collaborations between diagnostic companies and veterinary professionals, is expected to overcome these challenges and propel the market to significant heights in the coming years.
Animal Diagnostics Industry Company Market Share
This comprehensive report provides an in-depth analysis of the Animal Diagnostics Industry, covering market size, growth drivers, competitive landscape, and future trends. The study period spans from 2019 to 2033, with 2025 serving as the base and estimated year. The forecast period is 2025-2033, and the historical period encompasses 2019-2024. The report analyzes key players like Heska Corporation, Innovative Diagnostics (IDvet), Zoetis Inc, IDEXX Laboratories Inc, BioMérieux SA, Randox Laboratories Ltd, Chembio Diagnostic Systems Inc, Thermo Fisher Scientific Inc, Indical Bioscience GmbH, Creative Diagnostics, Agrolabo SpA, Virbac, and Neogen Corporation, across various segments including animals (cats, dogs, other animals), applications (bacteriology, parasitology, clinical pathology, other applications), and technologies (immunodiagnostic tests, molecular diagnostics, diagnostic imaging, other diagnostics). The total market size in 2025 is estimated at $xx Million.
Animal Diagnostics Industry Market Concentration & Innovation
The animal diagnostics market exhibits moderate concentration, with a few major players holding significant market share. IDEXX Laboratories Inc and Zoetis Inc are prominent leaders, commanding a combined market share estimated at 40% in 2025. However, the landscape is dynamic, with smaller companies specializing in niche areas and innovative technologies. The industry is driven by continuous innovation in diagnostic technologies, particularly in molecular diagnostics and point-of-care testing, enabling faster and more accurate results. Regulatory frameworks, such as those set by the FDA and equivalent international bodies, significantly influence product development and market access. Product substitution is a factor, particularly with the emergence of cost-effective and user-friendly technologies. End-user trends, such as increasing pet ownership and rising demand for advanced veterinary care, fuel market growth. Mergers and acquisitions (M&A) are frequent, reflecting the drive for consolidation and access to new technologies. Recent M&A deals have involved values ranging from $xx Million to $xx Million, consolidating market share and expanding product portfolios.
- Market Leaders: IDEXX Laboratories Inc, Zoetis Inc
- Market Share (2025): IDEXX & Zoetis combined - 40% (estimated)
- Innovation Drivers: Molecular diagnostics, Point-of-care testing
- M&A Activity: Frequent, with deal values ranging from $xx Million to $xx Million
Animal Diagnostics Industry Industry Trends & Insights
The animal diagnostics market is experiencing robust growth, driven by several factors. The increasing pet humanization trend globally, resulting in higher spending on pet healthcare, significantly impacts market expansion. Technological advancements, particularly in molecular diagnostics and automated systems, improve diagnostic accuracy and efficiency, contributing to market expansion. A rising demand for personalized medicine in veterinary care drives the adoption of advanced diagnostic tools. The market displays a Compound Annual Growth Rate (CAGR) of xx% during the forecast period (2025-2033). The market penetration of advanced diagnostic technologies, such as molecular diagnostics, is expected to increase from xx% in 2025 to xx% by 2033. The competitive landscape is intensely competitive, with established players and new entrants vying for market share. Strategic partnerships, product launches, and technological innovations are key competitive strategies.
Dominant Markets & Segments in Animal Diagnostics Industry
The North American region currently dominates the animal diagnostics market, owing to high pet ownership rates, advanced veterinary infrastructure, and increased pet healthcare spending. Within animal segments, dogs and cats constitute the largest market shares, driven by high pet ownership and greater access to veterinary care. Clinical pathology holds the largest application segment share due to its extensive use in routine health checks and disease diagnosis. Immunodiagnostic tests remain the dominant technology, but molecular diagnostics are rapidly gaining traction due to their high sensitivity and specificity.
- Leading Region: North America
- Dominant Animal Segments: Dogs, Cats
- Largest Application Segment: Clinical Pathology
- Leading Technology: Immunodiagnostic Tests (currently), Molecular Diagnostics (rapidly growing)
Key Drivers:
- High pet ownership rates in developed countries.
- Growing awareness of pet health and wellness.
- Advanced veterinary infrastructure and access to care.
- Favorable economic conditions and increased disposable income.
Animal Diagnostics Industry Product Developments
Recent product developments highlight a shift toward faster, more accurate, and user-friendly diagnostic tools. Companies are focusing on point-of-care testing devices, integrated diagnostic platforms, and software solutions that streamline workflow and improve data analysis. The integration of artificial intelligence (AI) and machine learning (ML) is enhancing diagnostic accuracy and predictive capabilities. This aligns with the market demand for improved efficiency and faster turnaround times in veterinary diagnostics.
Report Scope & Segmentation Analysis
This report comprehensively segments the animal diagnostics market across various parameters:
Animals: Cats, Dogs, and Other Animals (horses, birds, livestock, etc.). Each segment shows varied growth rates based on pet ownership trends and veterinary care accessibility. The dog and cat segments are currently the largest, with significant growth projected for other animals as well.
Applications: Bacteriology, Parasitology, Clinical Pathology, and Other Applications (e.g., endocrinology, hematology). Clinical pathology holds the largest share with consistent growth predicted across all applications.
Technology: Immunodiagnostic Tests, Molecular Diagnostics, Diagnostic Imaging, and Other Diagnostics (e.g., cytology, histology). Molecular diagnostics and immunodiagnostics are growing at a faster pace, driven by advances in technology and increased demand for accuracy. Diagnostic imaging is a smaller segment but shows steady growth.
Key Drivers of Animal Diagnostics Industry Growth
Several factors propel the growth of the animal diagnostics industry: the rising pet ownership rate globally, coupled with increasing disposable income and the humanization of pets leads to greater investment in pet health. Technological advancements, including point-of-care testing and molecular diagnostics, offer faster, more accurate results. Stringent regulatory frameworks ensure product safety and efficacy, furthering market confidence.
Challenges in the Animal Diagnostics Industry Sector
Challenges include high regulatory hurdles for new product approvals, which can lead to delays and increased development costs. Supply chain disruptions and shortages of raw materials can impact product availability. Intense competition from established players and new entrants puts downward pressure on prices. The cost of advanced diagnostic technologies can limit access in certain markets.
Emerging Opportunities in Animal Diagnostics Industry
Emerging opportunities lie in the development of novel diagnostic tools using AI and ML for enhanced accuracy and speed. Expansion into emerging markets with growing pet ownership presents significant potential. The growing demand for at-home diagnostic testing creates opportunities for mobile services and easy-to-use home test kits. Focus on companion animal diagnostics in developing nations is another significant avenue for growth.
Leading Players in the Animal Diagnostics Industry Market
- Heska Corporation
- Innovative Diagnostics (IDvet)
- Zoetis Inc
- IDEXX Laboratories Inc
- BioMérieux SA
- Randox Laboratories Ltd
- Chembio Diagnostic Systems Inc
- Thermo Fisher Scientific Inc
- Indical Bioscience GmbH
- Creative Diagnostics
- Agrolabo SpA
- Virbac
- Neogen Corporation
Key Developments in Animal Diagnostics Industry Industry
- January 2022: IDEXX Laboratories, Inc. announced enhancements to its product and service offerings, including the IDEXX 4Dx Plus Test, VetConnectPLUS Mobile App, SediVue Dx Urine Sediment Analyzer, and the New Catalyst SDMA Test. These improvements boost veterinary practice efficiency and provide deeper clinical insights.
- August 2022: PepiPets launched a mobile diagnostic testing service, bringing diagnostic testing directly to pet owners' homes. This innovative approach increases accessibility and convenience.
Strategic Outlook for Animal Diagnostics Industry Market
The animal diagnostics market is poised for continued growth, driven by technological advancements, increasing pet ownership, and rising demand for advanced veterinary care. Focusing on innovative technologies like molecular diagnostics, point-of-care testing, and AI-powered diagnostic tools will be crucial for maintaining competitiveness. Expansion into emerging markets and developing strategic partnerships will further unlock market potential.
Animal Diagnostics Industry Segmentation
-
1. Animals
- 1.1. Cats
- 1.2. Dogs
- 1.3. Other Animals
-
2. Application
- 2.1. Bacteriology
- 2.2. Parasitology
- 2.3. Clinical Pathology
- 2.4. Other Applications
-
3. Technology
- 3.1. Immunodiagnostic Tests
- 3.2. Molecular Diagnostics
- 3.3. Diagnostic Imaging
- 3.4. Other Diagnostics
Animal Diagnostics Industry Segmentation By Geography
-
1. North America
- 1.1. United States
- 1.2. Canada
- 1.3. Mexico
-
2. Europe
- 2.1. Germany
- 2.2. United Kingdom
- 2.3. France
- 2.4. Italy
- 2.5. Spain
- 2.6. Rest of Europe
-
3. Asia Pacific
- 3.1. China
- 3.2. Japan
- 3.3. India
- 3.4. Australia
- 3.5. South Korea
- 3.6. Rest of Asia Pacific
-
4. Middle East and Africa
- 4.1. GCC
- 4.2. South Africa
- 4.3. Rest of Middle East and Africa
-
5. South America
- 5.1. Brazil
- 5.2. Argentina
- 5.3. Rest of South America
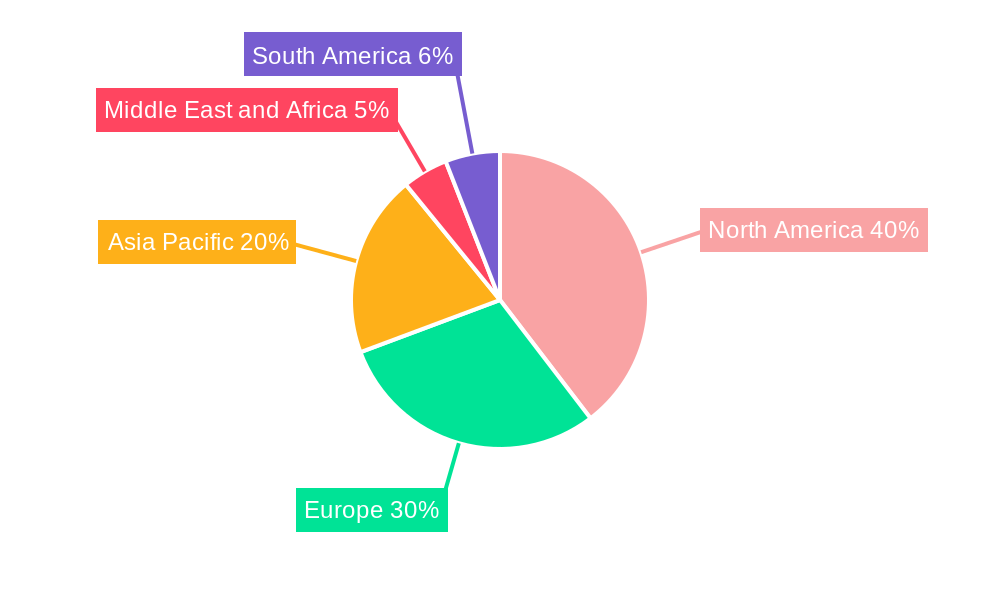
Animal Diagnostics Industry Regional Market Share
Geographic Coverage of Animal Diagnostics Industry
Animal Diagnostics Industry REPORT HIGHLIGHTS
| Aspects | Details |
|---|---|
| Study Period | 2020-2034 |
| Base Year | 2025 |
| Estimated Year | 2026 |
| Forecast Period | 2026-2034 |
| Historical Period | 2020-2025 |
| Growth Rate | CAGR of 10.00% from 2020-2034 |
| Segmentation |
|
Table of Contents
- 1. Introduction
- 1.1. Research Scope
- 1.2. Market Segmentation
- 1.3. Research Objective
- 1.4. Definitions and Assumptions
- 2. Executive Summary
- 2.1. Market Snapshot
- 3. Market Dynamics
- 3.1. Market Drivers
- 3.2. Market Restrains
- 3.3. Market Trends
- 3.4. Market Opportunities
- 4. Market Factor Analysis
- 4.1. Porters Five Forces
- 4.1.1. Bargaining Power of Suppliers
- 4.1.2. Bargaining Power of Buyers
- 4.1.3. Threat of New Entrants
- 4.1.4. Threat of Substitutes
- 4.1.5. Competitive Rivalry
- 4.2. PESTEL analysis
- 4.3. BCG Analysis
- 4.3.1. Stars (High Growth, High Market Share)
- 4.3.2. Cash Cows (Low Growth, High Market Share)
- 4.3.3. Question Mark (High Growth, Low Market Share)
- 4.3.4. Dogs (Low Growth, Low Market Share)
- 4.4. Ansoff Matrix Analysis
- 4.5. Supply Chain Analysis
- 4.6. Regulatory Landscape
- 4.7. Current Market Potential and Opportunity Assessment (TAM–SAM–SOM Framework)
- 4.8. RAX Analyst Note
- 4.1. Porters Five Forces
- 5. Market Analysis, Insights and Forecast 2021-2033
- 5.1. Market Analysis, Insights and Forecast - by Animals
- 5.1.1. Cats
- 5.1.2. Dogs
- 5.1.3. Other Animals
- 5.2. Market Analysis, Insights and Forecast - by Application
- 5.2.1. Bacteriology
- 5.2.2. Parasitology
- 5.2.3. Clinical Pathology
- 5.2.4. Other Applications
- 5.3. Market Analysis, Insights and Forecast - by Technology
- 5.3.1. Immunodiagnostic Tests
- 5.3.2. Molecular Diagnostics
- 5.3.3. Diagnostic Imaging
- 5.3.4. Other Diagnostics
- 5.4. Market Analysis, Insights and Forecast - by Region
- 5.4.1. North America
- 5.4.2. Europe
- 5.4.3. Asia Pacific
- 5.4.4. Middle East and Africa
- 5.4.5. South America
- 5.1. Market Analysis, Insights and Forecast - by Animals
- 6. Global Animal Diagnostics Industry Analysis, Insights and Forecast, 2021-2033
- 6.1. Market Analysis, Insights and Forecast - by Animals
- 6.1.1. Cats
- 6.1.2. Dogs
- 6.1.3. Other Animals
- 6.2. Market Analysis, Insights and Forecast - by Application
- 6.2.1. Bacteriology
- 6.2.2. Parasitology
- 6.2.3. Clinical Pathology
- 6.2.4. Other Applications
- 6.3. Market Analysis, Insights and Forecast - by Technology
- 6.3.1. Immunodiagnostic Tests
- 6.3.2. Molecular Diagnostics
- 6.3.3. Diagnostic Imaging
- 6.3.4. Other Diagnostics
- 6.1. Market Analysis, Insights and Forecast - by Animals
- 7. North America Animal Diagnostics Industry Analysis, Insights and Forecast, 2020-2032
- 7.1. Market Analysis, Insights and Forecast - by Animals
- 7.1.1. Cats
- 7.1.2. Dogs
- 7.1.3. Other Animals
- 7.2. Market Analysis, Insights and Forecast - by Application
- 7.2.1. Bacteriology
- 7.2.2. Parasitology
- 7.2.3. Clinical Pathology
- 7.2.4. Other Applications
- 7.3. Market Analysis, Insights and Forecast - by Technology
- 7.3.1. Immunodiagnostic Tests
- 7.3.2. Molecular Diagnostics
- 7.3.3. Diagnostic Imaging
- 7.3.4. Other Diagnostics
- 7.1. Market Analysis, Insights and Forecast - by Animals
- 8. Europe Animal Diagnostics Industry Analysis, Insights and Forecast, 2020-2032
- 8.1. Market Analysis, Insights and Forecast - by Animals
- 8.1.1. Cats
- 8.1.2. Dogs
- 8.1.3. Other Animals
- 8.2. Market Analysis, Insights and Forecast - by Application
- 8.2.1. Bacteriology
- 8.2.2. Parasitology
- 8.2.3. Clinical Pathology
- 8.2.4. Other Applications
- 8.3. Market Analysis, Insights and Forecast - by Technology
- 8.3.1. Immunodiagnostic Tests
- 8.3.2. Molecular Diagnostics
- 8.3.3. Diagnostic Imaging
- 8.3.4. Other Diagnostics
- 8.1. Market Analysis, Insights and Forecast - by Animals
- 9. Asia Pacific Animal Diagnostics Industry Analysis, Insights and Forecast, 2020-2032
- 9.1. Market Analysis, Insights and Forecast - by Animals
- 9.1.1. Cats
- 9.1.2. Dogs
- 9.1.3. Other Animals
- 9.2. Market Analysis, Insights and Forecast - by Application
- 9.2.1. Bacteriology
- 9.2.2. Parasitology
- 9.2.3. Clinical Pathology
- 9.2.4. Other Applications
- 9.3. Market Analysis, Insights and Forecast - by Technology
- 9.3.1. Immunodiagnostic Tests
- 9.3.2. Molecular Diagnostics
- 9.3.3. Diagnostic Imaging
- 9.3.4. Other Diagnostics
- 9.1. Market Analysis, Insights and Forecast - by Animals
- 10. Middle East and Africa Animal Diagnostics Industry Analysis, Insights and Forecast, 2020-2032
- 10.1. Market Analysis, Insights and Forecast - by Animals
- 10.1.1. Cats
- 10.1.2. Dogs
- 10.1.3. Other Animals
- 10.2. Market Analysis, Insights and Forecast - by Application
- 10.2.1. Bacteriology
- 10.2.2. Parasitology
- 10.2.3. Clinical Pathology
- 10.2.4. Other Applications
- 10.3. Market Analysis, Insights and Forecast - by Technology
- 10.3.1. Immunodiagnostic Tests
- 10.3.2. Molecular Diagnostics
- 10.3.3. Diagnostic Imaging
- 10.3.4. Other Diagnostics
- 10.1. Market Analysis, Insights and Forecast - by Animals
- 11. South America Animal Diagnostics Industry Analysis, Insights and Forecast, 2020-2032
- 11.1. Market Analysis, Insights and Forecast - by Animals
- 11.1.1. Cats
- 11.1.2. Dogs
- 11.1.3. Other Animals
- 11.2. Market Analysis, Insights and Forecast - by Application
- 11.2.1. Bacteriology
- 11.2.2. Parasitology
- 11.2.3. Clinical Pathology
- 11.2.4. Other Applications
- 11.3. Market Analysis, Insights and Forecast - by Technology
- 11.3.1. Immunodiagnostic Tests
- 11.3.2. Molecular Diagnostics
- 11.3.3. Diagnostic Imaging
- 11.3.4. Other Diagnostics
- 11.1. Market Analysis, Insights and Forecast - by Animals
- 12. Competitive Analysis
- 12.1. Company Profiles
- 12.1.1 Heska Corporation
- 12.1.1.1. Company Overview
- 12.1.1.2. Products
- 12.1.1.3. Company Financials
- 12.1.1.4. SWOT Analysis
- 12.1.2 Innovative Diagnostics (IDvet)
- 12.1.2.1. Company Overview
- 12.1.2.2. Products
- 12.1.2.3. Company Financials
- 12.1.2.4. SWOT Analysis
- 12.1.3 Zoetis Inc
- 12.1.3.1. Company Overview
- 12.1.3.2. Products
- 12.1.3.3. Company Financials
- 12.1.3.4. SWOT Analysis
- 12.1.4 IDEXX Laboratories Inc
- 12.1.4.1. Company Overview
- 12.1.4.2. Products
- 12.1.4.3. Company Financials
- 12.1.4.4. SWOT Analysis
- 12.1.5 BioMerieux SA
- 12.1.5.1. Company Overview
- 12.1.5.2. Products
- 12.1.5.3. Company Financials
- 12.1.5.4. SWOT Analysis
- 12.1.6 Randox Laboratories Ltd
- 12.1.6.1. Company Overview
- 12.1.6.2. Products
- 12.1.6.3. Company Financials
- 12.1.6.4. SWOT Analysis
- 12.1.7 Chembio Diagnostic Systems Inc
- 12.1.7.1. Company Overview
- 12.1.7.2. Products
- 12.1.7.3. Company Financials
- 12.1.7.4. SWOT Analysis
- 12.1.8 Thermo Fisher Scientific Inc
- 12.1.8.1. Company Overview
- 12.1.8.2. Products
- 12.1.8.3. Company Financials
- 12.1.8.4. SWOT Analysis
- 12.1.9 Indical Bioscience GmbH
- 12.1.9.1. Company Overview
- 12.1.9.2. Products
- 12.1.9.3. Company Financials
- 12.1.9.4. SWOT Analysis
- 12.1.10 Creative Diagnostics
- 12.1.10.1. Company Overview
- 12.1.10.2. Products
- 12.1.10.3. Company Financials
- 12.1.10.4. SWOT Analysis
- 12.1.11 Agrolabo SpA
- 12.1.11.1. Company Overview
- 12.1.11.2. Products
- 12.1.11.3. Company Financials
- 12.1.11.4. SWOT Analysis
- 12.1.12 Virbac
- 12.1.12.1. Company Overview
- 12.1.12.2. Products
- 12.1.12.3. Company Financials
- 12.1.12.4. SWOT Analysis
- 12.1.13 Neogen Corporation
- 12.1.13.1. Company Overview
- 12.1.13.2. Products
- 12.1.13.3. Company Financials
- 12.1.13.4. SWOT Analysis
- 12.1.1 Heska Corporation
- 12.2. Market Entropy
- 12.2.1 Company's Key Areas Served
- 12.2.2 Recent Developments
- 12.3. Company Market Share Analysis 2025
- 12.3.1 Top 5 Companies Market Share Analysis
- 12.3.2 Top 3 Companies Market Share Analysis
- 12.4. List of Potential Customers
- 13. Research Methodology
List of Figures
- Figure 1: Global Animal Diagnostics Industry Revenue Breakdown (Million, %) by Region 2025 & 2033
- Figure 2: Global Animal Diagnostics Industry Volume Breakdown (K Unit, %) by Region 2025 & 2033
- Figure 3: North America Animal Diagnostics Industry Revenue (Million), by Animals 2025 & 2033
- Figure 4: North America Animal Diagnostics Industry Volume (K Unit), by Animals 2025 & 2033
- Figure 5: North America Animal Diagnostics Industry Revenue Share (%), by Animals 2025 & 2033
- Figure 6: North America Animal Diagnostics Industry Volume Share (%), by Animals 2025 & 2033
- Figure 7: North America Animal Diagnostics Industry Revenue (Million), by Application 2025 & 2033
- Figure 8: North America Animal Diagnostics Industry Volume (K Unit), by Application 2025 & 2033
- Figure 9: North America Animal Diagnostics Industry Revenue Share (%), by Application 2025 & 2033
- Figure 10: North America Animal Diagnostics Industry Volume Share (%), by Application 2025 & 2033
- Figure 11: North America Animal Diagnostics Industry Revenue (Million), by Technology 2025 & 2033
- Figure 12: North America Animal Diagnostics Industry Volume (K Unit), by Technology 2025 & 2033
- Figure 13: North America Animal Diagnostics Industry Revenue Share (%), by Technology 2025 & 2033
- Figure 14: North America Animal Diagnostics Industry Volume Share (%), by Technology 2025 & 2033
- Figure 15: North America Animal Diagnostics Industry Revenue (Million), by Country 2025 & 2033
- Figure 16: North America Animal Diagnostics Industry Volume (K Unit), by Country 2025 & 2033
- Figure 17: North America Animal Diagnostics Industry Revenue Share (%), by Country 2025 & 2033
- Figure 18: North America Animal Diagnostics Industry Volume Share (%), by Country 2025 & 2033
- Figure 19: Europe Animal Diagnostics Industry Revenue (Million), by Animals 2025 & 2033
- Figure 20: Europe Animal Diagnostics Industry Volume (K Unit), by Animals 2025 & 2033
- Figure 21: Europe Animal Diagnostics Industry Revenue Share (%), by Animals 2025 & 2033
- Figure 22: Europe Animal Diagnostics Industry Volume Share (%), by Animals 2025 & 2033
- Figure 23: Europe Animal Diagnostics Industry Revenue (Million), by Application 2025 & 2033
- Figure 24: Europe Animal Diagnostics Industry Volume (K Unit), by Application 2025 & 2033
- Figure 25: Europe Animal Diagnostics Industry Revenue Share (%), by Application 2025 & 2033
- Figure 26: Europe Animal Diagnostics Industry Volume Share (%), by Application 2025 & 2033
- Figure 27: Europe Animal Diagnostics Industry Revenue (Million), by Technology 2025 & 2033
- Figure 28: Europe Animal Diagnostics Industry Volume (K Unit), by Technology 2025 & 2033
- Figure 29: Europe Animal Diagnostics Industry Revenue Share (%), by Technology 2025 & 2033
- Figure 30: Europe Animal Diagnostics Industry Volume Share (%), by Technology 2025 & 2033
- Figure 31: Europe Animal Diagnostics Industry Revenue (Million), by Country 2025 & 2033
- Figure 32: Europe Animal Diagnostics Industry Volume (K Unit), by Country 2025 & 2033
- Figure 33: Europe Animal Diagnostics Industry Revenue Share (%), by Country 2025 & 2033
- Figure 34: Europe Animal Diagnostics Industry Volume Share (%), by Country 2025 & 2033
- Figure 35: Asia Pacific Animal Diagnostics Industry Revenue (Million), by Animals 2025 & 2033
- Figure 36: Asia Pacific Animal Diagnostics Industry Volume (K Unit), by Animals 2025 & 2033
- Figure 37: Asia Pacific Animal Diagnostics Industry Revenue Share (%), by Animals 2025 & 2033
- Figure 38: Asia Pacific Animal Diagnostics Industry Volume Share (%), by Animals 2025 & 2033
- Figure 39: Asia Pacific Animal Diagnostics Industry Revenue (Million), by Application 2025 & 2033
- Figure 40: Asia Pacific Animal Diagnostics Industry Volume (K Unit), by Application 2025 & 2033
- Figure 41: Asia Pacific Animal Diagnostics Industry Revenue Share (%), by Application 2025 & 2033
- Figure 42: Asia Pacific Animal Diagnostics Industry Volume Share (%), by Application 2025 & 2033
- Figure 43: Asia Pacific Animal Diagnostics Industry Revenue (Million), by Technology 2025 & 2033
- Figure 44: Asia Pacific Animal Diagnostics Industry Volume (K Unit), by Technology 2025 & 2033
- Figure 45: Asia Pacific Animal Diagnostics Industry Revenue Share (%), by Technology 2025 & 2033
- Figure 46: Asia Pacific Animal Diagnostics Industry Volume Share (%), by Technology 2025 & 2033
- Figure 47: Asia Pacific Animal Diagnostics Industry Revenue (Million), by Country 2025 & 2033
- Figure 48: Asia Pacific Animal Diagnostics Industry Volume (K Unit), by Country 2025 & 2033
- Figure 49: Asia Pacific Animal Diagnostics Industry Revenue Share (%), by Country 2025 & 2033
- Figure 50: Asia Pacific Animal Diagnostics Industry Volume Share (%), by Country 2025 & 2033
- Figure 51: Middle East and Africa Animal Diagnostics Industry Revenue (Million), by Animals 2025 & 2033
- Figure 52: Middle East and Africa Animal Diagnostics Industry Volume (K Unit), by Animals 2025 & 2033
- Figure 53: Middle East and Africa Animal Diagnostics Industry Revenue Share (%), by Animals 2025 & 2033
- Figure 54: Middle East and Africa Animal Diagnostics Industry Volume Share (%), by Animals 2025 & 2033
- Figure 55: Middle East and Africa Animal Diagnostics Industry Revenue (Million), by Application 2025 & 2033
- Figure 56: Middle East and Africa Animal Diagnostics Industry Volume (K Unit), by Application 2025 & 2033
- Figure 57: Middle East and Africa Animal Diagnostics Industry Revenue Share (%), by Application 2025 & 2033
- Figure 58: Middle East and Africa Animal Diagnostics Industry Volume Share (%), by Application 2025 & 2033
- Figure 59: Middle East and Africa Animal Diagnostics Industry Revenue (Million), by Technology 2025 & 2033
- Figure 60: Middle East and Africa Animal Diagnostics Industry Volume (K Unit), by Technology 2025 & 2033
- Figure 61: Middle East and Africa Animal Diagnostics Industry Revenue Share (%), by Technology 2025 & 2033
- Figure 62: Middle East and Africa Animal Diagnostics Industry Volume Share (%), by Technology 2025 & 2033
- Figure 63: Middle East and Africa Animal Diagnostics Industry Revenue (Million), by Country 2025 & 2033
- Figure 64: Middle East and Africa Animal Diagnostics Industry Volume (K Unit), by Country 2025 & 2033
- Figure 65: Middle East and Africa Animal Diagnostics Industry Revenue Share (%), by Country 2025 & 2033
- Figure 66: Middle East and Africa Animal Diagnostics Industry Volume Share (%), by Country 2025 & 2033
- Figure 67: South America Animal Diagnostics Industry Revenue (Million), by Animals 2025 & 2033
- Figure 68: South America Animal Diagnostics Industry Volume (K Unit), by Animals 2025 & 2033
- Figure 69: South America Animal Diagnostics Industry Revenue Share (%), by Animals 2025 & 2033
- Figure 70: South America Animal Diagnostics Industry Volume Share (%), by Animals 2025 & 2033
- Figure 71: South America Animal Diagnostics Industry Revenue (Million), by Application 2025 & 2033
- Figure 72: South America Animal Diagnostics Industry Volume (K Unit), by Application 2025 & 2033
- Figure 73: South America Animal Diagnostics Industry Revenue Share (%), by Application 2025 & 2033
- Figure 74: South America Animal Diagnostics Industry Volume Share (%), by Application 2025 & 2033
- Figure 75: South America Animal Diagnostics Industry Revenue (Million), by Technology 2025 & 2033
- Figure 76: South America Animal Diagnostics Industry Volume (K Unit), by Technology 2025 & 2033
- Figure 77: South America Animal Diagnostics Industry Revenue Share (%), by Technology 2025 & 2033
- Figure 78: South America Animal Diagnostics Industry Volume Share (%), by Technology 2025 & 2033
- Figure 79: South America Animal Diagnostics Industry Revenue (Million), by Country 2025 & 2033
- Figure 80: South America Animal Diagnostics Industry Volume (K Unit), by Country 2025 & 2033
- Figure 81: South America Animal Diagnostics Industry Revenue Share (%), by Country 2025 & 2033
- Figure 82: South America Animal Diagnostics Industry Volume Share (%), by Country 2025 & 2033
List of Tables
- Table 1: Global Animal Diagnostics Industry Revenue Million Forecast, by Animals 2020 & 2033
- Table 2: Global Animal Diagnostics Industry Volume K Unit Forecast, by Animals 2020 & 2033
- Table 3: Global Animal Diagnostics Industry Revenue Million Forecast, by Application 2020 & 2033
- Table 4: Global Animal Diagnostics Industry Volume K Unit Forecast, by Application 2020 & 2033
- Table 5: Global Animal Diagnostics Industry Revenue Million Forecast, by Technology 2020 & 2033
- Table 6: Global Animal Diagnostics Industry Volume K Unit Forecast, by Technology 2020 & 2033
- Table 7: Global Animal Diagnostics Industry Revenue Million Forecast, by Region 2020 & 2033
- Table 8: Global Animal Diagnostics Industry Volume K Unit Forecast, by Region 2020 & 2033
- Table 9: Global Animal Diagnostics Industry Revenue Million Forecast, by Animals 2020 & 2033
- Table 10: Global Animal Diagnostics Industry Volume K Unit Forecast, by Animals 2020 & 2033
- Table 11: Global Animal Diagnostics Industry Revenue Million Forecast, by Application 2020 & 2033
- Table 12: Global Animal Diagnostics Industry Volume K Unit Forecast, by Application 2020 & 2033
- Table 13: Global Animal Diagnostics Industry Revenue Million Forecast, by Technology 2020 & 2033
- Table 14: Global Animal Diagnostics Industry Volume K Unit Forecast, by Technology 2020 & 2033
- Table 15: Global Animal Diagnostics Industry Revenue Million Forecast, by Country 2020 & 2033
- Table 16: Global Animal Diagnostics Industry Volume K Unit Forecast, by Country 2020 & 2033
- Table 17: United States Animal Diagnostics Industry Revenue (Million) Forecast, by Application 2020 & 2033
- Table 18: United States Animal Diagnostics Industry Volume (K Unit) Forecast, by Application 2020 & 2033
- Table 19: Canada Animal Diagnostics Industry Revenue (Million) Forecast, by Application 2020 & 2033
- Table 20: Canada Animal Diagnostics Industry Volume (K Unit) Forecast, by Application 2020 & 2033
- Table 21: Mexico Animal Diagnostics Industry Revenue (Million) Forecast, by Application 2020 & 2033
- Table 22: Mexico Animal Diagnostics Industry Volume (K Unit) Forecast, by Application 2020 & 2033
- Table 23: Global Animal Diagnostics Industry Revenue Million Forecast, by Animals 2020 & 2033
- Table 24: Global Animal Diagnostics Industry Volume K Unit Forecast, by Animals 2020 & 2033
- Table 25: Global Animal Diagnostics Industry Revenue Million Forecast, by Application 2020 & 2033
- Table 26: Global Animal Diagnostics Industry Volume K Unit Forecast, by Application 2020 & 2033
- Table 27: Global Animal Diagnostics Industry Revenue Million Forecast, by Technology 2020 & 2033
- Table 28: Global Animal Diagnostics Industry Volume K Unit Forecast, by Technology 2020 & 2033
- Table 29: Global Animal Diagnostics Industry Revenue Million Forecast, by Country 2020 & 2033
- Table 30: Global Animal Diagnostics Industry Volume K Unit Forecast, by Country 2020 & 2033
- Table 31: Germany Animal Diagnostics Industry Revenue (Million) Forecast, by Application 2020 & 2033
- Table 32: Germany Animal Diagnostics Industry Volume (K Unit) Forecast, by Application 2020 & 2033
- Table 33: United Kingdom Animal Diagnostics Industry Revenue (Million) Forecast, by Application 2020 & 2033
- Table 34: United Kingdom Animal Diagnostics Industry Volume (K Unit) Forecast, by Application 2020 & 2033
- Table 35: France Animal Diagnostics Industry Revenue (Million) Forecast, by Application 2020 & 2033
- Table 36: France Animal Diagnostics Industry Volume (K Unit) Forecast, by Application 2020 & 2033
- Table 37: Italy Animal Diagnostics Industry Revenue (Million) Forecast, by Application 2020 & 2033
- Table 38: Italy Animal Diagnostics Industry Volume (K Unit) Forecast, by Application 2020 & 2033
- Table 39: Spain Animal Diagnostics Industry Revenue (Million) Forecast, by Application 2020 & 2033
- Table 40: Spain Animal Diagnostics Industry Volume (K Unit) Forecast, by Application 2020 & 2033
- Table 41: Rest of Europe Animal Diagnostics Industry Revenue (Million) Forecast, by Application 2020 & 2033
- Table 42: Rest of Europe Animal Diagnostics Industry Volume (K Unit) Forecast, by Application 2020 & 2033
- Table 43: Global Animal Diagnostics Industry Revenue Million Forecast, by Animals 2020 & 2033
- Table 44: Global Animal Diagnostics Industry Volume K Unit Forecast, by Animals 2020 & 2033
- Table 45: Global Animal Diagnostics Industry Revenue Million Forecast, by Application 2020 & 2033
- Table 46: Global Animal Diagnostics Industry Volume K Unit Forecast, by Application 2020 & 2033
- Table 47: Global Animal Diagnostics Industry Revenue Million Forecast, by Technology 2020 & 2033
- Table 48: Global Animal Diagnostics Industry Volume K Unit Forecast, by Technology 2020 & 2033
- Table 49: Global Animal Diagnostics Industry Revenue Million Forecast, by Country 2020 & 2033
- Table 50: Global Animal Diagnostics Industry Volume K Unit Forecast, by Country 2020 & 2033
- Table 51: China Animal Diagnostics Industry Revenue (Million) Forecast, by Application 2020 & 2033
- Table 52: China Animal Diagnostics Industry Volume (K Unit) Forecast, by Application 2020 & 2033
- Table 53: Japan Animal Diagnostics Industry Revenue (Million) Forecast, by Application 2020 & 2033
- Table 54: Japan Animal Diagnostics Industry Volume (K Unit) Forecast, by Application 2020 & 2033
- Table 55: India Animal Diagnostics Industry Revenue (Million) Forecast, by Application 2020 & 2033
- Table 56: India Animal Diagnostics Industry Volume (K Unit) Forecast, by Application 2020 & 2033
- Table 57: Australia Animal Diagnostics Industry Revenue (Million) Forecast, by Application 2020 & 2033
- Table 58: Australia Animal Diagnostics Industry Volume (K Unit) Forecast, by Application 2020 & 2033
- Table 59: South Korea Animal Diagnostics Industry Revenue (Million) Forecast, by Application 2020 & 2033
- Table 60: South Korea Animal Diagnostics Industry Volume (K Unit) Forecast, by Application 2020 & 2033
- Table 61: Rest of Asia Pacific Animal Diagnostics Industry Revenue (Million) Forecast, by Application 2020 & 2033
- Table 62: Rest of Asia Pacific Animal Diagnostics Industry Volume (K Unit) Forecast, by Application 2020 & 2033
- Table 63: Global Animal Diagnostics Industry Revenue Million Forecast, by Animals 2020 & 2033
- Table 64: Global Animal Diagnostics Industry Volume K Unit Forecast, by Animals 2020 & 2033
- Table 65: Global Animal Diagnostics Industry Revenue Million Forecast, by Application 2020 & 2033
- Table 66: Global Animal Diagnostics Industry Volume K Unit Forecast, by Application 2020 & 2033
- Table 67: Global Animal Diagnostics Industry Revenue Million Forecast, by Technology 2020 & 2033
- Table 68: Global Animal Diagnostics Industry Volume K Unit Forecast, by Technology 2020 & 2033
- Table 69: Global Animal Diagnostics Industry Revenue Million Forecast, by Country 2020 & 2033
- Table 70: Global Animal Diagnostics Industry Volume K Unit Forecast, by Country 2020 & 2033
- Table 71: GCC Animal Diagnostics Industry Revenue (Million) Forecast, by Application 2020 & 2033
- Table 72: GCC Animal Diagnostics Industry Volume (K Unit) Forecast, by Application 2020 & 2033
- Table 73: South Africa Animal Diagnostics Industry Revenue (Million) Forecast, by Application 2020 & 2033
- Table 74: South Africa Animal Diagnostics Industry Volume (K Unit) Forecast, by Application 2020 & 2033
- Table 75: Rest of Middle East and Africa Animal Diagnostics Industry Revenue (Million) Forecast, by Application 2020 & 2033
- Table 76: Rest of Middle East and Africa Animal Diagnostics Industry Volume (K Unit) Forecast, by Application 2020 & 2033
- Table 77: Global Animal Diagnostics Industry Revenue Million Forecast, by Animals 2020 & 2033
- Table 78: Global Animal Diagnostics Industry Volume K Unit Forecast, by Animals 2020 & 2033
- Table 79: Global Animal Diagnostics Industry Revenue Million Forecast, by Application 2020 & 2033
- Table 80: Global Animal Diagnostics Industry Volume K Unit Forecast, by Application 2020 & 2033
- Table 81: Global Animal Diagnostics Industry Revenue Million Forecast, by Technology 2020 & 2033
- Table 82: Global Animal Diagnostics Industry Volume K Unit Forecast, by Technology 2020 & 2033
- Table 83: Global Animal Diagnostics Industry Revenue Million Forecast, by Country 2020 & 2033
- Table 84: Global Animal Diagnostics Industry Volume K Unit Forecast, by Country 2020 & 2033
- Table 85: Brazil Animal Diagnostics Industry Revenue (Million) Forecast, by Application 2020 & 2033
- Table 86: Brazil Animal Diagnostics Industry Volume (K Unit) Forecast, by Application 2020 & 2033
- Table 87: Argentina Animal Diagnostics Industry Revenue (Million) Forecast, by Application 2020 & 2033
- Table 88: Argentina Animal Diagnostics Industry Volume (K Unit) Forecast, by Application 2020 & 2033
- Table 89: Rest of South America Animal Diagnostics Industry Revenue (Million) Forecast, by Application 2020 & 2033
- Table 90: Rest of South America Animal Diagnostics Industry Volume (K Unit) Forecast, by Application 2020 & 2033
Frequently Asked Questions
1. What is the projected Compound Annual Growth Rate (CAGR) of the Animal Diagnostics Industry?
The projected CAGR is approximately 10.00%.
2. Which companies are prominent players in the Animal Diagnostics Industry?
Key companies in the market include Heska Corporation, Innovative Diagnostics (IDvet), Zoetis Inc , IDEXX Laboratories Inc, BioMerieux SA, Randox Laboratories Ltd, Chembio Diagnostic Systems Inc, Thermo Fisher Scientific Inc, Indical Bioscience GmbH, Creative Diagnostics, Agrolabo SpA, Virbac, Neogen Corporation.
3. What are the main segments of the Animal Diagnostics Industry?
The market segments include Animals, Application, Technology.
4. Can you provide details about the market size?
The market size is estimated to be USD 3.11 Million as of 2022.
5. What are some drivers contributing to market growth?
Rising Demand for Pet Insurance; Growth in the Companion Animal Population; Increasing Number of Veterinary Practitioners in Developed Economies.
6. What are the notable trends driving market growth?
Molecular Diagnostics is Expected to Witness Growth Over the Forecast Period.
7. Are there any restraints impacting market growth?
Rising Burden of the Pet Care Cost.
8. Can you provide examples of recent developments in the market?
August 2022: PepiPets launched a new mobile diagnostic testing service allowing clients to receive diagnostic testing at home for their pets.
9. What pricing options are available for accessing the report?
Pricing options include single-user, multi-user, and enterprise licenses priced at USD 4750, USD 5250, and USD 8750 respectively.
10. Is the market size provided in terms of value or volume?
The market size is provided in terms of value, measured in Million and volume, measured in K Unit.
11. Are there any specific market keywords associated with the report?
Yes, the market keyword associated with the report is "Animal Diagnostics Industry," which aids in identifying and referencing the specific market segment covered.
12. How do I determine which pricing option suits my needs best?
The pricing options vary based on user requirements and access needs. Individual users may opt for single-user licenses, while businesses requiring broader access may choose multi-user or enterprise licenses for cost-effective access to the report.
13. Are there any additional resources or data provided in the Animal Diagnostics Industry report?
While the report offers comprehensive insights, it's advisable to review the specific contents or supplementary materials provided to ascertain if additional resources or data are available.
14. How can I stay updated on further developments or reports in the Animal Diagnostics Industry?
To stay informed about further developments, trends, and reports in the Animal Diagnostics Industry, consider subscribing to industry newsletters, following relevant companies and organizations, or regularly checking reputable industry news sources and publications.
Methodology
Step 1 - Identification of Relevant Samples Size from Population Database


Step 2 - Approaches for Defining Global Market Size (Value, Volume* & Price*)

Note*: In applicable scenarios
Step 3 - Data Sources
Primary Research
- Web Analytics
- Survey Reports
- Research Institute
- Latest Research Reports
- Opinion Leaders
Secondary Research
- Annual Reports
- White Paper
- Latest Press Release
- Industry Association
- Paid Database
- Investor Presentations

Step 4 - Data Triangulation
Involves using different sources of information in order to increase the validity of a study
These sources are likely to be stakeholders in a program - participants, other researchers, program staff, other community members, and so on.
Then we put all data in single framework & apply various statistical tools to find out the dynamic on the market.
During the analysis stage, feedback from the stakeholder groups would be compared to determine areas of agreement as well as areas of divergence