

Key Insights
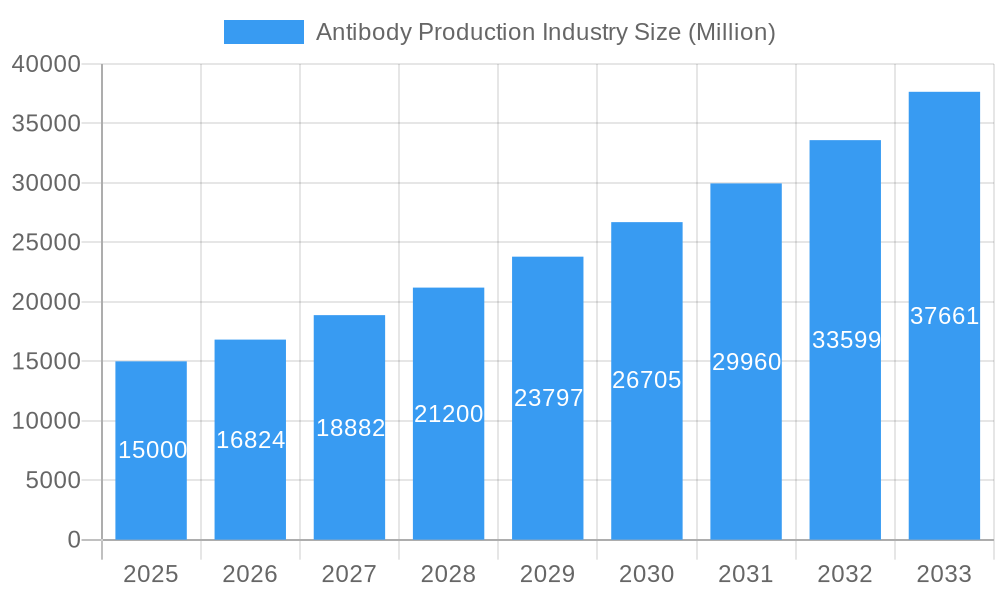
The global antibody production market, valued at $22.62 billion in 2025, is set for substantial expansion. Projections indicate a Compound Annual Growth Rate (CAGR) of 12.7% from 2025 to 2033. This growth is propelled by the rising incidence of chronic diseases requiring antibody-based treatments and significant investments in pharmaceutical and biotechnology research and development. Innovations in monoclonal antibody technology, which enable the creation of highly specific and effective therapies, are key drivers. The market is segmented by crucial elements including chromatography resins (with filtration being a vital process), end-users (dominated by pharmaceutical and biotechnology companies), antibody types (monoclonal antibodies holding a substantial share), and processing stages (upstream and downstream). North America and Europe currently lead regional markets, supported by established research infrastructures and robust regulatory environments. The Asia-Pacific region is anticipated to experience considerable growth, fueled by increasing healthcare expenditures and a burgeoning biopharmaceutical industry. Key challenges include the high costs associated with antibody development and production, stringent regulatory approval processes, and the potential for immunogenicity.
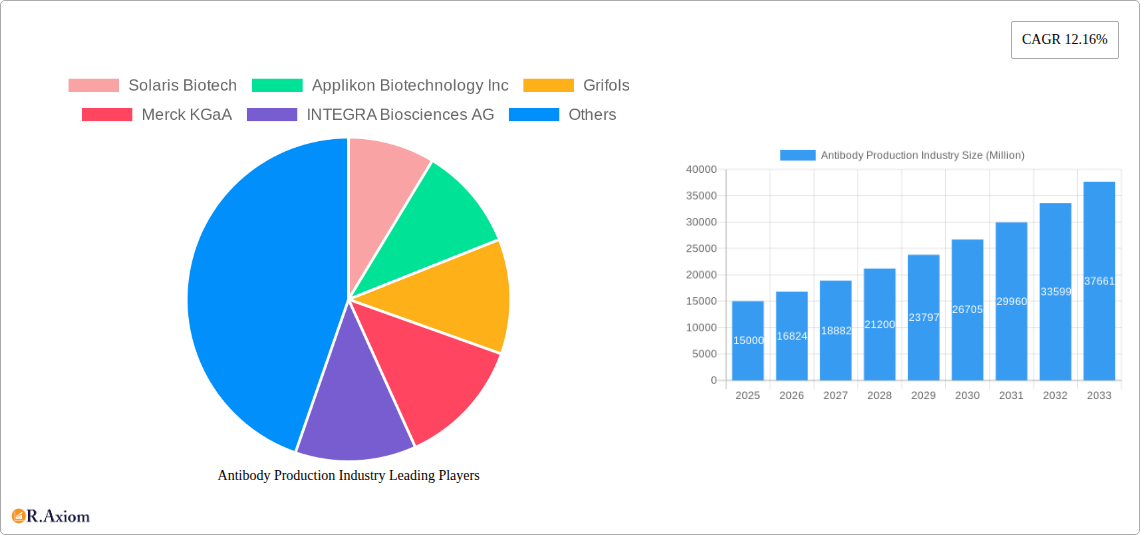
Antibody Production Industry Market Size (In Billion)
The competitive landscape features a blend of major multinational corporations and specialized biotechnology firms. Leading entities like Thermo Fisher Scientific, Merck KGaA, and Danaher Corporation maintain market prominence through their extensive research capabilities and established distribution networks. Smaller, agile companies are actively pursuing market share by focusing on innovative technologies and niche applications. The escalating demand for personalized and targeted therapies is fostering further innovation in antibody production methodologies, encompassing advancements in cell line engineering, process optimization, and purification techniques. This trend is expected to sustain market growth, particularly within segments like antibody-drug conjugates (ADCs) and bispecific antibodies. The forecast period of 2025-2033 is poised for continuous expansion, driven by technological advancements and the increasing need for effective disease treatments.
Antibody Production Industry Company Market Share
This comprehensive report offers in-depth analysis of the Antibody Production Industry, providing critical insights for stakeholders across the value chain. The study encompasses a period from 2019 to 2033, with 2025 designated as the base year. The market is projected to reach $22.62 billion in 2025, with a projected CAGR of 12.7% during the forecast period. This detailed analysis incorporates granular segmentation, a thorough competitive landscape review, and forward-looking growth projections, serving as an essential resource for strategic decision-making.
Antibody Production Industry Market Concentration & Innovation
The antibody production industry exhibits a moderately concentrated market structure, with a few large players like Merck KGaA, Thermo Fisher Scientific Inc, and Sartorius AG holding significant market share. However, the presence of several smaller, specialized companies fosters innovation and competition. Market share data for 2024 indicates that the top 5 players collectively hold approximately xx% of the market. The industry is characterized by significant M&A activity, with deal values exceeding xx Million in the past five years. These activities have largely focused on expanding product portfolios, acquiring specialized technologies, and securing access to new markets. Regulatory frameworks, particularly those governing GMP (Good Manufacturing Practices) and IND (Investigational New Drug) applications, play a crucial role in shaping industry dynamics. The market faces pressure from substitute therapies and advancements in other treatment modalities. However, the continued need for effective antibody-based treatments in various therapeutic areas ensures sustained market growth. End-user trends indicate a growing preference for customized antibody solutions and innovative delivery methods.
- Market Concentration: Top 5 players hold approximately xx% market share (2024).
- M&A Activity: Deal values exceeding xx Million in the last 5 years.
- Innovation Drivers: Demand for targeted therapies, technological advancements in upstream and downstream processing.
- Regulatory Landscape: Stringent GMP and IND requirements.
- End-User Trends: Growing preference for customized solutions and novel delivery systems.
Antibody Production Industry Industry Trends & Insights
The antibody production industry is experiencing robust growth, driven by several key factors. The increasing prevalence of chronic diseases like cancer and autoimmune disorders fuels demand for antibody-based therapies. Technological advancements in antibody engineering, such as the development of bispecific antibodies and antibody-drug conjugates (ADCs), are expanding therapeutic applications and market potential. The rising adoption of sophisticated manufacturing technologies like continuous processing enhances production efficiency and reduces costs. However, the industry faces challenges such as high R&D costs, stringent regulatory requirements, and intense competition. Consumer preferences are shifting towards more personalized and efficacious treatments, driving the demand for innovative antibody products. Competitive dynamics are shaped by factors like technological leadership, intellectual property protection, and market access strategies. The market is also witnessing a surge in the adoption of advanced analytical techniques, ensuring the quality and safety of antibody products. This creates a dynamic market landscape with opportunities for both established players and emerging companies.
Dominant Markets & Segments in Antibody Production Industry
The North American region currently holds the dominant position in the antibody production market, driven by strong R&D investments, advanced infrastructure, and a large pool of skilled professionals. This dominance is further reinforced by the high prevalence of chronic diseases and a supportive regulatory environment within this region. Significant growth is also observed in the Asia Pacific region due to growing healthcare spending, a rising patient population, and increasing outsourcing of manufacturing activities.
- Leading Region: North America
- Dominant Segments:
- Antibody Type: Monoclonal Antibodies (highest market share)
- End User: Pharmaceutical and Biotechnology Companies (largest volume)
- Process: Upstream Processing (significant investment)
- Chromatography Resins: Filtration (wide application)
Key Drivers for Dominance:
- North America: Strong R&D investment, advanced infrastructure, favorable regulatory environment.
- Asia Pacific: Rising healthcare spending, large patient pool, manufacturing outsourcing.
Antibody Production Industry Product Developments
Recent years have witnessed significant advancements in antibody production technologies. Innovations such as next-generation sequencing (NGS) for antibody discovery, advanced cell culture technologies for increased yields, and novel purification techniques for enhanced purity are transforming the industry. These advancements enable the development of more targeted and effective antibody therapies, catering to the growing demand for personalized medicine. The continuous improvement of manufacturing processes leads to higher production efficiency and lower costs, making antibody-based therapies more accessible.
Report Scope & Segmentation Analysis
This report segments the antibody production market by antibody type (Monoclonal Antibodies, Polyclonal Antibodies, Other Antibody Types), end-user (Pharmaceutical and Biotechnology Companies, Research Laboratories, Other End Users), process (Upstream Processing, Downstream Processing), and consumables (Chromatography Resins: Filtration). Each segment’s growth projections, market size estimations, and competitive dynamics are thoroughly analyzed. The report also details the market share and growth prospects of different chromatography resins and filtration techniques. The end-user segment analysis includes a detailed assessment of the market share and growth potential of pharmaceutical and biotechnology companies, research laboratories, and other end-users.
Key Drivers of Antibody Production Industry Growth
Several factors fuel the growth of the antibody production industry. Technological advancements, such as improved cell culture techniques and automation, increase production efficiency and reduce costs. The increasing prevalence of chronic diseases globally drives the demand for antibody-based therapies. Favorable regulatory policies and increased funding for R&D further accelerate market expansion. The rising adoption of personalized medicine also contributes significantly to industry growth.
Challenges in the Antibody Production Industry Sector
The antibody production industry faces challenges, including high R&D costs and lengthy development timelines. Stringent regulatory approvals and the complexity of manufacturing processes present hurdles. Competition from other therapeutic modalities and fluctuations in raw material prices also impact profitability. Supply chain disruptions and increasing labor costs add to operational complexities.
Emerging Opportunities in Antibody Production Industry
The antibody production industry presents several emerging opportunities. The development of novel antibody formats, like bispecific and multispecific antibodies, offers expanded therapeutic potential. The growing adoption of continuous manufacturing processes increases efficiency and scalability. Expanding into emerging markets and exploring new therapeutic areas create further growth opportunities.
Leading Players in the Antibody Production Industry Market
- Solaris Biotech
- Applikon Biotechnology Inc
- Grifols
- Merck KGaA
- INTEGRA Biosciences AG
- FiberCell Systems Inc
- Thermo Fisher Scientific Inc
- Eppendorf AG
- Sartorius AG
- Danaher Corporation
- F Hoffmann-La Roche AG
- Genetix Biotech Asia Pvt Ltd
Key Developments in Antibody Production Industry Industry
- July 2022: GigaGen Inc. (Grifols subsidiary) published research on its recombinant polyclonal antibody (GIGA-2050) targeting SARS-CoV-2, showcasing GMP manufacturing and IND-enabling studies. This highlights advancements in polyclonal antibody development and their potential for infectious disease treatment.
- June 2022: The NIH launched a clinical trial for dupilumab, a monoclonal antibody for treating allergic asthma in children from low-income urban areas. This underscores the increasing focus on utilizing monoclonal antibodies for treating specific patient populations.
Strategic Outlook for Antibody Production Industry Market
The antibody production industry is poised for continued growth, driven by technological advancements, increasing disease prevalence, and expanding therapeutic applications. Strategic partnerships, investments in R&D, and expansion into emerging markets will be crucial for success. The focus on personalized medicine and innovative antibody formats will shape future market dynamics. Companies that successfully navigate regulatory hurdles and embrace technological advancements will be best positioned for long-term growth and market leadership.
Antibody Production Industry Segmentation
-
1. Antibody Type
- 1.1. Monoclonal Antibodies
- 1.2. Polyclonal Antibodies
- 1.3. Other Antibody Types
-
2. Process
-
2.1. Upstream Processing
- 2.1.1. Bioreactors
- 2.1.2. Consumables
-
2.2. Downstream Processing
- 2.2.1. Chromatography Systems
- 2.2.2. Chromatography Resins
- 2.3. Filtration
-
2.1. Upstream Processing
-
3. End User
- 3.1. Pharmaceutical and Biotechnology Companies
- 3.2. Research Laboratories
- 3.3. Other End Users
Antibody Production Industry Segmentation By Geography
-
1. North America
- 1.1. United States
- 1.2. Canada
- 1.3. Mexico
-
2. Europe
- 2.1. Germany
- 2.2. United Kingdom
- 2.3. France
- 2.4. Italy
- 2.5. Spain
- 2.6. Rest of Europe
-
3. Asia Pacific
- 3.1. China
- 3.2. Japan
- 3.3. India
- 3.4. Australia
- 3.5. South Korea
- 3.6. Rest of Asia Pacific
-
4. Middle East and Africa
- 4.1. GCC
- 4.2. South Africa
- 4.3. Rest of Middle East and Africa
-
5. South America
- 5.1. Brazil
- 5.2. Argentina
- 5.3. Rest of South America
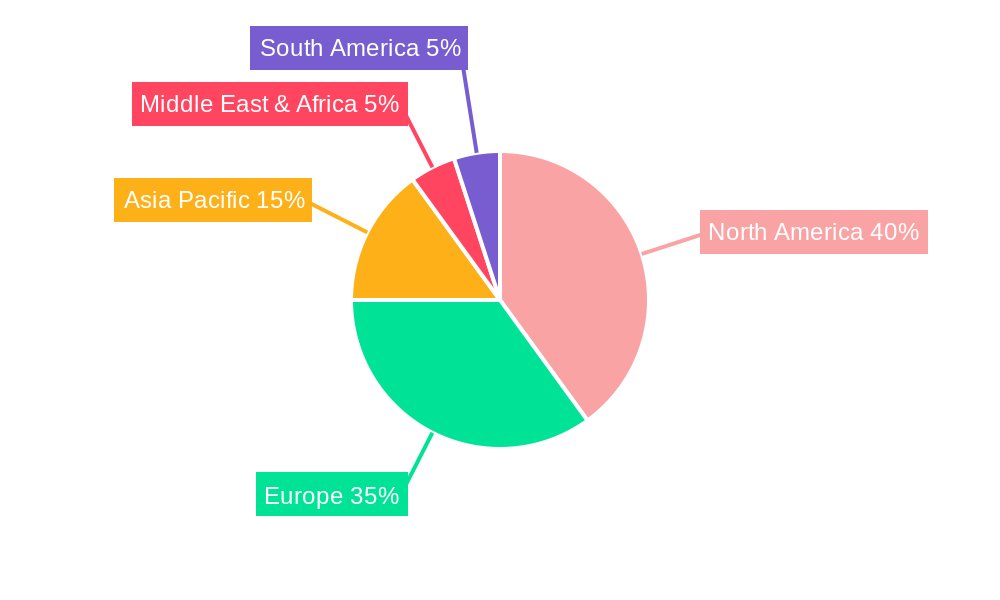
Antibody Production Industry Regional Market Share
Geographic Coverage of Antibody Production Industry
Antibody Production Industry REPORT HIGHLIGHTS
| Aspects | Details |
|---|---|
| Study Period | 2020-2034 |
| Base Year | 2025 |
| Estimated Year | 2026 |
| Forecast Period | 2026-2034 |
| Historical Period | 2020-2025 |
| Growth Rate | CAGR of 12.7% from 2020-2034 |
| Segmentation |
|
Table of Contents
- 1. Introduction
- 1.1. Research Scope
- 1.2. Market Segmentation
- 1.3. Research Objective
- 1.4. Definitions and Assumptions
- 2. Executive Summary
- 2.1. Market Snapshot
- 3. Market Dynamics
- 3.1. Market Drivers
- 3.2. Market Restrains
- 3.3. Market Trends
- 3.4. Market Opportunities
- 4. Market Factor Analysis
- 4.1. Porters Five Forces
- 4.1.1. Bargaining Power of Suppliers
- 4.1.2. Bargaining Power of Buyers
- 4.1.3. Threat of New Entrants
- 4.1.4. Threat of Substitutes
- 4.1.5. Competitive Rivalry
- 4.2. PESTEL analysis
- 4.3. BCG Analysis
- 4.3.1. Stars (High Growth, High Market Share)
- 4.3.2. Cash Cows (Low Growth, High Market Share)
- 4.3.3. Question Mark (High Growth, Low Market Share)
- 4.3.4. Dogs (Low Growth, Low Market Share)
- 4.4. Ansoff Matrix Analysis
- 4.5. Supply Chain Analysis
- 4.6. Regulatory Landscape
- 4.7. Current Market Potential and Opportunity Assessment (TAM–SAM–SOM Framework)
- 4.8. RAX Analyst Note
- 4.1. Porters Five Forces
- 5. Market Analysis, Insights and Forecast 2021-2033
- 5.1. Market Analysis, Insights and Forecast - by Antibody Type
- 5.1.1. Monoclonal Antibodies
- 5.1.2. Polyclonal Antibodies
- 5.1.3. Other Antibody Types
- 5.2. Market Analysis, Insights and Forecast - by Process
- 5.2.1. Upstream Processing
- 5.2.1.1. Bioreactors
- 5.2.1.2. Consumables
- 5.2.2. Downstream Processing
- 5.2.2.1. Chromatography Systems
- 5.2.2.2. Chromatography Resins
- 5.2.3. Filtration
- 5.2.1. Upstream Processing
- 5.3. Market Analysis, Insights and Forecast - by End User
- 5.3.1. Pharmaceutical and Biotechnology Companies
- 5.3.2. Research Laboratories
- 5.3.3. Other End Users
- 5.4. Market Analysis, Insights and Forecast - by Region
- 5.4.1. North America
- 5.4.2. Europe
- 5.4.3. Asia Pacific
- 5.4.4. Middle East and Africa
- 5.4.5. South America
- 5.1. Market Analysis, Insights and Forecast - by Antibody Type
- 6. Global Antibody Production Industry Analysis, Insights and Forecast, 2021-2033
- 6.1. Market Analysis, Insights and Forecast - by Antibody Type
- 6.1.1. Monoclonal Antibodies
- 6.1.2. Polyclonal Antibodies
- 6.1.3. Other Antibody Types
- 6.2. Market Analysis, Insights and Forecast - by Process
- 6.2.1. Upstream Processing
- 6.2.1.1. Bioreactors
- 6.2.1.2. Consumables
- 6.2.2. Downstream Processing
- 6.2.2.1. Chromatography Systems
- 6.2.2.2. Chromatography Resins
- 6.2.3. Filtration
- 6.2.1. Upstream Processing
- 6.3. Market Analysis, Insights and Forecast - by End User
- 6.3.1. Pharmaceutical and Biotechnology Companies
- 6.3.2. Research Laboratories
- 6.3.3. Other End Users
- 6.1. Market Analysis, Insights and Forecast - by Antibody Type
- 7. North America Antibody Production Industry Analysis, Insights and Forecast, 2020-2032
- 7.1. Market Analysis, Insights and Forecast - by Antibody Type
- 7.1.1. Monoclonal Antibodies
- 7.1.2. Polyclonal Antibodies
- 7.1.3. Other Antibody Types
- 7.2. Market Analysis, Insights and Forecast - by Process
- 7.2.1. Upstream Processing
- 7.2.1.1. Bioreactors
- 7.2.1.2. Consumables
- 7.2.2. Downstream Processing
- 7.2.2.1. Chromatography Systems
- 7.2.2.2. Chromatography Resins
- 7.2.3. Filtration
- 7.2.1. Upstream Processing
- 7.3. Market Analysis, Insights and Forecast - by End User
- 7.3.1. Pharmaceutical and Biotechnology Companies
- 7.3.2. Research Laboratories
- 7.3.3. Other End Users
- 7.1. Market Analysis, Insights and Forecast - by Antibody Type
- 8. Europe Antibody Production Industry Analysis, Insights and Forecast, 2020-2032
- 8.1. Market Analysis, Insights and Forecast - by Antibody Type
- 8.1.1. Monoclonal Antibodies
- 8.1.2. Polyclonal Antibodies
- 8.1.3. Other Antibody Types
- 8.2. Market Analysis, Insights and Forecast - by Process
- 8.2.1. Upstream Processing
- 8.2.1.1. Bioreactors
- 8.2.1.2. Consumables
- 8.2.2. Downstream Processing
- 8.2.2.1. Chromatography Systems
- 8.2.2.2. Chromatography Resins
- 8.2.3. Filtration
- 8.2.1. Upstream Processing
- 8.3. Market Analysis, Insights and Forecast - by End User
- 8.3.1. Pharmaceutical and Biotechnology Companies
- 8.3.2. Research Laboratories
- 8.3.3. Other End Users
- 8.1. Market Analysis, Insights and Forecast - by Antibody Type
- 9. Asia Pacific Antibody Production Industry Analysis, Insights and Forecast, 2020-2032
- 9.1. Market Analysis, Insights and Forecast - by Antibody Type
- 9.1.1. Monoclonal Antibodies
- 9.1.2. Polyclonal Antibodies
- 9.1.3. Other Antibody Types
- 9.2. Market Analysis, Insights and Forecast - by Process
- 9.2.1. Upstream Processing
- 9.2.1.1. Bioreactors
- 9.2.1.2. Consumables
- 9.2.2. Downstream Processing
- 9.2.2.1. Chromatography Systems
- 9.2.2.2. Chromatography Resins
- 9.2.3. Filtration
- 9.2.1. Upstream Processing
- 9.3. Market Analysis, Insights and Forecast - by End User
- 9.3.1. Pharmaceutical and Biotechnology Companies
- 9.3.2. Research Laboratories
- 9.3.3. Other End Users
- 9.1. Market Analysis, Insights and Forecast - by Antibody Type
- 10. Middle East and Africa Antibody Production Industry Analysis, Insights and Forecast, 2020-2032
- 10.1. Market Analysis, Insights and Forecast - by Antibody Type
- 10.1.1. Monoclonal Antibodies
- 10.1.2. Polyclonal Antibodies
- 10.1.3. Other Antibody Types
- 10.2. Market Analysis, Insights and Forecast - by Process
- 10.2.1. Upstream Processing
- 10.2.1.1. Bioreactors
- 10.2.1.2. Consumables
- 10.2.2. Downstream Processing
- 10.2.2.1. Chromatography Systems
- 10.2.2.2. Chromatography Resins
- 10.2.3. Filtration
- 10.2.1. Upstream Processing
- 10.3. Market Analysis, Insights and Forecast - by End User
- 10.3.1. Pharmaceutical and Biotechnology Companies
- 10.3.2. Research Laboratories
- 10.3.3. Other End Users
- 10.1. Market Analysis, Insights and Forecast - by Antibody Type
- 11. South America Antibody Production Industry Analysis, Insights and Forecast, 2020-2032
- 11.1. Market Analysis, Insights and Forecast - by Antibody Type
- 11.1.1. Monoclonal Antibodies
- 11.1.2. Polyclonal Antibodies
- 11.1.3. Other Antibody Types
- 11.2. Market Analysis, Insights and Forecast - by Process
- 11.2.1. Upstream Processing
- 11.2.1.1. Bioreactors
- 11.2.1.2. Consumables
- 11.2.2. Downstream Processing
- 11.2.2.1. Chromatography Systems
- 11.2.2.2. Chromatography Resins
- 11.2.3. Filtration
- 11.2.1. Upstream Processing
- 11.3. Market Analysis, Insights and Forecast - by End User
- 11.3.1. Pharmaceutical and Biotechnology Companies
- 11.3.2. Research Laboratories
- 11.3.3. Other End Users
- 11.1. Market Analysis, Insights and Forecast - by Antibody Type
- 12. Competitive Analysis
- 12.1. Company Profiles
- 12.1.1 Solaris Biotech
- 12.1.1.1. Company Overview
- 12.1.1.2. Products
- 12.1.1.3. Company Financials
- 12.1.1.4. SWOT Analysis
- 12.1.2 Applikon Biotechnology Inc
- 12.1.2.1. Company Overview
- 12.1.2.2. Products
- 12.1.2.3. Company Financials
- 12.1.2.4. SWOT Analysis
- 12.1.3 Grifols
- 12.1.3.1. Company Overview
- 12.1.3.2. Products
- 12.1.3.3. Company Financials
- 12.1.3.4. SWOT Analysis
- 12.1.4 Merck KGaA
- 12.1.4.1. Company Overview
- 12.1.4.2. Products
- 12.1.4.3. Company Financials
- 12.1.4.4. SWOT Analysis
- 12.1.5 INTEGRA Biosciences AG
- 12.1.5.1. Company Overview
- 12.1.5.2. Products
- 12.1.5.3. Company Financials
- 12.1.5.4. SWOT Analysis
- 12.1.6 FiberCell Systems Inc
- 12.1.6.1. Company Overview
- 12.1.6.2. Products
- 12.1.6.3. Company Financials
- 12.1.6.4. SWOT Analysis
- 12.1.7 Thermo Fisher Scientific Inc
- 12.1.7.1. Company Overview
- 12.1.7.2. Products
- 12.1.7.3. Company Financials
- 12.1.7.4. SWOT Analysis
- 12.1.8 Eppendorf AG
- 12.1.8.1. Company Overview
- 12.1.8.2. Products
- 12.1.8.3. Company Financials
- 12.1.8.4. SWOT Analysis
- 12.1.9 Sartorius AG
- 12.1.9.1. Company Overview
- 12.1.9.2. Products
- 12.1.9.3. Company Financials
- 12.1.9.4. SWOT Analysis
- 12.1.10 Danaher Corporation
- 12.1.10.1. Company Overview
- 12.1.10.2. Products
- 12.1.10.3. Company Financials
- 12.1.10.4. SWOT Analysis
- 12.1.11 F Hoffmann-La Roche AG
- 12.1.11.1. Company Overview
- 12.1.11.2. Products
- 12.1.11.3. Company Financials
- 12.1.11.4. SWOT Analysis
- 12.1.12 Genetix Biotech Asia Pvt Ltd
- 12.1.12.1. Company Overview
- 12.1.12.2. Products
- 12.1.12.3. Company Financials
- 12.1.12.4. SWOT Analysis
- 12.1.1 Solaris Biotech
- 12.2. Market Entropy
- 12.2.1 Company's Key Areas Served
- 12.2.2 Recent Developments
- 12.3. Company Market Share Analysis 2025
- 12.3.1 Top 5 Companies Market Share Analysis
- 12.3.2 Top 3 Companies Market Share Analysis
- 12.4. List of Potential Customers
- 13. Research Methodology
List of Figures
- Figure 1: Global Antibody Production Industry Revenue Breakdown (billion, %) by Region 2025 & 2033
- Figure 2: Global Antibody Production Industry Volume Breakdown (K Unit, %) by Region 2025 & 2033
- Figure 3: North America Antibody Production Industry Revenue (billion), by Antibody Type 2025 & 2033
- Figure 4: North America Antibody Production Industry Volume (K Unit), by Antibody Type 2025 & 2033
- Figure 5: North America Antibody Production Industry Revenue Share (%), by Antibody Type 2025 & 2033
- Figure 6: North America Antibody Production Industry Volume Share (%), by Antibody Type 2025 & 2033
- Figure 7: North America Antibody Production Industry Revenue (billion), by Process 2025 & 2033
- Figure 8: North America Antibody Production Industry Volume (K Unit), by Process 2025 & 2033
- Figure 9: North America Antibody Production Industry Revenue Share (%), by Process 2025 & 2033
- Figure 10: North America Antibody Production Industry Volume Share (%), by Process 2025 & 2033
- Figure 11: North America Antibody Production Industry Revenue (billion), by End User 2025 & 2033
- Figure 12: North America Antibody Production Industry Volume (K Unit), by End User 2025 & 2033
- Figure 13: North America Antibody Production Industry Revenue Share (%), by End User 2025 & 2033
- Figure 14: North America Antibody Production Industry Volume Share (%), by End User 2025 & 2033
- Figure 15: North America Antibody Production Industry Revenue (billion), by Country 2025 & 2033
- Figure 16: North America Antibody Production Industry Volume (K Unit), by Country 2025 & 2033
- Figure 17: North America Antibody Production Industry Revenue Share (%), by Country 2025 & 2033
- Figure 18: North America Antibody Production Industry Volume Share (%), by Country 2025 & 2033
- Figure 19: Europe Antibody Production Industry Revenue (billion), by Antibody Type 2025 & 2033
- Figure 20: Europe Antibody Production Industry Volume (K Unit), by Antibody Type 2025 & 2033
- Figure 21: Europe Antibody Production Industry Revenue Share (%), by Antibody Type 2025 & 2033
- Figure 22: Europe Antibody Production Industry Volume Share (%), by Antibody Type 2025 & 2033
- Figure 23: Europe Antibody Production Industry Revenue (billion), by Process 2025 & 2033
- Figure 24: Europe Antibody Production Industry Volume (K Unit), by Process 2025 & 2033
- Figure 25: Europe Antibody Production Industry Revenue Share (%), by Process 2025 & 2033
- Figure 26: Europe Antibody Production Industry Volume Share (%), by Process 2025 & 2033
- Figure 27: Europe Antibody Production Industry Revenue (billion), by End User 2025 & 2033
- Figure 28: Europe Antibody Production Industry Volume (K Unit), by End User 2025 & 2033
- Figure 29: Europe Antibody Production Industry Revenue Share (%), by End User 2025 & 2033
- Figure 30: Europe Antibody Production Industry Volume Share (%), by End User 2025 & 2033
- Figure 31: Europe Antibody Production Industry Revenue (billion), by Country 2025 & 2033
- Figure 32: Europe Antibody Production Industry Volume (K Unit), by Country 2025 & 2033
- Figure 33: Europe Antibody Production Industry Revenue Share (%), by Country 2025 & 2033
- Figure 34: Europe Antibody Production Industry Volume Share (%), by Country 2025 & 2033
- Figure 35: Asia Pacific Antibody Production Industry Revenue (billion), by Antibody Type 2025 & 2033
- Figure 36: Asia Pacific Antibody Production Industry Volume (K Unit), by Antibody Type 2025 & 2033
- Figure 37: Asia Pacific Antibody Production Industry Revenue Share (%), by Antibody Type 2025 & 2033
- Figure 38: Asia Pacific Antibody Production Industry Volume Share (%), by Antibody Type 2025 & 2033
- Figure 39: Asia Pacific Antibody Production Industry Revenue (billion), by Process 2025 & 2033
- Figure 40: Asia Pacific Antibody Production Industry Volume (K Unit), by Process 2025 & 2033
- Figure 41: Asia Pacific Antibody Production Industry Revenue Share (%), by Process 2025 & 2033
- Figure 42: Asia Pacific Antibody Production Industry Volume Share (%), by Process 2025 & 2033
- Figure 43: Asia Pacific Antibody Production Industry Revenue (billion), by End User 2025 & 2033
- Figure 44: Asia Pacific Antibody Production Industry Volume (K Unit), by End User 2025 & 2033
- Figure 45: Asia Pacific Antibody Production Industry Revenue Share (%), by End User 2025 & 2033
- Figure 46: Asia Pacific Antibody Production Industry Volume Share (%), by End User 2025 & 2033
- Figure 47: Asia Pacific Antibody Production Industry Revenue (billion), by Country 2025 & 2033
- Figure 48: Asia Pacific Antibody Production Industry Volume (K Unit), by Country 2025 & 2033
- Figure 49: Asia Pacific Antibody Production Industry Revenue Share (%), by Country 2025 & 2033
- Figure 50: Asia Pacific Antibody Production Industry Volume Share (%), by Country 2025 & 2033
- Figure 51: Middle East and Africa Antibody Production Industry Revenue (billion), by Antibody Type 2025 & 2033
- Figure 52: Middle East and Africa Antibody Production Industry Volume (K Unit), by Antibody Type 2025 & 2033
- Figure 53: Middle East and Africa Antibody Production Industry Revenue Share (%), by Antibody Type 2025 & 2033
- Figure 54: Middle East and Africa Antibody Production Industry Volume Share (%), by Antibody Type 2025 & 2033
- Figure 55: Middle East and Africa Antibody Production Industry Revenue (billion), by Process 2025 & 2033
- Figure 56: Middle East and Africa Antibody Production Industry Volume (K Unit), by Process 2025 & 2033
- Figure 57: Middle East and Africa Antibody Production Industry Revenue Share (%), by Process 2025 & 2033
- Figure 58: Middle East and Africa Antibody Production Industry Volume Share (%), by Process 2025 & 2033
- Figure 59: Middle East and Africa Antibody Production Industry Revenue (billion), by End User 2025 & 2033
- Figure 60: Middle East and Africa Antibody Production Industry Volume (K Unit), by End User 2025 & 2033
- Figure 61: Middle East and Africa Antibody Production Industry Revenue Share (%), by End User 2025 & 2033
- Figure 62: Middle East and Africa Antibody Production Industry Volume Share (%), by End User 2025 & 2033
- Figure 63: Middle East and Africa Antibody Production Industry Revenue (billion), by Country 2025 & 2033
- Figure 64: Middle East and Africa Antibody Production Industry Volume (K Unit), by Country 2025 & 2033
- Figure 65: Middle East and Africa Antibody Production Industry Revenue Share (%), by Country 2025 & 2033
- Figure 66: Middle East and Africa Antibody Production Industry Volume Share (%), by Country 2025 & 2033
- Figure 67: South America Antibody Production Industry Revenue (billion), by Antibody Type 2025 & 2033
- Figure 68: South America Antibody Production Industry Volume (K Unit), by Antibody Type 2025 & 2033
- Figure 69: South America Antibody Production Industry Revenue Share (%), by Antibody Type 2025 & 2033
- Figure 70: South America Antibody Production Industry Volume Share (%), by Antibody Type 2025 & 2033
- Figure 71: South America Antibody Production Industry Revenue (billion), by Process 2025 & 2033
- Figure 72: South America Antibody Production Industry Volume (K Unit), by Process 2025 & 2033
- Figure 73: South America Antibody Production Industry Revenue Share (%), by Process 2025 & 2033
- Figure 74: South America Antibody Production Industry Volume Share (%), by Process 2025 & 2033
- Figure 75: South America Antibody Production Industry Revenue (billion), by End User 2025 & 2033
- Figure 76: South America Antibody Production Industry Volume (K Unit), by End User 2025 & 2033
- Figure 77: South America Antibody Production Industry Revenue Share (%), by End User 2025 & 2033
- Figure 78: South America Antibody Production Industry Volume Share (%), by End User 2025 & 2033
- Figure 79: South America Antibody Production Industry Revenue (billion), by Country 2025 & 2033
- Figure 80: South America Antibody Production Industry Volume (K Unit), by Country 2025 & 2033
- Figure 81: South America Antibody Production Industry Revenue Share (%), by Country 2025 & 2033
- Figure 82: South America Antibody Production Industry Volume Share (%), by Country 2025 & 2033
List of Tables
- Table 1: Global Antibody Production Industry Revenue billion Forecast, by Antibody Type 2020 & 2033
- Table 2: Global Antibody Production Industry Volume K Unit Forecast, by Antibody Type 2020 & 2033
- Table 3: Global Antibody Production Industry Revenue billion Forecast, by Process 2020 & 2033
- Table 4: Global Antibody Production Industry Volume K Unit Forecast, by Process 2020 & 2033
- Table 5: Global Antibody Production Industry Revenue billion Forecast, by End User 2020 & 2033
- Table 6: Global Antibody Production Industry Volume K Unit Forecast, by End User 2020 & 2033
- Table 7: Global Antibody Production Industry Revenue billion Forecast, by Region 2020 & 2033
- Table 8: Global Antibody Production Industry Volume K Unit Forecast, by Region 2020 & 2033
- Table 9: Global Antibody Production Industry Revenue billion Forecast, by Antibody Type 2020 & 2033
- Table 10: Global Antibody Production Industry Volume K Unit Forecast, by Antibody Type 2020 & 2033
- Table 11: Global Antibody Production Industry Revenue billion Forecast, by Process 2020 & 2033
- Table 12: Global Antibody Production Industry Volume K Unit Forecast, by Process 2020 & 2033
- Table 13: Global Antibody Production Industry Revenue billion Forecast, by End User 2020 & 2033
- Table 14: Global Antibody Production Industry Volume K Unit Forecast, by End User 2020 & 2033
- Table 15: Global Antibody Production Industry Revenue billion Forecast, by Country 2020 & 2033
- Table 16: Global Antibody Production Industry Volume K Unit Forecast, by Country 2020 & 2033
- Table 17: United States Antibody Production Industry Revenue (billion) Forecast, by Application 2020 & 2033
- Table 18: United States Antibody Production Industry Volume (K Unit) Forecast, by Application 2020 & 2033
- Table 19: Canada Antibody Production Industry Revenue (billion) Forecast, by Application 2020 & 2033
- Table 20: Canada Antibody Production Industry Volume (K Unit) Forecast, by Application 2020 & 2033
- Table 21: Mexico Antibody Production Industry Revenue (billion) Forecast, by Application 2020 & 2033
- Table 22: Mexico Antibody Production Industry Volume (K Unit) Forecast, by Application 2020 & 2033
- Table 23: Global Antibody Production Industry Revenue billion Forecast, by Antibody Type 2020 & 2033
- Table 24: Global Antibody Production Industry Volume K Unit Forecast, by Antibody Type 2020 & 2033
- Table 25: Global Antibody Production Industry Revenue billion Forecast, by Process 2020 & 2033
- Table 26: Global Antibody Production Industry Volume K Unit Forecast, by Process 2020 & 2033
- Table 27: Global Antibody Production Industry Revenue billion Forecast, by End User 2020 & 2033
- Table 28: Global Antibody Production Industry Volume K Unit Forecast, by End User 2020 & 2033
- Table 29: Global Antibody Production Industry Revenue billion Forecast, by Country 2020 & 2033
- Table 30: Global Antibody Production Industry Volume K Unit Forecast, by Country 2020 & 2033
- Table 31: Germany Antibody Production Industry Revenue (billion) Forecast, by Application 2020 & 2033
- Table 32: Germany Antibody Production Industry Volume (K Unit) Forecast, by Application 2020 & 2033
- Table 33: United Kingdom Antibody Production Industry Revenue (billion) Forecast, by Application 2020 & 2033
- Table 34: United Kingdom Antibody Production Industry Volume (K Unit) Forecast, by Application 2020 & 2033
- Table 35: France Antibody Production Industry Revenue (billion) Forecast, by Application 2020 & 2033
- Table 36: France Antibody Production Industry Volume (K Unit) Forecast, by Application 2020 & 2033
- Table 37: Italy Antibody Production Industry Revenue (billion) Forecast, by Application 2020 & 2033
- Table 38: Italy Antibody Production Industry Volume (K Unit) Forecast, by Application 2020 & 2033
- Table 39: Spain Antibody Production Industry Revenue (billion) Forecast, by Application 2020 & 2033
- Table 40: Spain Antibody Production Industry Volume (K Unit) Forecast, by Application 2020 & 2033
- Table 41: Rest of Europe Antibody Production Industry Revenue (billion) Forecast, by Application 2020 & 2033
- Table 42: Rest of Europe Antibody Production Industry Volume (K Unit) Forecast, by Application 2020 & 2033
- Table 43: Global Antibody Production Industry Revenue billion Forecast, by Antibody Type 2020 & 2033
- Table 44: Global Antibody Production Industry Volume K Unit Forecast, by Antibody Type 2020 & 2033
- Table 45: Global Antibody Production Industry Revenue billion Forecast, by Process 2020 & 2033
- Table 46: Global Antibody Production Industry Volume K Unit Forecast, by Process 2020 & 2033
- Table 47: Global Antibody Production Industry Revenue billion Forecast, by End User 2020 & 2033
- Table 48: Global Antibody Production Industry Volume K Unit Forecast, by End User 2020 & 2033
- Table 49: Global Antibody Production Industry Revenue billion Forecast, by Country 2020 & 2033
- Table 50: Global Antibody Production Industry Volume K Unit Forecast, by Country 2020 & 2033
- Table 51: China Antibody Production Industry Revenue (billion) Forecast, by Application 2020 & 2033
- Table 52: China Antibody Production Industry Volume (K Unit) Forecast, by Application 2020 & 2033
- Table 53: Japan Antibody Production Industry Revenue (billion) Forecast, by Application 2020 & 2033
- Table 54: Japan Antibody Production Industry Volume (K Unit) Forecast, by Application 2020 & 2033
- Table 55: India Antibody Production Industry Revenue (billion) Forecast, by Application 2020 & 2033
- Table 56: India Antibody Production Industry Volume (K Unit) Forecast, by Application 2020 & 2033
- Table 57: Australia Antibody Production Industry Revenue (billion) Forecast, by Application 2020 & 2033
- Table 58: Australia Antibody Production Industry Volume (K Unit) Forecast, by Application 2020 & 2033
- Table 59: South Korea Antibody Production Industry Revenue (billion) Forecast, by Application 2020 & 2033
- Table 60: South Korea Antibody Production Industry Volume (K Unit) Forecast, by Application 2020 & 2033
- Table 61: Rest of Asia Pacific Antibody Production Industry Revenue (billion) Forecast, by Application 2020 & 2033
- Table 62: Rest of Asia Pacific Antibody Production Industry Volume (K Unit) Forecast, by Application 2020 & 2033
- Table 63: Global Antibody Production Industry Revenue billion Forecast, by Antibody Type 2020 & 2033
- Table 64: Global Antibody Production Industry Volume K Unit Forecast, by Antibody Type 2020 & 2033
- Table 65: Global Antibody Production Industry Revenue billion Forecast, by Process 2020 & 2033
- Table 66: Global Antibody Production Industry Volume K Unit Forecast, by Process 2020 & 2033
- Table 67: Global Antibody Production Industry Revenue billion Forecast, by End User 2020 & 2033
- Table 68: Global Antibody Production Industry Volume K Unit Forecast, by End User 2020 & 2033
- Table 69: Global Antibody Production Industry Revenue billion Forecast, by Country 2020 & 2033
- Table 70: Global Antibody Production Industry Volume K Unit Forecast, by Country 2020 & 2033
- Table 71: GCC Antibody Production Industry Revenue (billion) Forecast, by Application 2020 & 2033
- Table 72: GCC Antibody Production Industry Volume (K Unit) Forecast, by Application 2020 & 2033
- Table 73: South Africa Antibody Production Industry Revenue (billion) Forecast, by Application 2020 & 2033
- Table 74: South Africa Antibody Production Industry Volume (K Unit) Forecast, by Application 2020 & 2033
- Table 75: Rest of Middle East and Africa Antibody Production Industry Revenue (billion) Forecast, by Application 2020 & 2033
- Table 76: Rest of Middle East and Africa Antibody Production Industry Volume (K Unit) Forecast, by Application 2020 & 2033
- Table 77: Global Antibody Production Industry Revenue billion Forecast, by Antibody Type 2020 & 2033
- Table 78: Global Antibody Production Industry Volume K Unit Forecast, by Antibody Type 2020 & 2033
- Table 79: Global Antibody Production Industry Revenue billion Forecast, by Process 2020 & 2033
- Table 80: Global Antibody Production Industry Volume K Unit Forecast, by Process 2020 & 2033
- Table 81: Global Antibody Production Industry Revenue billion Forecast, by End User 2020 & 2033
- Table 82: Global Antibody Production Industry Volume K Unit Forecast, by End User 2020 & 2033
- Table 83: Global Antibody Production Industry Revenue billion Forecast, by Country 2020 & 2033
- Table 84: Global Antibody Production Industry Volume K Unit Forecast, by Country 2020 & 2033
- Table 85: Brazil Antibody Production Industry Revenue (billion) Forecast, by Application 2020 & 2033
- Table 86: Brazil Antibody Production Industry Volume (K Unit) Forecast, by Application 2020 & 2033
- Table 87: Argentina Antibody Production Industry Revenue (billion) Forecast, by Application 2020 & 2033
- Table 88: Argentina Antibody Production Industry Volume (K Unit) Forecast, by Application 2020 & 2033
- Table 89: Rest of South America Antibody Production Industry Revenue (billion) Forecast, by Application 2020 & 2033
- Table 90: Rest of South America Antibody Production Industry Volume (K Unit) Forecast, by Application 2020 & 2033
Frequently Asked Questions
1. What is the projected Compound Annual Growth Rate (CAGR) of the Antibody Production Industry?
The projected CAGR is approximately 12.7%.
2. Which companies are prominent players in the Antibody Production Industry?
Key companies in the market include Solaris Biotech, Applikon Biotechnology Inc, Grifols, Merck KGaA, INTEGRA Biosciences AG, FiberCell Systems Inc , Thermo Fisher Scientific Inc, Eppendorf AG, Sartorius AG, Danaher Corporation, F Hoffmann-La Roche AG, Genetix Biotech Asia Pvt Ltd.
3. What are the main segments of the Antibody Production Industry?
The market segments include Antibody Type, Process, End User.
4. Can you provide details about the market size?
The market size is estimated to be USD 22.62 billion as of 2022.
5. What are some drivers contributing to market growth?
Rising Adoption of Targeted Immunotherapy; Increase in the R&D Expenditure of Pharmaceutical and Biotechnology Companies; Rising Demand for Therapeutic Antibodies.
6. What are the notable trends driving market growth?
The Monoclonal Antibodies Segment is Expected to Hold a Significant Market Share Over The Forecast Period.
7. Are there any restraints impacting market growth?
High Costs Involved in the Antibody Production; Stringent Government Regulations.
8. Can you provide examples of recent developments in the market?
July 2022: GigaGen Inc., a subsidiary of Grifols, published a research article in the international peer-reviewed journal Pathogens. The article showcased the GMP (good manufacturing practice) manufacturing and IND (Investigational New Drug)-enabling studies of its new class of drugs, recombinant polyclonal antibodies, describing the company's recombinant polyclonal product that targets SARS-CoV-2, GIGA-2050.
9. What pricing options are available for accessing the report?
Pricing options include single-user, multi-user, and enterprise licenses priced at USD 4750, USD 5250, and USD 8750 respectively.
10. Is the market size provided in terms of value or volume?
The market size is provided in terms of value, measured in billion and volume, measured in K Unit.
11. Are there any specific market keywords associated with the report?
Yes, the market keyword associated with the report is "Antibody Production Industry," which aids in identifying and referencing the specific market segment covered.
12. How do I determine which pricing option suits my needs best?
The pricing options vary based on user requirements and access needs. Individual users may opt for single-user licenses, while businesses requiring broader access may choose multi-user or enterprise licenses for cost-effective access to the report.
13. Are there any additional resources or data provided in the Antibody Production Industry report?
While the report offers comprehensive insights, it's advisable to review the specific contents or supplementary materials provided to ascertain if additional resources or data are available.
14. How can I stay updated on further developments or reports in the Antibody Production Industry?
To stay informed about further developments, trends, and reports in the Antibody Production Industry, consider subscribing to industry newsletters, following relevant companies and organizations, or regularly checking reputable industry news sources and publications.
Methodology
Step 1 - Identification of Relevant Samples Size from Population Database


Step 2 - Approaches for Defining Global Market Size (Value, Volume* & Price*)

Note*: In applicable scenarios
Step 3 - Data Sources
Primary Research
- Web Analytics
- Survey Reports
- Research Institute
- Latest Research Reports
- Opinion Leaders
Secondary Research
- Annual Reports
- White Paper
- Latest Press Release
- Industry Association
- Paid Database
- Investor Presentations

Step 4 - Data Triangulation
Involves using different sources of information in order to increase the validity of a study
These sources are likely to be stakeholders in a program - participants, other researchers, program staff, other community members, and so on.
Then we put all data in single framework & apply various statistical tools to find out the dynamic on the market.
During the analysis stage, feedback from the stakeholder groups would be compared to determine areas of agreement as well as areas of divergence