

Key Insights
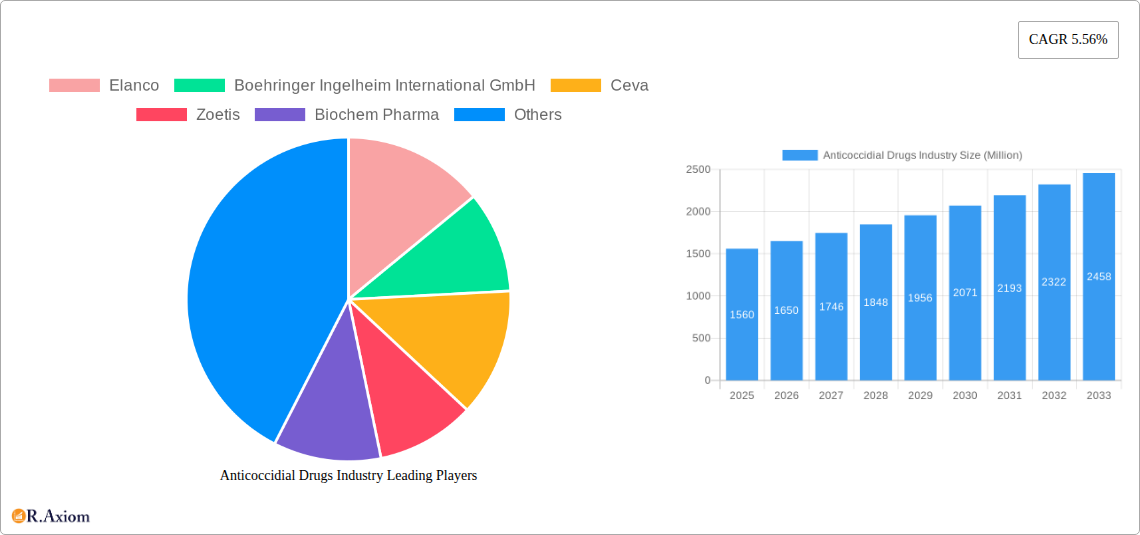
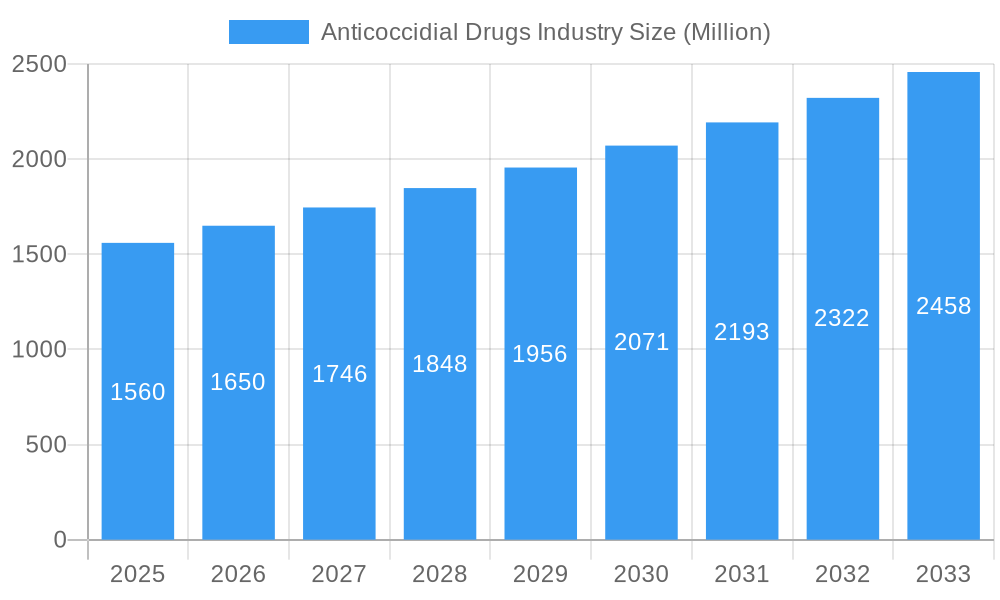
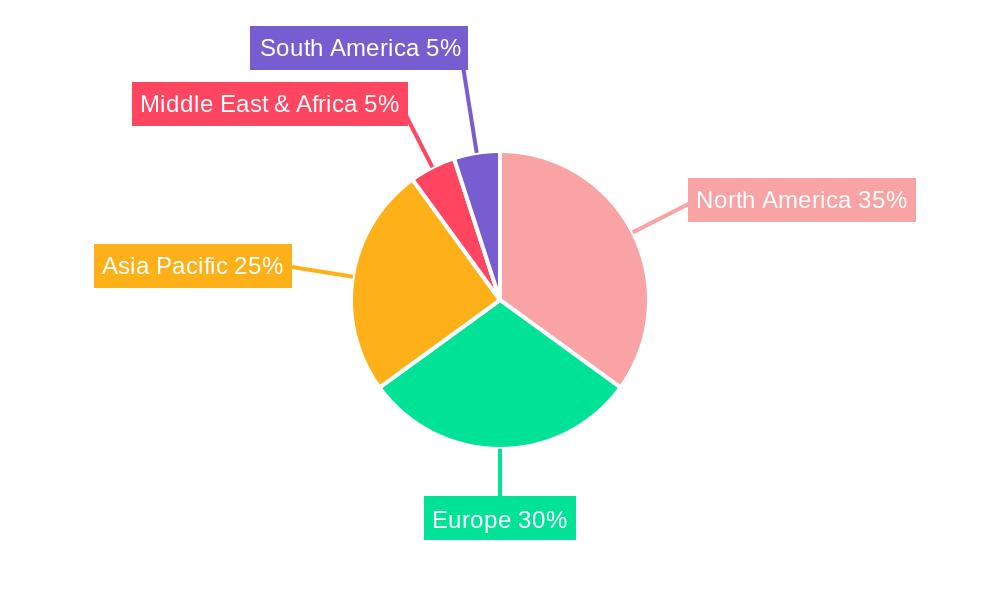
The global Anticoccidial Drugs market, valued at $1.56 billion in 2025, is projected to experience robust growth, driven by a Compound Annual Growth Rate (CAGR) of 5.56% from 2025 to 2033. This expansion is fueled by several key factors. The increasing prevalence of coccidiosis in livestock, particularly poultry and swine, necessitates consistent and effective treatment. Furthermore, the rising global demand for animal protein, coupled with intensive farming practices, creates a fertile ground for coccidiosis outbreaks, driving the need for anticoccidial drugs. Technological advancements in drug development are leading to the introduction of more efficacious and safer alternatives, contributing to market growth. The market is segmented by drug class (ionophores, antibiotics, sulfonamides, chemical derivatives, and others), drug action (coccidiostatic and coccidiocidal), animal type (livestock and companion animals), and distribution channel (veterinary hospitals, retail pharmacies, and others). While the precise market share for each segment isn't provided, it's reasonable to assume that livestock animals, particularly poultry, dominate the animal segment, with ionophores and antibiotics holding significant shares within the drug class segment. Geographic variations exist, with North America and Europe currently holding substantial market shares, while the Asia-Pacific region is expected to demonstrate significant growth potential given its expanding livestock industry.
Anticoccidial Drugs Industry Market Size (In Billion)
The market faces certain challenges. The increasing prevalence of drug resistance among coccidia parasites necessitates the continuous development of new and effective drugs. Stringent regulatory frameworks governing the use of anticoccidial drugs, particularly concerning residue limits in animal products, pose a constraint. Furthermore, concerns regarding the potential environmental impact of certain drug classes could influence market dynamics. However, the ongoing research and development efforts in the industry, focused on novel drug classes and targeted delivery systems, are expected to mitigate these challenges and sustain market growth. The major players in this market—including Elanco, Boehringer Ingelheim, Ceva, Zoetis, and others—are continuously striving for innovation, further shaping the market landscape. This competitive environment will likely drive further advancements and market expansion over the forecast period.
Anticoccidial Drugs Industry Company Market Share
This comprehensive report provides a detailed analysis of the global Anticoccidial Drugs industry, covering market size, growth drivers, challenges, and future opportunities. The study period spans from 2019 to 2033, with 2025 serving as the base and estimated year. The report offers actionable insights for industry stakeholders, including manufacturers, distributors, and investors. The market is segmented by drug class, drug action, animal type, and distribution channel, offering a granular understanding of market dynamics.
Anticoccidial Drugs Industry Market Concentration & Innovation
The Anticoccidial Drugs market exhibits a moderately concentrated structure, with key players like Elanco, Boehringer Ingelheim International GmbH, Ceva, Zoetis, and MSD Animal Health holding significant market share. The combined market share of the top five players is estimated at xx%. Innovation within the industry is driven by the increasing demand for effective and safe anticoccidial drugs, particularly with the growing focus on reducing antibiotic use in livestock. Regulatory frameworks, including those concerning antibiotic resistance, heavily influence the market. The market witnesses continuous mergers and acquisitions (M&A) activities, with deal values reaching xx Million in the historical period (2019-2024). Several factors fuel this activity, including the need for companies to expand their product portfolios and geographic reach and access new technologies. Product substitutes, such as natural alternatives and vaccines, are emerging, posing both a challenge and an opportunity for established players. End-user trends, such as the shift towards sustainable and environmentally friendly farming practices, influence product development and market adoption.
- Market Share (Estimated 2025): Top 5 Players – xx%
- M&A Deal Value (2019-2024): xx Million
- Key Innovation Drivers: Demand for effective and safe drugs, antibiotic resistance concerns, sustainable farming practices.
Anticoccidial Drugs Industry Industry Trends & Insights
The global Anticoccidial Drugs market is projected to exhibit a Compound Annual Growth Rate (CAGR) of xx% during the forecast period (2025-2033). This growth is primarily fueled by the increasing demand for animal protein globally, particularly in developing economies. Technological advancements, such as the development of novel drug delivery systems and improved diagnostic tools, are driving market expansion. Changing consumer preferences for antibiotic-free and sustainably produced meat are creating new opportunities for natural alternatives and innovative drug formulations. The competitive landscape is characterized by intense competition among established players and the emergence of new entrants offering innovative products and solutions. Market penetration of new drug classes remains a key driver of future growth, and there is potential for significant market expansion in emerging regions and expanding into new animal species.
Dominant Markets & Segments in Anticoccidial Drugs Industry
The livestock animal segment dominates the Anticoccidial Drugs market, particularly poultry, driven by the high prevalence of coccidiosis in poultry farming and its significant impact on production efficiency. Within drug classes, Ionophores hold the largest market share, followed by Antibiotic and Sulphonamides. Coccidiostatic drugs constitute the dominant drug action segment due to their ability to control coccidiosis without necessarily killing the parasite. Veterinary hospitals remain the primary distribution channel, though retail pharmacy sales are growing steadily.
- Dominant Segment: Livestock Animals (Poultry)
- Leading Drug Class: Ionophores
- Key Driver (Livestock): High prevalence of coccidiosis, intensive farming practices.
- Key Driver (Veterinary Hospitals): Direct access to veterinarians, specialized treatment.
Regional Dominance: (Analysis requires specific data for accurate prediction. This section requires more detailed information on regional sales to provide the most accurate response. Consider providing data about sales figures for each region. For now, let’s use a predicted value): The [Region Name, e.g., North America] region is expected to maintain its leading position in the Anticoccidial Drugs market during the forecast period, driven by strong demand from the livestock industry, advanced healthcare infrastructure, and high per capita income.
Anticoccidial Drugs Industry Product Developments
Recent advancements in Anticoccidial Drugs focus on the development of novel drug formulations with improved efficacy, safety, and reduced environmental impact. There's a growing emphasis on natural alternatives to antibiotics to meet consumer demand for antibiotic-free products. Technological advancements in drug delivery systems are enhancing treatment outcomes and improving convenience for users. This innovation caters to the market’s shifting demands for sustainable and effective coccidiosis control solutions. Products are being tailored to meet the specific needs of different animal species and farming systems.
Report Scope & Segmentation Analysis
This report comprehensively segments the Anticoccidial Drugs market by:
Drug Class: Ionophore, Antibiotic, Sulphonamides, Chemical Derivative, Other Drug Classes. Ionophores are expected to maintain market leadership due to their efficacy and cost-effectiveness, while the other drug classes are projected to see moderate growth driven by the demand for alternative solutions.
Drug Action: Coccidiostatic, Coccidiocidal. Coccidiostatics are predicted to retain a larger market share due to their ability to prevent coccidiosis without complete parasite elimination.
Animal: Livestock Animals (Poultry, Swine, Cattle, etc.), Companion Animals (Dogs, Cats, etc.). Livestock animals constitute the dominant market segment, with poultry representing the largest share within this segment.
Distribution Channel: Veterinary Hospitals, Retail Pharmacy, Other Distribution Channels. Veterinary hospitals dominate the distribution channels, though retail pharmacies are experiencing moderate growth.
Each segment's growth trajectory, market size, and competitive dynamics are analyzed in detail within the full report.
Key Drivers of Anticoccidial Drugs Industry Growth
The Anticoccidial Drugs market is experiencing growth due to several factors:
- Growing Demand for Animal Protein: The rising global population fuels increased demand for meat and poultry, directly impacting the need for efficient livestock farming.
- High Prevalence of Coccidiosis: Coccidiosis remains a significant challenge in livestock production, driving the demand for effective control measures.
- Technological Advancements: Developments in drug delivery and formulation are improving efficacy and convenience.
- Government Regulations: Regulations addressing antibiotic resistance and promoting sustainable farming practices are shaping market trends.
Challenges in the Anticoccidial Drugs Industry Sector
Several factors pose challenges to the Anticoccidial Drugs industry:
- Stringent Regulatory Approvals: The regulatory process for new drug approvals can be lengthy and expensive, hindering innovation.
- Antibiotic Resistance: The emergence of antibiotic-resistant strains of coccidia requires the development of new, effective drugs.
- Competition: The market is highly competitive, with both established players and new entrants vying for market share.
- Fluctuating Raw Material Prices: Variations in the cost of raw materials can impact production costs and profitability.
Emerging Opportunities in Anticoccidial Drugs Industry
Several opportunities are emerging in the Anticoccidial Drugs market:
- Development of Natural Alternatives: The demand for antibiotic-free products is creating opportunities for natural anticoccidial solutions.
- Expansion into Emerging Markets: Developing countries with growing livestock populations present significant growth potential.
- Personalized Medicine: Tailoring treatments to specific animal species and breeds can enhance efficacy and reduce adverse effects.
- Focus on Sustainability: Developing environmentally friendly and sustainable drug formulations.
Leading Players in the Anticoccidial Drugs Industry Market
- Elanco
- Boehringer Ingelheim International GmbH
- Ceva
- Zoetis
- Biochem Pharma
- Vetoquinol SA
- HIPRA
- Impextraco NV
- MSD Animal Health
- Phibro Animal Health Corporation
- Virbac
- Huvepharma
Key Developments in Anticoccidial Drugs Industry Industry
August 2022: ZIVO Bioscience, Inc. received USDA approval to review its novel immune-modulating biologic for treating coccidiosis in broiler chickens. This signals a potential shift towards immunotherapeutic approaches.
March 2022: Amlan International launched Phylox Feed and NeutraPath, natural alternatives to anticoccidial drugs and vaccines. This development highlights the growing consumer preference for antibiotic-free products and contributes to the market diversity.
Strategic Outlook for Anticoccidial Drugs Market
The Anticoccidial Drugs market is poised for continued growth, driven by rising demand for animal protein, the need for effective coccidiosis control, and technological advancements. Opportunities lie in developing natural alternatives, expanding into emerging markets, and focusing on sustainable practices. Companies that can adapt to evolving consumer preferences and regulatory landscapes are likely to succeed in this dynamic market. The focus on innovation and sustainable practices will shape the future of this sector.
Anticoccidial Drugs Industry Segmentation
-
1. Drug Class
- 1.1. Ionophore
- 1.2. Antibiotic
- 1.3. Sulphonamides
- 1.4. Chemical Derivative
- 1.5. Other Drug Classes
-
2. Drug Action
- 2.1. Coccidiostatic
- 2.2. Coccidiocidal
-
3. Animal
-
3.1. Livestock Animals
- 3.1.1. Cattle
- 3.1.2. Poultry
- 3.1.3. Other Livestock Animals
-
3.2. Companion Animals
- 3.2.1. Dogs
- 3.2.2. Cats
- 3.2.3. Other Companion Animals
-
3.1. Livestock Animals
-
4. Distribution Channel
- 4.1. Veterinary Hospitals
- 4.2. Retail Pharmacy
- 4.3. Other Distribution Channels
Anticoccidial Drugs Industry Segmentation By Geography
-
1. North America
- 1.1. United States
- 1.2. Canada
- 1.3. Mexico
-
2. Europe
- 2.1. Germany
- 2.2. United Kingdom
- 2.3. France
- 2.4. Italy
- 2.5. Spain
- 2.6. Rest of Europe
-
3. Asia Pacific
- 3.1. China
- 3.2. Japan
- 3.3. India
- 3.4. Australia
- 3.5. South Korea
- 3.6. Rest of Asia Pacific
- 4. Middle East
-
5. GCC
- 5.1. South Africa
- 5.2. Rest of Middle East and Africa
-
6. South America
- 6.1. Brazil
- 6.2. Argentina
- 6.3. Rest of South America
Anticoccidial Drugs Industry Regional Market Share
Geographic Coverage of Anticoccidial Drugs Industry
Anticoccidial Drugs Industry REPORT HIGHLIGHTS
| Aspects | Details |
|---|---|
| Study Period | 2020-2034 |
| Base Year | 2025 |
| Estimated Year | 2026 |
| Forecast Period | 2026-2034 |
| Historical Period | 2020-2025 |
| Growth Rate | CAGR of 5.56% from 2020-2034 |
| Segmentation |
|
Table of Contents
- 1. Introduction
- 1.1. Research Scope
- 1.2. Market Segmentation
- 1.3. Research Objective
- 1.4. Definitions and Assumptions
- 2. Executive Summary
- 2.1. Market Snapshot
- 3. Market Dynamics
- 3.1. Market Drivers
- 3.2. Market Restrains
- 3.3. Market Trends
- 3.4. Market Opportunities
- 4. Market Factor Analysis
- 4.1. Porters Five Forces
- 4.1.1. Bargaining Power of Suppliers
- 4.1.2. Bargaining Power of Buyers
- 4.1.3. Threat of New Entrants
- 4.1.4. Threat of Substitutes
- 4.1.5. Competitive Rivalry
- 4.2. PESTEL analysis
- 4.3. BCG Analysis
- 4.3.1. Stars (High Growth, High Market Share)
- 4.3.2. Cash Cows (Low Growth, High Market Share)
- 4.3.3. Question Mark (High Growth, Low Market Share)
- 4.3.4. Dogs (Low Growth, Low Market Share)
- 4.4. Ansoff Matrix Analysis
- 4.5. Supply Chain Analysis
- 4.6. Regulatory Landscape
- 4.7. Current Market Potential and Opportunity Assessment (TAM–SAM–SOM Framework)
- 4.8. RAX Analyst Note
- 4.1. Porters Five Forces
- 5. Market Analysis, Insights and Forecast 2021-2033
- 5.1. Market Analysis, Insights and Forecast - by Drug Class
- 5.1.1. Ionophore
- 5.1.2. Antibiotic
- 5.1.3. Sulphonamides
- 5.1.4. Chemical Derivative
- 5.1.5. Other Drug Classes
- 5.2. Market Analysis, Insights and Forecast - by Drug Action
- 5.2.1. Coccidiostatic
- 5.2.2. Coccidiocidal
- 5.3. Market Analysis, Insights and Forecast - by Animal
- 5.3.1. Livestock Animals
- 5.3.1.1. Cattle
- 5.3.1.2. Poultry
- 5.3.1.3. Other Livestock Animals
- 5.3.2. Companion Animals
- 5.3.2.1. Dogs
- 5.3.2.2. Cats
- 5.3.2.3. Other Companion Animals
- 5.3.1. Livestock Animals
- 5.4. Market Analysis, Insights and Forecast - by Distribution Channel
- 5.4.1. Veterinary Hospitals
- 5.4.2. Retail Pharmacy
- 5.4.3. Other Distribution Channels
- 5.5. Market Analysis, Insights and Forecast - by Region
- 5.5.1. North America
- 5.5.2. Europe
- 5.5.3. Asia Pacific
- 5.5.4. Middle East
- 5.5.5. GCC
- 5.5.6. South America
- 5.1. Market Analysis, Insights and Forecast - by Drug Class
- 6. Global Anticoccidial Drugs Industry Analysis, Insights and Forecast, 2021-2033
- 6.1. Market Analysis, Insights and Forecast - by Drug Class
- 6.1.1. Ionophore
- 6.1.2. Antibiotic
- 6.1.3. Sulphonamides
- 6.1.4. Chemical Derivative
- 6.1.5. Other Drug Classes
- 6.2. Market Analysis, Insights and Forecast - by Drug Action
- 6.2.1. Coccidiostatic
- 6.2.2. Coccidiocidal
- 6.3. Market Analysis, Insights and Forecast - by Animal
- 6.3.1. Livestock Animals
- 6.3.1.1. Cattle
- 6.3.1.2. Poultry
- 6.3.1.3. Other Livestock Animals
- 6.3.2. Companion Animals
- 6.3.2.1. Dogs
- 6.3.2.2. Cats
- 6.3.2.3. Other Companion Animals
- 6.3.1. Livestock Animals
- 6.4. Market Analysis, Insights and Forecast - by Distribution Channel
- 6.4.1. Veterinary Hospitals
- 6.4.2. Retail Pharmacy
- 6.4.3. Other Distribution Channels
- 6.1. Market Analysis, Insights and Forecast - by Drug Class
- 7. North America Anticoccidial Drugs Industry Analysis, Insights and Forecast, 2020-2032
- 7.1. Market Analysis, Insights and Forecast - by Drug Class
- 7.1.1. Ionophore
- 7.1.2. Antibiotic
- 7.1.3. Sulphonamides
- 7.1.4. Chemical Derivative
- 7.1.5. Other Drug Classes
- 7.2. Market Analysis, Insights and Forecast - by Drug Action
- 7.2.1. Coccidiostatic
- 7.2.2. Coccidiocidal
- 7.3. Market Analysis, Insights and Forecast - by Animal
- 7.3.1. Livestock Animals
- 7.3.1.1. Cattle
- 7.3.1.2. Poultry
- 7.3.1.3. Other Livestock Animals
- 7.3.2. Companion Animals
- 7.3.2.1. Dogs
- 7.3.2.2. Cats
- 7.3.2.3. Other Companion Animals
- 7.3.1. Livestock Animals
- 7.4. Market Analysis, Insights and Forecast - by Distribution Channel
- 7.4.1. Veterinary Hospitals
- 7.4.2. Retail Pharmacy
- 7.4.3. Other Distribution Channels
- 7.1. Market Analysis, Insights and Forecast - by Drug Class
- 8. Europe Anticoccidial Drugs Industry Analysis, Insights and Forecast, 2020-2032
- 8.1. Market Analysis, Insights and Forecast - by Drug Class
- 8.1.1. Ionophore
- 8.1.2. Antibiotic
- 8.1.3. Sulphonamides
- 8.1.4. Chemical Derivative
- 8.1.5. Other Drug Classes
- 8.2. Market Analysis, Insights and Forecast - by Drug Action
- 8.2.1. Coccidiostatic
- 8.2.2. Coccidiocidal
- 8.3. Market Analysis, Insights and Forecast - by Animal
- 8.3.1. Livestock Animals
- 8.3.1.1. Cattle
- 8.3.1.2. Poultry
- 8.3.1.3. Other Livestock Animals
- 8.3.2. Companion Animals
- 8.3.2.1. Dogs
- 8.3.2.2. Cats
- 8.3.2.3. Other Companion Animals
- 8.3.1. Livestock Animals
- 8.4. Market Analysis, Insights and Forecast - by Distribution Channel
- 8.4.1. Veterinary Hospitals
- 8.4.2. Retail Pharmacy
- 8.4.3. Other Distribution Channels
- 8.1. Market Analysis, Insights and Forecast - by Drug Class
- 9. Asia Pacific Anticoccidial Drugs Industry Analysis, Insights and Forecast, 2020-2032
- 9.1. Market Analysis, Insights and Forecast - by Drug Class
- 9.1.1. Ionophore
- 9.1.2. Antibiotic
- 9.1.3. Sulphonamides
- 9.1.4. Chemical Derivative
- 9.1.5. Other Drug Classes
- 9.2. Market Analysis, Insights and Forecast - by Drug Action
- 9.2.1. Coccidiostatic
- 9.2.2. Coccidiocidal
- 9.3. Market Analysis, Insights and Forecast - by Animal
- 9.3.1. Livestock Animals
- 9.3.1.1. Cattle
- 9.3.1.2. Poultry
- 9.3.1.3. Other Livestock Animals
- 9.3.2. Companion Animals
- 9.3.2.1. Dogs
- 9.3.2.2. Cats
- 9.3.2.3. Other Companion Animals
- 9.3.1. Livestock Animals
- 9.4. Market Analysis, Insights and Forecast - by Distribution Channel
- 9.4.1. Veterinary Hospitals
- 9.4.2. Retail Pharmacy
- 9.4.3. Other Distribution Channels
- 9.1. Market Analysis, Insights and Forecast - by Drug Class
- 10. Middle East Anticoccidial Drugs Industry Analysis, Insights and Forecast, 2020-2032
- 10.1. Market Analysis, Insights and Forecast - by Drug Class
- 10.1.1. Ionophore
- 10.1.2. Antibiotic
- 10.1.3. Sulphonamides
- 10.1.4. Chemical Derivative
- 10.1.5. Other Drug Classes
- 10.2. Market Analysis, Insights and Forecast - by Drug Action
- 10.2.1. Coccidiostatic
- 10.2.2. Coccidiocidal
- 10.3. Market Analysis, Insights and Forecast - by Animal
- 10.3.1. Livestock Animals
- 10.3.1.1. Cattle
- 10.3.1.2. Poultry
- 10.3.1.3. Other Livestock Animals
- 10.3.2. Companion Animals
- 10.3.2.1. Dogs
- 10.3.2.2. Cats
- 10.3.2.3. Other Companion Animals
- 10.3.1. Livestock Animals
- 10.4. Market Analysis, Insights and Forecast - by Distribution Channel
- 10.4.1. Veterinary Hospitals
- 10.4.2. Retail Pharmacy
- 10.4.3. Other Distribution Channels
- 10.1. Market Analysis, Insights and Forecast - by Drug Class
- 11. GCC Anticoccidial Drugs Industry Analysis, Insights and Forecast, 2020-2032
- 11.1. Market Analysis, Insights and Forecast - by Drug Class
- 11.1.1. Ionophore
- 11.1.2. Antibiotic
- 11.1.3. Sulphonamides
- 11.1.4. Chemical Derivative
- 11.1.5. Other Drug Classes
- 11.2. Market Analysis, Insights and Forecast - by Drug Action
- 11.2.1. Coccidiostatic
- 11.2.2. Coccidiocidal
- 11.3. Market Analysis, Insights and Forecast - by Animal
- 11.3.1. Livestock Animals
- 11.3.1.1. Cattle
- 11.3.1.2. Poultry
- 11.3.1.3. Other Livestock Animals
- 11.3.2. Companion Animals
- 11.3.2.1. Dogs
- 11.3.2.2. Cats
- 11.3.2.3. Other Companion Animals
- 11.3.1. Livestock Animals
- 11.4. Market Analysis, Insights and Forecast - by Distribution Channel
- 11.4.1. Veterinary Hospitals
- 11.4.2. Retail Pharmacy
- 11.4.3. Other Distribution Channels
- 11.1. Market Analysis, Insights and Forecast - by Drug Class
- 12. South America Anticoccidial Drugs Industry Analysis, Insights and Forecast, 2020-2032
- 12.1. Market Analysis, Insights and Forecast - by Drug Class
- 12.1.1. Ionophore
- 12.1.2. Antibiotic
- 12.1.3. Sulphonamides
- 12.1.4. Chemical Derivative
- 12.1.5. Other Drug Classes
- 12.2. Market Analysis, Insights and Forecast - by Drug Action
- 12.2.1. Coccidiostatic
- 12.2.2. Coccidiocidal
- 12.3. Market Analysis, Insights and Forecast - by Animal
- 12.3.1. Livestock Animals
- 12.3.1.1. Cattle
- 12.3.1.2. Poultry
- 12.3.1.3. Other Livestock Animals
- 12.3.2. Companion Animals
- 12.3.2.1. Dogs
- 12.3.2.2. Cats
- 12.3.2.3. Other Companion Animals
- 12.3.1. Livestock Animals
- 12.4. Market Analysis, Insights and Forecast - by Distribution Channel
- 12.4.1. Veterinary Hospitals
- 12.4.2. Retail Pharmacy
- 12.4.3. Other Distribution Channels
- 12.1. Market Analysis, Insights and Forecast - by Drug Class
- 13. Competitive Analysis
- 13.1. Company Profiles
- 13.1.1 Elanco
- 13.1.1.1. Company Overview
- 13.1.1.2. Products
- 13.1.1.3. Company Financials
- 13.1.1.4. SWOT Analysis
- 13.1.2 Boehringer Ingelheim International GmbH
- 13.1.2.1. Company Overview
- 13.1.2.2. Products
- 13.1.2.3. Company Financials
- 13.1.2.4. SWOT Analysis
- 13.1.3 Ceva
- 13.1.3.1. Company Overview
- 13.1.3.2. Products
- 13.1.3.3. Company Financials
- 13.1.3.4. SWOT Analysis
- 13.1.4 Zoetis
- 13.1.4.1. Company Overview
- 13.1.4.2. Products
- 13.1.4.3. Company Financials
- 13.1.4.4. SWOT Analysis
- 13.1.5 Biochem Pharma
- 13.1.5.1. Company Overview
- 13.1.5.2. Products
- 13.1.5.3. Company Financials
- 13.1.5.4. SWOT Analysis
- 13.1.6 Vetoquinol SA
- 13.1.6.1. Company Overview
- 13.1.6.2. Products
- 13.1.6.3. Company Financials
- 13.1.6.4. SWOT Analysis
- 13.1.7 HIPRA*List Not Exhaustive
- 13.1.7.1. Company Overview
- 13.1.7.2. Products
- 13.1.7.3. Company Financials
- 13.1.7.4. SWOT Analysis
- 13.1.8 Impextraco NV
- 13.1.8.1. Company Overview
- 13.1.8.2. Products
- 13.1.8.3. Company Financials
- 13.1.8.4. SWOT Analysis
- 13.1.9 MSD Animal Health
- 13.1.9.1. Company Overview
- 13.1.9.2. Products
- 13.1.9.3. Company Financials
- 13.1.9.4. SWOT Analysis
- 13.1.10 Phibro Animal Health Corporation
- 13.1.10.1. Company Overview
- 13.1.10.2. Products
- 13.1.10.3. Company Financials
- 13.1.10.4. SWOT Analysis
- 13.1.11 Virbac
- 13.1.11.1. Company Overview
- 13.1.11.2. Products
- 13.1.11.3. Company Financials
- 13.1.11.4. SWOT Analysis
- 13.1.12 Huvepharma
- 13.1.12.1. Company Overview
- 13.1.12.2. Products
- 13.1.12.3. Company Financials
- 13.1.12.4. SWOT Analysis
- 13.1.1 Elanco
- 13.2. Market Entropy
- 13.2.1 Company's Key Areas Served
- 13.2.2 Recent Developments
- 13.3. Company Market Share Analysis 2025
- 13.3.1 Top 5 Companies Market Share Analysis
- 13.3.2 Top 3 Companies Market Share Analysis
- 13.4. List of Potential Customers
- 14. Research Methodology
List of Figures
- Figure 1: Global Anticoccidial Drugs Industry Revenue Breakdown (Million, %) by Region 2025 & 2033
- Figure 2: Global Anticoccidial Drugs Industry Volume Breakdown (Dosage, %) by Region 2025 & 2033
- Figure 3: North America Anticoccidial Drugs Industry Revenue (Million), by Drug Class 2025 & 2033
- Figure 4: North America Anticoccidial Drugs Industry Volume (Dosage), by Drug Class 2025 & 2033
- Figure 5: North America Anticoccidial Drugs Industry Revenue Share (%), by Drug Class 2025 & 2033
- Figure 6: North America Anticoccidial Drugs Industry Volume Share (%), by Drug Class 2025 & 2033
- Figure 7: North America Anticoccidial Drugs Industry Revenue (Million), by Drug Action 2025 & 2033
- Figure 8: North America Anticoccidial Drugs Industry Volume (Dosage), by Drug Action 2025 & 2033
- Figure 9: North America Anticoccidial Drugs Industry Revenue Share (%), by Drug Action 2025 & 2033
- Figure 10: North America Anticoccidial Drugs Industry Volume Share (%), by Drug Action 2025 & 2033
- Figure 11: North America Anticoccidial Drugs Industry Revenue (Million), by Animal 2025 & 2033
- Figure 12: North America Anticoccidial Drugs Industry Volume (Dosage), by Animal 2025 & 2033
- Figure 13: North America Anticoccidial Drugs Industry Revenue Share (%), by Animal 2025 & 2033
- Figure 14: North America Anticoccidial Drugs Industry Volume Share (%), by Animal 2025 & 2033
- Figure 15: North America Anticoccidial Drugs Industry Revenue (Million), by Distribution Channel 2025 & 2033
- Figure 16: North America Anticoccidial Drugs Industry Volume (Dosage), by Distribution Channel 2025 & 2033
- Figure 17: North America Anticoccidial Drugs Industry Revenue Share (%), by Distribution Channel 2025 & 2033
- Figure 18: North America Anticoccidial Drugs Industry Volume Share (%), by Distribution Channel 2025 & 2033
- Figure 19: North America Anticoccidial Drugs Industry Revenue (Million), by Country 2025 & 2033
- Figure 20: North America Anticoccidial Drugs Industry Volume (Dosage), by Country 2025 & 2033
- Figure 21: North America Anticoccidial Drugs Industry Revenue Share (%), by Country 2025 & 2033
- Figure 22: North America Anticoccidial Drugs Industry Volume Share (%), by Country 2025 & 2033
- Figure 23: Europe Anticoccidial Drugs Industry Revenue (Million), by Drug Class 2025 & 2033
- Figure 24: Europe Anticoccidial Drugs Industry Volume (Dosage), by Drug Class 2025 & 2033
- Figure 25: Europe Anticoccidial Drugs Industry Revenue Share (%), by Drug Class 2025 & 2033
- Figure 26: Europe Anticoccidial Drugs Industry Volume Share (%), by Drug Class 2025 & 2033
- Figure 27: Europe Anticoccidial Drugs Industry Revenue (Million), by Drug Action 2025 & 2033
- Figure 28: Europe Anticoccidial Drugs Industry Volume (Dosage), by Drug Action 2025 & 2033
- Figure 29: Europe Anticoccidial Drugs Industry Revenue Share (%), by Drug Action 2025 & 2033
- Figure 30: Europe Anticoccidial Drugs Industry Volume Share (%), by Drug Action 2025 & 2033
- Figure 31: Europe Anticoccidial Drugs Industry Revenue (Million), by Animal 2025 & 2033
- Figure 32: Europe Anticoccidial Drugs Industry Volume (Dosage), by Animal 2025 & 2033
- Figure 33: Europe Anticoccidial Drugs Industry Revenue Share (%), by Animal 2025 & 2033
- Figure 34: Europe Anticoccidial Drugs Industry Volume Share (%), by Animal 2025 & 2033
- Figure 35: Europe Anticoccidial Drugs Industry Revenue (Million), by Distribution Channel 2025 & 2033
- Figure 36: Europe Anticoccidial Drugs Industry Volume (Dosage), by Distribution Channel 2025 & 2033
- Figure 37: Europe Anticoccidial Drugs Industry Revenue Share (%), by Distribution Channel 2025 & 2033
- Figure 38: Europe Anticoccidial Drugs Industry Volume Share (%), by Distribution Channel 2025 & 2033
- Figure 39: Europe Anticoccidial Drugs Industry Revenue (Million), by Country 2025 & 2033
- Figure 40: Europe Anticoccidial Drugs Industry Volume (Dosage), by Country 2025 & 2033
- Figure 41: Europe Anticoccidial Drugs Industry Revenue Share (%), by Country 2025 & 2033
- Figure 42: Europe Anticoccidial Drugs Industry Volume Share (%), by Country 2025 & 2033
- Figure 43: Asia Pacific Anticoccidial Drugs Industry Revenue (Million), by Drug Class 2025 & 2033
- Figure 44: Asia Pacific Anticoccidial Drugs Industry Volume (Dosage), by Drug Class 2025 & 2033
- Figure 45: Asia Pacific Anticoccidial Drugs Industry Revenue Share (%), by Drug Class 2025 & 2033
- Figure 46: Asia Pacific Anticoccidial Drugs Industry Volume Share (%), by Drug Class 2025 & 2033
- Figure 47: Asia Pacific Anticoccidial Drugs Industry Revenue (Million), by Drug Action 2025 & 2033
- Figure 48: Asia Pacific Anticoccidial Drugs Industry Volume (Dosage), by Drug Action 2025 & 2033
- Figure 49: Asia Pacific Anticoccidial Drugs Industry Revenue Share (%), by Drug Action 2025 & 2033
- Figure 50: Asia Pacific Anticoccidial Drugs Industry Volume Share (%), by Drug Action 2025 & 2033
- Figure 51: Asia Pacific Anticoccidial Drugs Industry Revenue (Million), by Animal 2025 & 2033
- Figure 52: Asia Pacific Anticoccidial Drugs Industry Volume (Dosage), by Animal 2025 & 2033
- Figure 53: Asia Pacific Anticoccidial Drugs Industry Revenue Share (%), by Animal 2025 & 2033
- Figure 54: Asia Pacific Anticoccidial Drugs Industry Volume Share (%), by Animal 2025 & 2033
- Figure 55: Asia Pacific Anticoccidial Drugs Industry Revenue (Million), by Distribution Channel 2025 & 2033
- Figure 56: Asia Pacific Anticoccidial Drugs Industry Volume (Dosage), by Distribution Channel 2025 & 2033
- Figure 57: Asia Pacific Anticoccidial Drugs Industry Revenue Share (%), by Distribution Channel 2025 & 2033
- Figure 58: Asia Pacific Anticoccidial Drugs Industry Volume Share (%), by Distribution Channel 2025 & 2033
- Figure 59: Asia Pacific Anticoccidial Drugs Industry Revenue (Million), by Country 2025 & 2033
- Figure 60: Asia Pacific Anticoccidial Drugs Industry Volume (Dosage), by Country 2025 & 2033
- Figure 61: Asia Pacific Anticoccidial Drugs Industry Revenue Share (%), by Country 2025 & 2033
- Figure 62: Asia Pacific Anticoccidial Drugs Industry Volume Share (%), by Country 2025 & 2033
- Figure 63: Middle East Anticoccidial Drugs Industry Revenue (Million), by Drug Class 2025 & 2033
- Figure 64: Middle East Anticoccidial Drugs Industry Volume (Dosage), by Drug Class 2025 & 2033
- Figure 65: Middle East Anticoccidial Drugs Industry Revenue Share (%), by Drug Class 2025 & 2033
- Figure 66: Middle East Anticoccidial Drugs Industry Volume Share (%), by Drug Class 2025 & 2033
- Figure 67: Middle East Anticoccidial Drugs Industry Revenue (Million), by Drug Action 2025 & 2033
- Figure 68: Middle East Anticoccidial Drugs Industry Volume (Dosage), by Drug Action 2025 & 2033
- Figure 69: Middle East Anticoccidial Drugs Industry Revenue Share (%), by Drug Action 2025 & 2033
- Figure 70: Middle East Anticoccidial Drugs Industry Volume Share (%), by Drug Action 2025 & 2033
- Figure 71: Middle East Anticoccidial Drugs Industry Revenue (Million), by Animal 2025 & 2033
- Figure 72: Middle East Anticoccidial Drugs Industry Volume (Dosage), by Animal 2025 & 2033
- Figure 73: Middle East Anticoccidial Drugs Industry Revenue Share (%), by Animal 2025 & 2033
- Figure 74: Middle East Anticoccidial Drugs Industry Volume Share (%), by Animal 2025 & 2033
- Figure 75: Middle East Anticoccidial Drugs Industry Revenue (Million), by Distribution Channel 2025 & 2033
- Figure 76: Middle East Anticoccidial Drugs Industry Volume (Dosage), by Distribution Channel 2025 & 2033
- Figure 77: Middle East Anticoccidial Drugs Industry Revenue Share (%), by Distribution Channel 2025 & 2033
- Figure 78: Middle East Anticoccidial Drugs Industry Volume Share (%), by Distribution Channel 2025 & 2033
- Figure 79: Middle East Anticoccidial Drugs Industry Revenue (Million), by Country 2025 & 2033
- Figure 80: Middle East Anticoccidial Drugs Industry Volume (Dosage), by Country 2025 & 2033
- Figure 81: Middle East Anticoccidial Drugs Industry Revenue Share (%), by Country 2025 & 2033
- Figure 82: Middle East Anticoccidial Drugs Industry Volume Share (%), by Country 2025 & 2033
- Figure 83: GCC Anticoccidial Drugs Industry Revenue (Million), by Drug Class 2025 & 2033
- Figure 84: GCC Anticoccidial Drugs Industry Volume (Dosage), by Drug Class 2025 & 2033
- Figure 85: GCC Anticoccidial Drugs Industry Revenue Share (%), by Drug Class 2025 & 2033
- Figure 86: GCC Anticoccidial Drugs Industry Volume Share (%), by Drug Class 2025 & 2033
- Figure 87: GCC Anticoccidial Drugs Industry Revenue (Million), by Drug Action 2025 & 2033
- Figure 88: GCC Anticoccidial Drugs Industry Volume (Dosage), by Drug Action 2025 & 2033
- Figure 89: GCC Anticoccidial Drugs Industry Revenue Share (%), by Drug Action 2025 & 2033
- Figure 90: GCC Anticoccidial Drugs Industry Volume Share (%), by Drug Action 2025 & 2033
- Figure 91: GCC Anticoccidial Drugs Industry Revenue (Million), by Animal 2025 & 2033
- Figure 92: GCC Anticoccidial Drugs Industry Volume (Dosage), by Animal 2025 & 2033
- Figure 93: GCC Anticoccidial Drugs Industry Revenue Share (%), by Animal 2025 & 2033
- Figure 94: GCC Anticoccidial Drugs Industry Volume Share (%), by Animal 2025 & 2033
- Figure 95: GCC Anticoccidial Drugs Industry Revenue (Million), by Distribution Channel 2025 & 2033
- Figure 96: GCC Anticoccidial Drugs Industry Volume (Dosage), by Distribution Channel 2025 & 2033
- Figure 97: GCC Anticoccidial Drugs Industry Revenue Share (%), by Distribution Channel 2025 & 2033
- Figure 98: GCC Anticoccidial Drugs Industry Volume Share (%), by Distribution Channel 2025 & 2033
- Figure 99: GCC Anticoccidial Drugs Industry Revenue (Million), by Country 2025 & 2033
- Figure 100: GCC Anticoccidial Drugs Industry Volume (Dosage), by Country 2025 & 2033
- Figure 101: GCC Anticoccidial Drugs Industry Revenue Share (%), by Country 2025 & 2033
- Figure 102: GCC Anticoccidial Drugs Industry Volume Share (%), by Country 2025 & 2033
- Figure 103: South America Anticoccidial Drugs Industry Revenue (Million), by Drug Class 2025 & 2033
- Figure 104: South America Anticoccidial Drugs Industry Volume (Dosage), by Drug Class 2025 & 2033
- Figure 105: South America Anticoccidial Drugs Industry Revenue Share (%), by Drug Class 2025 & 2033
- Figure 106: South America Anticoccidial Drugs Industry Volume Share (%), by Drug Class 2025 & 2033
- Figure 107: South America Anticoccidial Drugs Industry Revenue (Million), by Drug Action 2025 & 2033
- Figure 108: South America Anticoccidial Drugs Industry Volume (Dosage), by Drug Action 2025 & 2033
- Figure 109: South America Anticoccidial Drugs Industry Revenue Share (%), by Drug Action 2025 & 2033
- Figure 110: South America Anticoccidial Drugs Industry Volume Share (%), by Drug Action 2025 & 2033
- Figure 111: South America Anticoccidial Drugs Industry Revenue (Million), by Animal 2025 & 2033
- Figure 112: South America Anticoccidial Drugs Industry Volume (Dosage), by Animal 2025 & 2033
- Figure 113: South America Anticoccidial Drugs Industry Revenue Share (%), by Animal 2025 & 2033
- Figure 114: South America Anticoccidial Drugs Industry Volume Share (%), by Animal 2025 & 2033
- Figure 115: South America Anticoccidial Drugs Industry Revenue (Million), by Distribution Channel 2025 & 2033
- Figure 116: South America Anticoccidial Drugs Industry Volume (Dosage), by Distribution Channel 2025 & 2033
- Figure 117: South America Anticoccidial Drugs Industry Revenue Share (%), by Distribution Channel 2025 & 2033
- Figure 118: South America Anticoccidial Drugs Industry Volume Share (%), by Distribution Channel 2025 & 2033
- Figure 119: South America Anticoccidial Drugs Industry Revenue (Million), by Country 2025 & 2033
- Figure 120: South America Anticoccidial Drugs Industry Volume (Dosage), by Country 2025 & 2033
- Figure 121: South America Anticoccidial Drugs Industry Revenue Share (%), by Country 2025 & 2033
- Figure 122: South America Anticoccidial Drugs Industry Volume Share (%), by Country 2025 & 2033
List of Tables
- Table 1: Global Anticoccidial Drugs Industry Revenue Million Forecast, by Drug Class 2020 & 2033
- Table 2: Global Anticoccidial Drugs Industry Volume Dosage Forecast, by Drug Class 2020 & 2033
- Table 3: Global Anticoccidial Drugs Industry Revenue Million Forecast, by Drug Action 2020 & 2033
- Table 4: Global Anticoccidial Drugs Industry Volume Dosage Forecast, by Drug Action 2020 & 2033
- Table 5: Global Anticoccidial Drugs Industry Revenue Million Forecast, by Animal 2020 & 2033
- Table 6: Global Anticoccidial Drugs Industry Volume Dosage Forecast, by Animal 2020 & 2033
- Table 7: Global Anticoccidial Drugs Industry Revenue Million Forecast, by Distribution Channel 2020 & 2033
- Table 8: Global Anticoccidial Drugs Industry Volume Dosage Forecast, by Distribution Channel 2020 & 2033
- Table 9: Global Anticoccidial Drugs Industry Revenue Million Forecast, by Region 2020 & 2033
- Table 10: Global Anticoccidial Drugs Industry Volume Dosage Forecast, by Region 2020 & 2033
- Table 11: Global Anticoccidial Drugs Industry Revenue Million Forecast, by Drug Class 2020 & 2033
- Table 12: Global Anticoccidial Drugs Industry Volume Dosage Forecast, by Drug Class 2020 & 2033
- Table 13: Global Anticoccidial Drugs Industry Revenue Million Forecast, by Drug Action 2020 & 2033
- Table 14: Global Anticoccidial Drugs Industry Volume Dosage Forecast, by Drug Action 2020 & 2033
- Table 15: Global Anticoccidial Drugs Industry Revenue Million Forecast, by Animal 2020 & 2033
- Table 16: Global Anticoccidial Drugs Industry Volume Dosage Forecast, by Animal 2020 & 2033
- Table 17: Global Anticoccidial Drugs Industry Revenue Million Forecast, by Distribution Channel 2020 & 2033
- Table 18: Global Anticoccidial Drugs Industry Volume Dosage Forecast, by Distribution Channel 2020 & 2033
- Table 19: Global Anticoccidial Drugs Industry Revenue Million Forecast, by Country 2020 & 2033
- Table 20: Global Anticoccidial Drugs Industry Volume Dosage Forecast, by Country 2020 & 2033
- Table 21: United States Anticoccidial Drugs Industry Revenue (Million) Forecast, by Application 2020 & 2033
- Table 22: United States Anticoccidial Drugs Industry Volume (Dosage) Forecast, by Application 2020 & 2033
- Table 23: Canada Anticoccidial Drugs Industry Revenue (Million) Forecast, by Application 2020 & 2033
- Table 24: Canada Anticoccidial Drugs Industry Volume (Dosage) Forecast, by Application 2020 & 2033
- Table 25: Mexico Anticoccidial Drugs Industry Revenue (Million) Forecast, by Application 2020 & 2033
- Table 26: Mexico Anticoccidial Drugs Industry Volume (Dosage) Forecast, by Application 2020 & 2033
- Table 27: Global Anticoccidial Drugs Industry Revenue Million Forecast, by Drug Class 2020 & 2033
- Table 28: Global Anticoccidial Drugs Industry Volume Dosage Forecast, by Drug Class 2020 & 2033
- Table 29: Global Anticoccidial Drugs Industry Revenue Million Forecast, by Drug Action 2020 & 2033
- Table 30: Global Anticoccidial Drugs Industry Volume Dosage Forecast, by Drug Action 2020 & 2033
- Table 31: Global Anticoccidial Drugs Industry Revenue Million Forecast, by Animal 2020 & 2033
- Table 32: Global Anticoccidial Drugs Industry Volume Dosage Forecast, by Animal 2020 & 2033
- Table 33: Global Anticoccidial Drugs Industry Revenue Million Forecast, by Distribution Channel 2020 & 2033
- Table 34: Global Anticoccidial Drugs Industry Volume Dosage Forecast, by Distribution Channel 2020 & 2033
- Table 35: Global Anticoccidial Drugs Industry Revenue Million Forecast, by Country 2020 & 2033
- Table 36: Global Anticoccidial Drugs Industry Volume Dosage Forecast, by Country 2020 & 2033
- Table 37: Germany Anticoccidial Drugs Industry Revenue (Million) Forecast, by Application 2020 & 2033
- Table 38: Germany Anticoccidial Drugs Industry Volume (Dosage) Forecast, by Application 2020 & 2033
- Table 39: United Kingdom Anticoccidial Drugs Industry Revenue (Million) Forecast, by Application 2020 & 2033
- Table 40: United Kingdom Anticoccidial Drugs Industry Volume (Dosage) Forecast, by Application 2020 & 2033
- Table 41: France Anticoccidial Drugs Industry Revenue (Million) Forecast, by Application 2020 & 2033
- Table 42: France Anticoccidial Drugs Industry Volume (Dosage) Forecast, by Application 2020 & 2033
- Table 43: Italy Anticoccidial Drugs Industry Revenue (Million) Forecast, by Application 2020 & 2033
- Table 44: Italy Anticoccidial Drugs Industry Volume (Dosage) Forecast, by Application 2020 & 2033
- Table 45: Spain Anticoccidial Drugs Industry Revenue (Million) Forecast, by Application 2020 & 2033
- Table 46: Spain Anticoccidial Drugs Industry Volume (Dosage) Forecast, by Application 2020 & 2033
- Table 47: Rest of Europe Anticoccidial Drugs Industry Revenue (Million) Forecast, by Application 2020 & 2033
- Table 48: Rest of Europe Anticoccidial Drugs Industry Volume (Dosage) Forecast, by Application 2020 & 2033
- Table 49: Global Anticoccidial Drugs Industry Revenue Million Forecast, by Drug Class 2020 & 2033
- Table 50: Global Anticoccidial Drugs Industry Volume Dosage Forecast, by Drug Class 2020 & 2033
- Table 51: Global Anticoccidial Drugs Industry Revenue Million Forecast, by Drug Action 2020 & 2033
- Table 52: Global Anticoccidial Drugs Industry Volume Dosage Forecast, by Drug Action 2020 & 2033
- Table 53: Global Anticoccidial Drugs Industry Revenue Million Forecast, by Animal 2020 & 2033
- Table 54: Global Anticoccidial Drugs Industry Volume Dosage Forecast, by Animal 2020 & 2033
- Table 55: Global Anticoccidial Drugs Industry Revenue Million Forecast, by Distribution Channel 2020 & 2033
- Table 56: Global Anticoccidial Drugs Industry Volume Dosage Forecast, by Distribution Channel 2020 & 2033
- Table 57: Global Anticoccidial Drugs Industry Revenue Million Forecast, by Country 2020 & 2033
- Table 58: Global Anticoccidial Drugs Industry Volume Dosage Forecast, by Country 2020 & 2033
- Table 59: China Anticoccidial Drugs Industry Revenue (Million) Forecast, by Application 2020 & 2033
- Table 60: China Anticoccidial Drugs Industry Volume (Dosage) Forecast, by Application 2020 & 2033
- Table 61: Japan Anticoccidial Drugs Industry Revenue (Million) Forecast, by Application 2020 & 2033
- Table 62: Japan Anticoccidial Drugs Industry Volume (Dosage) Forecast, by Application 2020 & 2033
- Table 63: India Anticoccidial Drugs Industry Revenue (Million) Forecast, by Application 2020 & 2033
- Table 64: India Anticoccidial Drugs Industry Volume (Dosage) Forecast, by Application 2020 & 2033
- Table 65: Australia Anticoccidial Drugs Industry Revenue (Million) Forecast, by Application 2020 & 2033
- Table 66: Australia Anticoccidial Drugs Industry Volume (Dosage) Forecast, by Application 2020 & 2033
- Table 67: South Korea Anticoccidial Drugs Industry Revenue (Million) Forecast, by Application 2020 & 2033
- Table 68: South Korea Anticoccidial Drugs Industry Volume (Dosage) Forecast, by Application 2020 & 2033
- Table 69: Rest of Asia Pacific Anticoccidial Drugs Industry Revenue (Million) Forecast, by Application 2020 & 2033
- Table 70: Rest of Asia Pacific Anticoccidial Drugs Industry Volume (Dosage) Forecast, by Application 2020 & 2033
- Table 71: Global Anticoccidial Drugs Industry Revenue Million Forecast, by Drug Class 2020 & 2033
- Table 72: Global Anticoccidial Drugs Industry Volume Dosage Forecast, by Drug Class 2020 & 2033
- Table 73: Global Anticoccidial Drugs Industry Revenue Million Forecast, by Drug Action 2020 & 2033
- Table 74: Global Anticoccidial Drugs Industry Volume Dosage Forecast, by Drug Action 2020 & 2033
- Table 75: Global Anticoccidial Drugs Industry Revenue Million Forecast, by Animal 2020 & 2033
- Table 76: Global Anticoccidial Drugs Industry Volume Dosage Forecast, by Animal 2020 & 2033
- Table 77: Global Anticoccidial Drugs Industry Revenue Million Forecast, by Distribution Channel 2020 & 2033
- Table 78: Global Anticoccidial Drugs Industry Volume Dosage Forecast, by Distribution Channel 2020 & 2033
- Table 79: Global Anticoccidial Drugs Industry Revenue Million Forecast, by Country 2020 & 2033
- Table 80: Global Anticoccidial Drugs Industry Volume Dosage Forecast, by Country 2020 & 2033
- Table 81: Global Anticoccidial Drugs Industry Revenue Million Forecast, by Drug Class 2020 & 2033
- Table 82: Global Anticoccidial Drugs Industry Volume Dosage Forecast, by Drug Class 2020 & 2033
- Table 83: Global Anticoccidial Drugs Industry Revenue Million Forecast, by Drug Action 2020 & 2033
- Table 84: Global Anticoccidial Drugs Industry Volume Dosage Forecast, by Drug Action 2020 & 2033
- Table 85: Global Anticoccidial Drugs Industry Revenue Million Forecast, by Animal 2020 & 2033
- Table 86: Global Anticoccidial Drugs Industry Volume Dosage Forecast, by Animal 2020 & 2033
- Table 87: Global Anticoccidial Drugs Industry Revenue Million Forecast, by Distribution Channel 2020 & 2033
- Table 88: Global Anticoccidial Drugs Industry Volume Dosage Forecast, by Distribution Channel 2020 & 2033
- Table 89: Global Anticoccidial Drugs Industry Revenue Million Forecast, by Country 2020 & 2033
- Table 90: Global Anticoccidial Drugs Industry Volume Dosage Forecast, by Country 2020 & 2033
- Table 91: South Africa Anticoccidial Drugs Industry Revenue (Million) Forecast, by Application 2020 & 2033
- Table 92: South Africa Anticoccidial Drugs Industry Volume (Dosage) Forecast, by Application 2020 & 2033
- Table 93: Rest of Middle East and Africa Anticoccidial Drugs Industry Revenue (Million) Forecast, by Application 2020 & 2033
- Table 94: Rest of Middle East and Africa Anticoccidial Drugs Industry Volume (Dosage) Forecast, by Application 2020 & 2033
- Table 95: Global Anticoccidial Drugs Industry Revenue Million Forecast, by Drug Class 2020 & 2033
- Table 96: Global Anticoccidial Drugs Industry Volume Dosage Forecast, by Drug Class 2020 & 2033
- Table 97: Global Anticoccidial Drugs Industry Revenue Million Forecast, by Drug Action 2020 & 2033
- Table 98: Global Anticoccidial Drugs Industry Volume Dosage Forecast, by Drug Action 2020 & 2033
- Table 99: Global Anticoccidial Drugs Industry Revenue Million Forecast, by Animal 2020 & 2033
- Table 100: Global Anticoccidial Drugs Industry Volume Dosage Forecast, by Animal 2020 & 2033
- Table 101: Global Anticoccidial Drugs Industry Revenue Million Forecast, by Distribution Channel 2020 & 2033
- Table 102: Global Anticoccidial Drugs Industry Volume Dosage Forecast, by Distribution Channel 2020 & 2033
- Table 103: Global Anticoccidial Drugs Industry Revenue Million Forecast, by Country 2020 & 2033
- Table 104: Global Anticoccidial Drugs Industry Volume Dosage Forecast, by Country 2020 & 2033
- Table 105: Brazil Anticoccidial Drugs Industry Revenue (Million) Forecast, by Application 2020 & 2033
- Table 106: Brazil Anticoccidial Drugs Industry Volume (Dosage) Forecast, by Application 2020 & 2033
- Table 107: Argentina Anticoccidial Drugs Industry Revenue (Million) Forecast, by Application 2020 & 2033
- Table 108: Argentina Anticoccidial Drugs Industry Volume (Dosage) Forecast, by Application 2020 & 2033
- Table 109: Rest of South America Anticoccidial Drugs Industry Revenue (Million) Forecast, by Application 2020 & 2033
- Table 110: Rest of South America Anticoccidial Drugs Industry Volume (Dosage) Forecast, by Application 2020 & 2033
Frequently Asked Questions
1. What is the projected Compound Annual Growth Rate (CAGR) of the Anticoccidial Drugs Industry?
The projected CAGR is approximately 5.56%.
2. Which companies are prominent players in the Anticoccidial Drugs Industry?
Key companies in the market include Elanco, Boehringer Ingelheim International GmbH, Ceva, Zoetis, Biochem Pharma, Vetoquinol SA, HIPRA*List Not Exhaustive, Impextraco NV, MSD Animal Health, Phibro Animal Health Corporation, Virbac, Huvepharma.
3. What are the main segments of the Anticoccidial Drugs Industry?
The market segments include Drug Class, Drug Action, Animal, Distribution Channel.
4. Can you provide details about the market size?
The market size is estimated to be USD 1.56 Million as of 2022.
5. What are some drivers contributing to market growth?
Increased Incidence of Coccidiosis Globally; Advancements in Veterinary Healthcare.
6. What are the notable trends driving market growth?
Companion Animal Segment is Anticipated to Witness Growth Over the Forecast Period.
7. Are there any restraints impacting market growth?
Availability of Alternative Treatment Options in the Market.
8. Can you provide examples of recent developments in the market?
In August 2022, ZIVO Bioscience, Inc., a biotech/agtech R&D company, received a letter from the United States Department of Agriculture's (USDA) Center for Veterinary Biologics (CVB) affirming that the agency has claimed jurisdiction to review the company's novel immune-modulating biologic for treating coccidiosis in broiler chickens.
9. What pricing options are available for accessing the report?
Pricing options include single-user, multi-user, and enterprise licenses priced at USD 4750, USD 5250, and USD 8750 respectively.
10. Is the market size provided in terms of value or volume?
The market size is provided in terms of value, measured in Million and volume, measured in Dosage.
11. Are there any specific market keywords associated with the report?
Yes, the market keyword associated with the report is "Anticoccidial Drugs Industry," which aids in identifying and referencing the specific market segment covered.
12. How do I determine which pricing option suits my needs best?
The pricing options vary based on user requirements and access needs. Individual users may opt for single-user licenses, while businesses requiring broader access may choose multi-user or enterprise licenses for cost-effective access to the report.
13. Are there any additional resources or data provided in the Anticoccidial Drugs Industry report?
While the report offers comprehensive insights, it's advisable to review the specific contents or supplementary materials provided to ascertain if additional resources or data are available.
14. How can I stay updated on further developments or reports in the Anticoccidial Drugs Industry?
To stay informed about further developments, trends, and reports in the Anticoccidial Drugs Industry, consider subscribing to industry newsletters, following relevant companies and organizations, or regularly checking reputable industry news sources and publications.
Methodology
Step 1 - Identification of Relevant Samples Size from Population Database


Step 2 - Approaches for Defining Global Market Size (Value, Volume* & Price*)

Note*: In applicable scenarios
Step 3 - Data Sources
Primary Research
- Web Analytics
- Survey Reports
- Research Institute
- Latest Research Reports
- Opinion Leaders
Secondary Research
- Annual Reports
- White Paper
- Latest Press Release
- Industry Association
- Paid Database
- Investor Presentations

Step 4 - Data Triangulation
Involves using different sources of information in order to increase the validity of a study
These sources are likely to be stakeholders in a program - participants, other researchers, program staff, other community members, and so on.
Then we put all data in single framework & apply various statistical tools to find out the dynamic on the market.
During the analysis stage, feedback from the stakeholder groups would be compared to determine areas of agreement as well as areas of divergence