
Key Insights
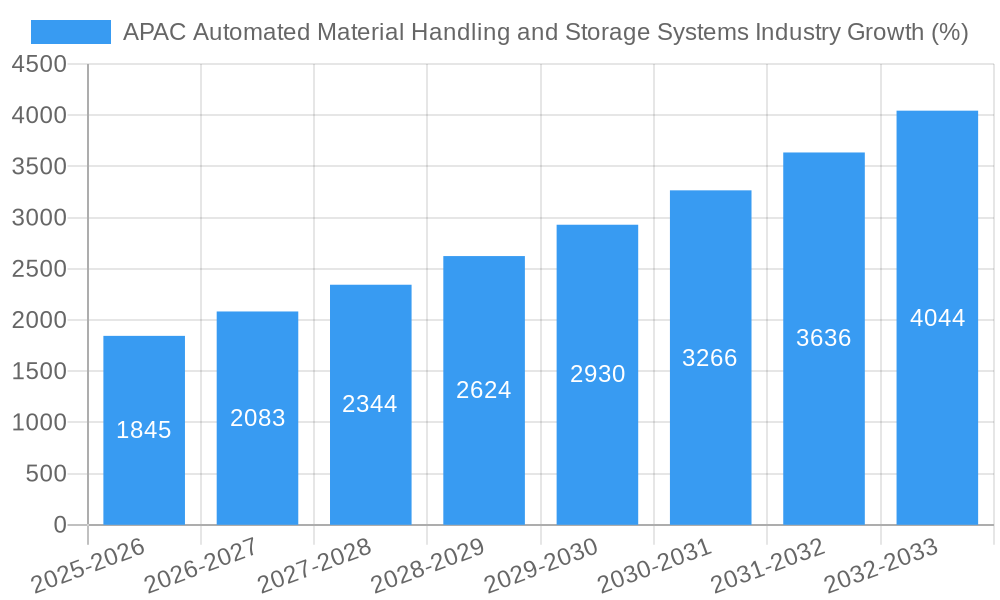
The Asia-Pacific (APAC) automated material handling and storage systems market is experiencing robust growth, driven by the region's expanding e-commerce sector, rising labor costs, and increasing demand for efficient supply chain solutions. A Compound Annual Growth Rate (CAGR) of 12.30% from 2019 to 2024 indicates a significant upward trajectory. Key segments fueling this expansion include automated guided vehicles (AGVs), particularly automated forklifts and unit load systems, which are increasingly adopted in warehouses and distribution centers across countries like China, India, and Japan. The rising popularity of autonomous mobile robots (AMRs), especially in automated storage and retrieval systems (ASRS), further contributes to market expansion. Growth is further propelled by the adoption of advanced technologies like AI and machine learning for improved efficiency and optimization within logistics and manufacturing sectors. Several countries within APAC, including China, India, and South Korea, are investing heavily in infrastructure development and modernization, creating significant opportunities for automated material handling solutions. The automotive, food and beverage, and e-commerce industries are major end-users, driving demand for sophisticated systems like palletizers and automated conveyor systems. While factors such as high initial investment costs and the need for skilled labor can present restraints, the long-term benefits of improved efficiency, reduced operational costs, and enhanced productivity outweigh these challenges, ensuring sustained growth for the foreseeable future.
The market's growth is unevenly distributed across APAC, with China and Japan leading the charge due to their advanced manufacturing sectors and well-established logistics networks. However, countries like India and Indonesia are emerging as significant markets with high growth potential, driven by rapid industrialization and urbanization. The preference for advanced technologies and the increasing adoption of Industry 4.0 principles across various sectors further bolster market prospects. The competitive landscape is dynamic, with both global giants and regional players vying for market share. Strategic partnerships, mergers, and acquisitions are common strategies adopted to gain a competitive edge. The forecast period (2025-2033) promises sustained growth, with continuous technological innovation and expansion into new applications further solidifying the APAC region’s position as a key market for automated material handling and storage systems. The market is expected to show a consistent upward trend, driven by the aforementioned factors and a continuously evolving technological landscape.
This comprehensive report provides an in-depth analysis of the Asia-Pacific (APAC) Automated Material Handling and Storage Systems market, offering valuable insights for industry stakeholders, investors, and businesses seeking to navigate this dynamic landscape. The report covers the period 2019-2033, with a focus on the 2025-2033 forecast period. The base year for the report is 2025. Market sizes are expressed in Millions.
APAC Automated Material Handling and Storage Systems Industry Market Concentration & Innovation
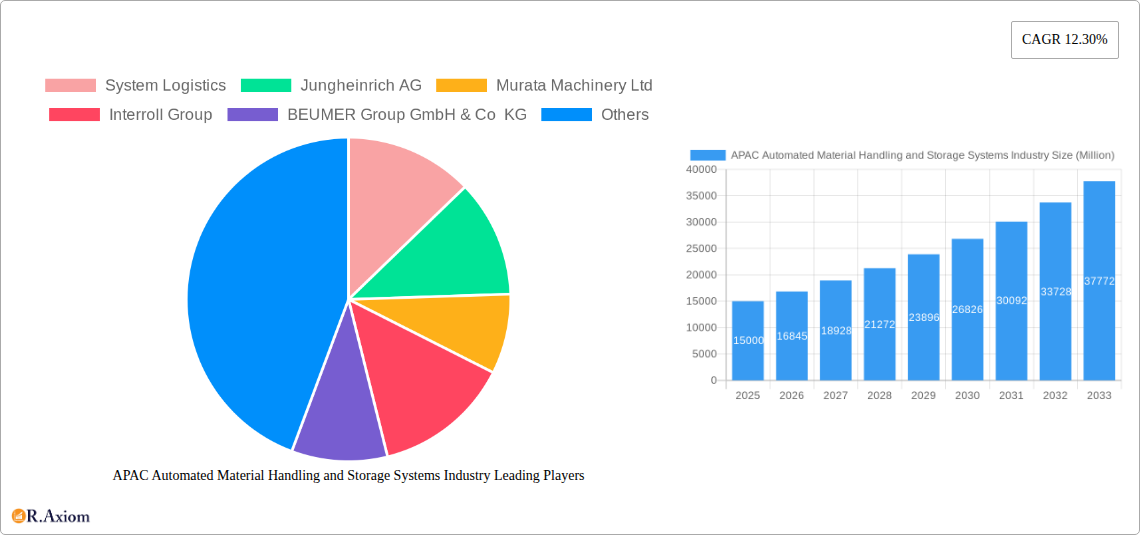
The APAC automated material handling and storage systems market exhibits a moderately concentrated landscape, with several key players holding significant market share. Companies like Daifuku Co Ltd, KION Group, and Jungheinrich AG are prominent examples. However, the market also features numerous smaller, specialized firms, particularly in the burgeoning robotics and software segments. Market share data for 2024 indicates Daifuku holds approximately 15%, KION Group holds around 12%, and Jungheinrich holds about 10%, while the remaining market share is distributed across other players and smaller niche businesses. The total market size in 2024 was estimated at $xx Million.
Innovation is a key driver, propelled by advancements in robotics, artificial intelligence (AI), and the Internet of Things (IoT). These technologies are enabling the development of more sophisticated and efficient automated systems. Furthermore, the increasing adoption of Industry 4.0 principles within manufacturing and logistics is fueling demand for advanced automation solutions.
Regulatory frameworks, including those related to safety and data privacy, influence market dynamics. The rise of e-commerce and the resulting need for faster and more efficient order fulfillment is also significantly impacting the market. Product substitutes, such as traditional manual handling methods, are gradually losing ground due to automation's cost and efficiency benefits. However, initial investment costs remain a barrier for some smaller companies.
Mergers and acquisitions (M&A) activity has been significant. While precise deal values are proprietary, several large acquisitions have consolidated market share and expanded technological capabilities, particularly within the software and robotics segments. The average deal value in recent years has been approximately $xx Million.
APAC Automated Material Handling and Storage Systems Industry Industry Trends & Insights
The APAC automated material handling and storage systems market is experiencing robust growth, driven by several key factors. E-commerce expansion continues to drive the demand for efficient warehousing and logistics solutions, significantly boosting market expansion. The increasing adoption of automation in various end-user industries such as automotive, electronics, and pharmaceuticals is another primary growth driver. This adoption is fueled by the need to increase productivity, reduce labor costs, and improve operational efficiency. Technological disruptions, notably in robotics and AI, are fundamentally reshaping the market. The development of Autonomous Mobile Robots (AMRs) and advanced software solutions is leading to improved flexibility and adaptability of automation systems.
Consumer preferences are shifting towards faster delivery times and greater transparency in the supply chain. This necessitates investments in automated systems capable of meeting these evolving expectations. Competitive dynamics are characterized by both intense rivalry among established players and the emergence of innovative startups offering disruptive technologies. The market is expected to witness a Compound Annual Growth Rate (CAGR) of xx% during the forecast period (2025-2033). Market penetration continues to grow across various sectors, currently estimated to be around xx%.
Dominant Markets & Segments in APAC Automated Material Handling and Storage Systems Industry
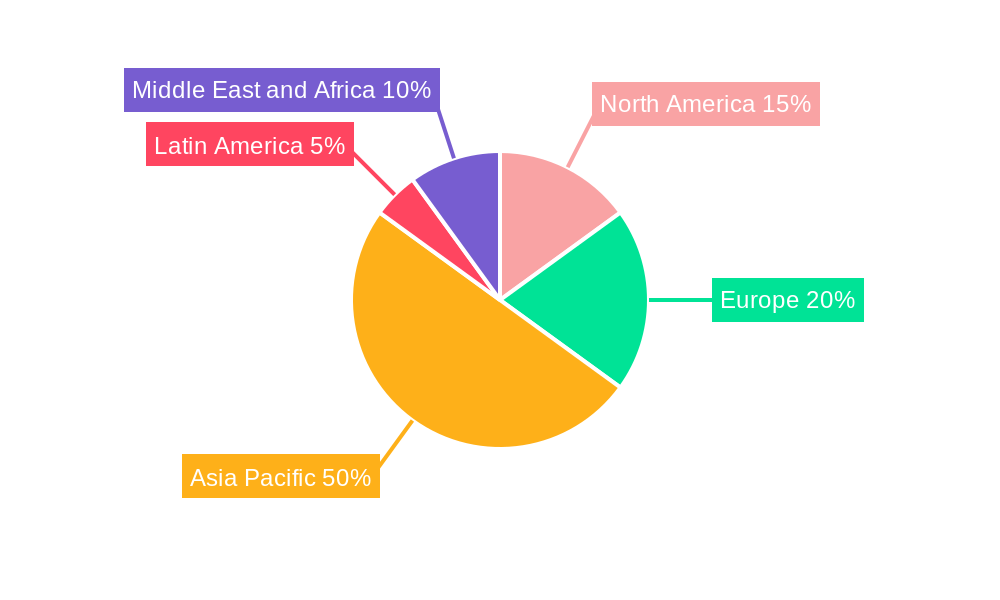
Dominant Regions/Countries: China is the dominant market in APAC, driven by its massive manufacturing sector and rapid e-commerce growth. Japan and South Korea also represent substantial markets due to their advanced manufacturing capabilities and high level of automation adoption. India’s market is rapidly expanding due to the growth of its logistics sector.
Dominant Product Types: Hardware dominates the market, comprising the bulk of the overall value. However, software and services are experiencing faster growth rates, indicating the increasing demand for integrated and intelligent automation solutions. The growing need for data analytics and optimization contributes to the growth of the services segment.
Dominant Equipment Types: Mobile robots (AGVs and AMRs) and Automated Storage and Retrieval Systems (ASRS) represent the most rapidly expanding segments among equipment types, showcasing the market’s shift toward flexible and intelligent automation.
Dominant End-User Industries: The retail/warehousing/distribution centers/logistics centers segment displays the highest demand. The automotive and electronics industries are also substantial end-users, followed by the food and beverage, and pharmaceutical sectors.
- Key Drivers:
- Rapid growth of e-commerce.
- Increasing labor costs.
- Government initiatives promoting automation.
- Improvements in infrastructure.
- Focus on supply chain optimization.
China’s dominance stems from its large manufacturing base and proactive government support for automation. Japan's advanced technological capabilities and high level of automation adoption contribute to its strong market position. India's rapidly growing economy and expanding logistics sector are fueling significant growth potential.
APAC Automated Material Handling and Storage Systems Industry Product Developments
Recent product innovations focus on enhancing system intelligence, flexibility, and safety. The integration of AI and machine learning allows for greater adaptability to changing operational needs and improved decision-making capabilities. The emphasis is on developing systems that are easier to integrate, manage, and maintain. This improves market fit by providing solutions tailored to various customer requirements and technological advancement across the industry.
Report Scope & Segmentation Analysis
This report segments the APAC automated material handling and storage systems market across various dimensions:
Product Type: Hardware, Software, Services. Growth projections vary, with software and services showing faster growth than hardware.
Equipment Type: Mobile Robots (AGVs and AMRs), Automated Conveyor Systems, Overhead Conveyors, Palletizers, ASRS, Sortation Systems. Mobile robots and ASRS are the fastest-growing segments.
End-User Industry: Airport, Automotive, Food and Beverage, Retail/Warehousing/Distribution Centers/Logistics Centers, General Manufacturing, Pharmaceuticals, Post and Parcel, Electronics and Semiconductor Manufacturing, Other End-user Industries. Retail/warehousing/distribution centers are the largest segment.
Country: China, Japan, Indonesia, India, Australia, Thailand, South Korea, Singapore, Malaysia, Taiwan, Rest of Asia Pacific. China holds the largest market share.
Each segment is analyzed in detail, examining market size, growth projections, and competitive dynamics.
Key Drivers of APAC Automated Material Handling and Storage Systems Industry Growth
The APAC market’s growth is fueled by several key factors: the surge in e-commerce, leading to a greater demand for efficient logistics; the escalating labor costs prompting businesses to seek automation; government policies that support industrial automation and smart manufacturing; and continuous technological advancements in robotics, AI, and IoT, which enable the development of more sophisticated and flexible automation systems.
Challenges in the APAC Automated Material Handling and Storage Systems Industry Sector
Significant challenges include high initial investment costs for automation systems, particularly for smaller businesses; the complexities associated with integrating new systems with existing infrastructure; potential skills gaps in operating and maintaining advanced automation technologies; and concerns related to data security and privacy within increasingly interconnected systems. These challenges impact market penetration and overall growth.
Emerging Opportunities in APAP Automated Material Handling and Storage Systems Industry
Emerging opportunities include expanding into less penetrated markets within the APAC region; integrating advanced technologies like 5G and edge computing to improve system performance and responsiveness; and developing customized solutions to meet specific needs of various industries; focusing on sustainable and energy-efficient solutions, which is gaining traction among environmentally conscious businesses.
Leading Players in the APAC Automated Material Handling and Storage Systems Industry Market
- System Logistics
- Jungheinrich AG
- Murata Machinery Ltd
- Interroll Group
- BEUMER Group GmbH & Co KG
- VisionNav Robotics
- SSI Schaefer AG
- Witron Logistik
- KION Group
- Kardex Group
- JBT Corporation
- Honeywell Intelligrated Inc
- Daifuku Co Ltd
- Toyota Industries Corporation
- Kuka AG
Key Developments in APAC Automated Material Handling and Storage Systems Industry Industry
April 2022: KION Battery Systems GmbH (KBS) expanded its production facility, enhancing its capacity for 24-volt batteries used in mobile warehouse handling equipment. This development strengthens KION Group's position in the market.
April 2022: Jungheinrich opened a new software and hardware development hub in Zagreb, Croatia, focusing on mobile robots, control systems, and ASRS. This expansion enhances Jungheinrich's technological capabilities and positions them for future growth.
Strategic Outlook for APAC Automated Material Handling and Storage Systems Industry Market
The APAC automated material handling and storage systems market is poised for significant growth, driven by ongoing technological advancements, increasing e-commerce activity, and the rising demand for efficient logistics solutions across various industries. The market presents attractive opportunities for both established players and new entrants, particularly those focused on innovative solutions and services, such as AI-powered systems and integrated software platforms. The future growth will be particularly pronounced in India, Southeast Asia, and other emerging economies.
APAC Automated Material Handling and Storage Systems Industry Segmentation
-
1. Product Type
- 1.1. Hardware
- 1.2. Software
- 1.3. Services
-
2. Equipment Type
-
2.1. Mobile Robots
-
2.1.1. Automated Guided Vehicle (AGV)
- 2.1.1.1. Automated Forklift
- 2.1.1.2. Automated Tow/Tractor/Tug
- 2.1.1.3. Unit Load
- 2.1.1.4. Assembly Line
- 2.1.1.5. Special Purpose
- 2.1.2. Autonomous Mobile Robots (AMR)
-
2.1.1. Automated Guided Vehicle (AGV)
-
2.2. Automated Storage and Retrieval System (ASRS)
- 2.2.1. Fixed Aisle
- 2.2.2. Carousel
- 2.2.3. Vertical Lift Module
-
2.3. Automated Conveyor
- 2.3.1. Belt
- 2.3.2. Roller
- 2.3.3. Pallet
- 2.3.4. Overhead
-
2.4. Palletizer
- 2.4.1. Conventional
- 2.4.2. Robotic
- 2.5. Sortation System
-
2.1. Mobile Robots
-
3. End-user Industry
- 3.1. Airport
- 3.2. Automotive
- 3.3. Food and Beverage
- 3.4. Retail/W
- 3.5. General Manufacturing
- 3.6. Pharmaceuticals
- 3.7. Post and Parcel
- 3.8. Electronics and Semiconductor Manufacturing
- 3.9. Other End-user Industries
APAC Automated Material Handling and Storage Systems Industry Segmentation By Geography
-
1. North America
- 1.1. United States
- 1.2. Canada
- 1.3. Mexico
-
2. South America
- 2.1. Brazil
- 2.2. Argentina
- 2.3. Rest of South America
-
3. Europe
- 3.1. United Kingdom
- 3.2. Germany
- 3.3. France
- 3.4. Italy
- 3.5. Spain
- 3.6. Russia
- 3.7. Benelux
- 3.8. Nordics
- 3.9. Rest of Europe
-
4. Middle East & Africa
- 4.1. Turkey
- 4.2. Israel
- 4.3. GCC
- 4.4. North Africa
- 4.5. South Africa
- 4.6. Rest of Middle East & Africa
-
5. Asia Pacific
- 5.1. China
- 5.2. India
- 5.3. Japan
- 5.4. South Korea
- 5.5. ASEAN
- 5.6. Oceania
- 5.7. Rest of Asia Pacific
APAC Automated Material Handling and Storage Systems Industry REPORT HIGHLIGHTS
| Aspects | Details |
|---|---|
| Study Period | 2019-2033 |
| Base Year | 2024 |
| Estimated Year | 2025 |
| Forecast Period | 2025-2033 |
| Historical Period | 2019-2024 |
| Growth Rate | CAGR of 12.30% from 2019-2033 |
| Segmentation |
|
Table of Contents
- 1. Introduction
- 1.1. Research Scope
- 1.2. Market Segmentation
- 1.3. Research Methodology
- 1.4. Definitions and Assumptions
- 2. Executive Summary
- 2.1. Introduction
- 3. Market Dynamics
- 3.1. Introduction
- 3.2. Market Drivers
- 3.2.1. Increasing Technological Advancements Aiding Market Growth; Industry 4.0 Investments driving the demand for automation and material Handling; Rapid Growth of E-commerce
- 3.3. Market Restrains
- 3.3.1. High Initial Costs; Unavailability of Skilled Workforce
- 3.4. Market Trends
- 3.4.1. Assembly Line to Witness Significant Growth
- 4. Market Factor Analysis
- 4.1. Porters Five Forces
- 4.2. Supply/Value Chain
- 4.3. PESTEL analysis
- 4.4. Market Entropy
- 4.5. Patent/Trademark Analysis
- 5. Global APAC Automated Material Handling and Storage Systems Industry Analysis, Insights and Forecast, 2019-2031
- 5.1. Market Analysis, Insights and Forecast - by Product Type
- 5.1.1. Hardware
- 5.1.2. Software
- 5.1.3. Services
- 5.2. Market Analysis, Insights and Forecast - by Equipment Type
- 5.2.1. Mobile Robots
- 5.2.1.1. Automated Guided Vehicle (AGV)
- 5.2.1.1.1. Automated Forklift
- 5.2.1.1.2. Automated Tow/Tractor/Tug
- 5.2.1.1.3. Unit Load
- 5.2.1.1.4. Assembly Line
- 5.2.1.1.5. Special Purpose
- 5.2.1.2. Autonomous Mobile Robots (AMR)
- 5.2.1.1. Automated Guided Vehicle (AGV)
- 5.2.2. Automated Storage and Retrieval System (ASRS)
- 5.2.2.1. Fixed Aisle
- 5.2.2.2. Carousel
- 5.2.2.3. Vertical Lift Module
- 5.2.3. Automated Conveyor
- 5.2.3.1. Belt
- 5.2.3.2. Roller
- 5.2.3.3. Pallet
- 5.2.3.4. Overhead
- 5.2.4. Palletizer
- 5.2.4.1. Conventional
- 5.2.4.2. Robotic
- 5.2.5. Sortation System
- 5.2.1. Mobile Robots
- 5.3. Market Analysis, Insights and Forecast - by End-user Industry
- 5.3.1. Airport
- 5.3.2. Automotive
- 5.3.3. Food and Beverage
- 5.3.4. Retail/W
- 5.3.5. General Manufacturing
- 5.3.6. Pharmaceuticals
- 5.3.7. Post and Parcel
- 5.3.8. Electronics and Semiconductor Manufacturing
- 5.3.9. Other End-user Industries
- 5.4. Market Analysis, Insights and Forecast - by Region
- 5.4.1. North America
- 5.4.2. South America
- 5.4.3. Europe
- 5.4.4. Middle East & Africa
- 5.4.5. Asia Pacific
- 5.1. Market Analysis, Insights and Forecast - by Product Type
- 6. North America APAC Automated Material Handling and Storage Systems Industry Analysis, Insights and Forecast, 2019-2031
- 6.1. Market Analysis, Insights and Forecast - by Product Type
- 6.1.1. Hardware
- 6.1.2. Software
- 6.1.3. Services
- 6.2. Market Analysis, Insights and Forecast - by Equipment Type
- 6.2.1. Mobile Robots
- 6.2.1.1. Automated Guided Vehicle (AGV)
- 6.2.1.1.1. Automated Forklift
- 6.2.1.1.2. Automated Tow/Tractor/Tug
- 6.2.1.1.3. Unit Load
- 6.2.1.1.4. Assembly Line
- 6.2.1.1.5. Special Purpose
- 6.2.1.2. Autonomous Mobile Robots (AMR)
- 6.2.1.1. Automated Guided Vehicle (AGV)
- 6.2.2. Automated Storage and Retrieval System (ASRS)
- 6.2.2.1. Fixed Aisle
- 6.2.2.2. Carousel
- 6.2.2.3. Vertical Lift Module
- 6.2.3. Automated Conveyor
- 6.2.3.1. Belt
- 6.2.3.2. Roller
- 6.2.3.3. Pallet
- 6.2.3.4. Overhead
- 6.2.4. Palletizer
- 6.2.4.1. Conventional
- 6.2.4.2. Robotic
- 6.2.5. Sortation System
- 6.2.1. Mobile Robots
- 6.3. Market Analysis, Insights and Forecast - by End-user Industry
- 6.3.1. Airport
- 6.3.2. Automotive
- 6.3.3. Food and Beverage
- 6.3.4. Retail/W
- 6.3.5. General Manufacturing
- 6.3.6. Pharmaceuticals
- 6.3.7. Post and Parcel
- 6.3.8. Electronics and Semiconductor Manufacturing
- 6.3.9. Other End-user Industries
- 6.1. Market Analysis, Insights and Forecast - by Product Type
- 7. South America APAC Automated Material Handling and Storage Systems Industry Analysis, Insights and Forecast, 2019-2031
- 7.1. Market Analysis, Insights and Forecast - by Product Type
- 7.1.1. Hardware
- 7.1.2. Software
- 7.1.3. Services
- 7.2. Market Analysis, Insights and Forecast - by Equipment Type
- 7.2.1. Mobile Robots
- 7.2.1.1. Automated Guided Vehicle (AGV)
- 7.2.1.1.1. Automated Forklift
- 7.2.1.1.2. Automated Tow/Tractor/Tug
- 7.2.1.1.3. Unit Load
- 7.2.1.1.4. Assembly Line
- 7.2.1.1.5. Special Purpose
- 7.2.1.2. Autonomous Mobile Robots (AMR)
- 7.2.1.1. Automated Guided Vehicle (AGV)
- 7.2.2. Automated Storage and Retrieval System (ASRS)
- 7.2.2.1. Fixed Aisle
- 7.2.2.2. Carousel
- 7.2.2.3. Vertical Lift Module
- 7.2.3. Automated Conveyor
- 7.2.3.1. Belt
- 7.2.3.2. Roller
- 7.2.3.3. Pallet
- 7.2.3.4. Overhead
- 7.2.4. Palletizer
- 7.2.4.1. Conventional
- 7.2.4.2. Robotic
- 7.2.5. Sortation System
- 7.2.1. Mobile Robots
- 7.3. Market Analysis, Insights and Forecast - by End-user Industry
- 7.3.1. Airport
- 7.3.2. Automotive
- 7.3.3. Food and Beverage
- 7.3.4. Retail/W
- 7.3.5. General Manufacturing
- 7.3.6. Pharmaceuticals
- 7.3.7. Post and Parcel
- 7.3.8. Electronics and Semiconductor Manufacturing
- 7.3.9. Other End-user Industries
- 7.1. Market Analysis, Insights and Forecast - by Product Type
- 8. Europe APAC Automated Material Handling and Storage Systems Industry Analysis, Insights and Forecast, 2019-2031
- 8.1. Market Analysis, Insights and Forecast - by Product Type
- 8.1.1. Hardware
- 8.1.2. Software
- 8.1.3. Services
- 8.2. Market Analysis, Insights and Forecast - by Equipment Type
- 8.2.1. Mobile Robots
- 8.2.1.1. Automated Guided Vehicle (AGV)
- 8.2.1.1.1. Automated Forklift
- 8.2.1.1.2. Automated Tow/Tractor/Tug
- 8.2.1.1.3. Unit Load
- 8.2.1.1.4. Assembly Line
- 8.2.1.1.5. Special Purpose
- 8.2.1.2. Autonomous Mobile Robots (AMR)
- 8.2.1.1. Automated Guided Vehicle (AGV)
- 8.2.2. Automated Storage and Retrieval System (ASRS)
- 8.2.2.1. Fixed Aisle
- 8.2.2.2. Carousel
- 8.2.2.3. Vertical Lift Module
- 8.2.3. Automated Conveyor
- 8.2.3.1. Belt
- 8.2.3.2. Roller
- 8.2.3.3. Pallet
- 8.2.3.4. Overhead
- 8.2.4. Palletizer
- 8.2.4.1. Conventional
- 8.2.4.2. Robotic
- 8.2.5. Sortation System
- 8.2.1. Mobile Robots
- 8.3. Market Analysis, Insights and Forecast - by End-user Industry
- 8.3.1. Airport
- 8.3.2. Automotive
- 8.3.3. Food and Beverage
- 8.3.4. Retail/W
- 8.3.5. General Manufacturing
- 8.3.6. Pharmaceuticals
- 8.3.7. Post and Parcel
- 8.3.8. Electronics and Semiconductor Manufacturing
- 8.3.9. Other End-user Industries
- 8.1. Market Analysis, Insights and Forecast - by Product Type
- 9. Middle East & Africa APAC Automated Material Handling and Storage Systems Industry Analysis, Insights and Forecast, 2019-2031
- 9.1. Market Analysis, Insights and Forecast - by Product Type
- 9.1.1. Hardware
- 9.1.2. Software
- 9.1.3. Services
- 9.2. Market Analysis, Insights and Forecast - by Equipment Type
- 9.2.1. Mobile Robots
- 9.2.1.1. Automated Guided Vehicle (AGV)
- 9.2.1.1.1. Automated Forklift
- 9.2.1.1.2. Automated Tow/Tractor/Tug
- 9.2.1.1.3. Unit Load
- 9.2.1.1.4. Assembly Line
- 9.2.1.1.5. Special Purpose
- 9.2.1.2. Autonomous Mobile Robots (AMR)
- 9.2.1.1. Automated Guided Vehicle (AGV)
- 9.2.2. Automated Storage and Retrieval System (ASRS)
- 9.2.2.1. Fixed Aisle
- 9.2.2.2. Carousel
- 9.2.2.3. Vertical Lift Module
- 9.2.3. Automated Conveyor
- 9.2.3.1. Belt
- 9.2.3.2. Roller
- 9.2.3.3. Pallet
- 9.2.3.4. Overhead
- 9.2.4. Palletizer
- 9.2.4.1. Conventional
- 9.2.4.2. Robotic
- 9.2.5. Sortation System
- 9.2.1. Mobile Robots
- 9.3. Market Analysis, Insights and Forecast - by End-user Industry
- 9.3.1. Airport
- 9.3.2. Automotive
- 9.3.3. Food and Beverage
- 9.3.4. Retail/W
- 9.3.5. General Manufacturing
- 9.3.6. Pharmaceuticals
- 9.3.7. Post and Parcel
- 9.3.8. Electronics and Semiconductor Manufacturing
- 9.3.9. Other End-user Industries
- 9.1. Market Analysis, Insights and Forecast - by Product Type
- 10. Asia Pacific APAC Automated Material Handling and Storage Systems Industry Analysis, Insights and Forecast, 2019-2031
- 10.1. Market Analysis, Insights and Forecast - by Product Type
- 10.1.1. Hardware
- 10.1.2. Software
- 10.1.3. Services
- 10.2. Market Analysis, Insights and Forecast - by Equipment Type
- 10.2.1. Mobile Robots
- 10.2.1.1. Automated Guided Vehicle (AGV)
- 10.2.1.1.1. Automated Forklift
- 10.2.1.1.2. Automated Tow/Tractor/Tug
- 10.2.1.1.3. Unit Load
- 10.2.1.1.4. Assembly Line
- 10.2.1.1.5. Special Purpose
- 10.2.1.2. Autonomous Mobile Robots (AMR)
- 10.2.1.1. Automated Guided Vehicle (AGV)
- 10.2.2. Automated Storage and Retrieval System (ASRS)
- 10.2.2.1. Fixed Aisle
- 10.2.2.2. Carousel
- 10.2.2.3. Vertical Lift Module
- 10.2.3. Automated Conveyor
- 10.2.3.1. Belt
- 10.2.3.2. Roller
- 10.2.3.3. Pallet
- 10.2.3.4. Overhead
- 10.2.4. Palletizer
- 10.2.4.1. Conventional
- 10.2.4.2. Robotic
- 10.2.5. Sortation System
- 10.2.1. Mobile Robots
- 10.3. Market Analysis, Insights and Forecast - by End-user Industry
- 10.3.1. Airport
- 10.3.2. Automotive
- 10.3.3. Food and Beverage
- 10.3.4. Retail/W
- 10.3.5. General Manufacturing
- 10.3.6. Pharmaceuticals
- 10.3.7. Post and Parcel
- 10.3.8. Electronics and Semiconductor Manufacturing
- 10.3.9. Other End-user Industries
- 10.1. Market Analysis, Insights and Forecast - by Product Type
- 11. North America APAC Automated Material Handling and Storage Systems Industry Analysis, Insights and Forecast, 2019-2031
- 11.1. Market Analysis, Insights and Forecast - By Country/Sub-region
- 11.1.1 United States
- 11.1.2 Canada
- 12. Europe APAC Automated Material Handling and Storage Systems Industry Analysis, Insights and Forecast, 2019-2031
- 12.1. Market Analysis, Insights and Forecast - By Country/Sub-region
- 12.1.1 United Kingdom
- 12.1.2 France
- 12.1.3 Italy
- 12.1.4 Germany
- 12.1.5 Rest of Europe
- 13. Asia Pacific APAC Automated Material Handling and Storage Systems Industry Analysis, Insights and Forecast, 2019-2031
- 13.1. Market Analysis, Insights and Forecast - By Country/Sub-region
- 13.1.1 China
- 13.1.2 Japan
- 13.1.3 India
- 13.1.4 Rest of Asia Pacific
- 14. Latin America APAC Automated Material Handling and Storage Systems Industry Analysis, Insights and Forecast, 2019-2031
- 14.1. Market Analysis, Insights and Forecast - By Country/Sub-region
- 14.1.1 Brazil
- 14.1.2 Argentina
- 14.1.3 Mexico
- 14.1.4 Rest of Latin America
- 15. Middle East and Africa APAC Automated Material Handling and Storage Systems Industry Analysis, Insights and Forecast, 2019-2031
- 15.1. Market Analysis, Insights and Forecast - By Country/Sub-region
- 15.1.1 South Africa
- 15.1.2 Israel
- 15.1.3 Saudi Arabia
- 15.1.4 Rest of Middle East and Africa
- 16. Competitive Analysis
- 16.1. Global Market Share Analysis 2024
- 16.2. Company Profiles
- 16.2.1 System Logistics
- 16.2.1.1. Overview
- 16.2.1.2. Products
- 16.2.1.3. SWOT Analysis
- 16.2.1.4. Recent Developments
- 16.2.1.5. Financials (Based on Availability)
- 16.2.2 Jungheinrich AG
- 16.2.2.1. Overview
- 16.2.2.2. Products
- 16.2.2.3. SWOT Analysis
- 16.2.2.4. Recent Developments
- 16.2.2.5. Financials (Based on Availability)
- 16.2.3 Murata Machinery Ltd
- 16.2.3.1. Overview
- 16.2.3.2. Products
- 16.2.3.3. SWOT Analysis
- 16.2.3.4. Recent Developments
- 16.2.3.5. Financials (Based on Availability)
- 16.2.4 Interroll Group
- 16.2.4.1. Overview
- 16.2.4.2. Products
- 16.2.4.3. SWOT Analysis
- 16.2.4.4. Recent Developments
- 16.2.4.5. Financials (Based on Availability)
- 16.2.5 BEUMER Group GmbH & Co KG
- 16.2.5.1. Overview
- 16.2.5.2. Products
- 16.2.5.3. SWOT Analysis
- 16.2.5.4. Recent Developments
- 16.2.5.5. Financials (Based on Availability)
- 16.2.6 VisionNav Robotics
- 16.2.6.1. Overview
- 16.2.6.2. Products
- 16.2.6.3. SWOT Analysis
- 16.2.6.4. Recent Developments
- 16.2.6.5. Financials (Based on Availability)
- 16.2.7 SSI Schaefer AG
- 16.2.7.1. Overview
- 16.2.7.2. Products
- 16.2.7.3. SWOT Analysis
- 16.2.7.4. Recent Developments
- 16.2.7.5. Financials (Based on Availability)
- 16.2.8 Witron Logistik
- 16.2.8.1. Overview
- 16.2.8.2. Products
- 16.2.8.3. SWOT Analysis
- 16.2.8.4. Recent Developments
- 16.2.8.5. Financials (Based on Availability)
- 16.2.9 KION Group
- 16.2.9.1. Overview
- 16.2.9.2. Products
- 16.2.9.3. SWOT Analysis
- 16.2.9.4. Recent Developments
- 16.2.9.5. Financials (Based on Availability)
- 16.2.10 Kardex Group
- 16.2.10.1. Overview
- 16.2.10.2. Products
- 16.2.10.3. SWOT Analysis
- 16.2.10.4. Recent Developments
- 16.2.10.5. Financials (Based on Availability)
- 16.2.11 JBT Corporation
- 16.2.11.1. Overview
- 16.2.11.2. Products
- 16.2.11.3. SWOT Analysis
- 16.2.11.4. Recent Developments
- 16.2.11.5. Financials (Based on Availability)
- 16.2.12 Honeywell Intelligrated Inc
- 16.2.12.1. Overview
- 16.2.12.2. Products
- 16.2.12.3. SWOT Analysis
- 16.2.12.4. Recent Developments
- 16.2.12.5. Financials (Based on Availability)
- 16.2.13 Daifuku Co Ltd
- 16.2.13.1. Overview
- 16.2.13.2. Products
- 16.2.13.3. SWOT Analysis
- 16.2.13.4. Recent Developments
- 16.2.13.5. Financials (Based on Availability)
- 16.2.14 Toyota Industries Corporation
- 16.2.14.1. Overview
- 16.2.14.2. Products
- 16.2.14.3. SWOT Analysis
- 16.2.14.4. Recent Developments
- 16.2.14.5. Financials (Based on Availability)
- 16.2.15 Kuka AG
- 16.2.15.1. Overview
- 16.2.15.2. Products
- 16.2.15.3. SWOT Analysis
- 16.2.15.4. Recent Developments
- 16.2.15.5. Financials (Based on Availability)
- 16.2.1 System Logistics
List of Figures
- Figure 1: Global APAC Automated Material Handling and Storage Systems Industry Revenue Breakdown (Million, %) by Region 2024 & 2032
- Figure 2: North America APAC Automated Material Handling and Storage Systems Industry Revenue (Million), by Country 2024 & 2032
- Figure 3: North America APAC Automated Material Handling and Storage Systems Industry Revenue Share (%), by Country 2024 & 2032
- Figure 4: Europe APAC Automated Material Handling and Storage Systems Industry Revenue (Million), by Country 2024 & 2032
- Figure 5: Europe APAC Automated Material Handling and Storage Systems Industry Revenue Share (%), by Country 2024 & 2032
- Figure 6: Asia Pacific APAC Automated Material Handling and Storage Systems Industry Revenue (Million), by Country 2024 & 2032
- Figure 7: Asia Pacific APAC Automated Material Handling and Storage Systems Industry Revenue Share (%), by Country 2024 & 2032
- Figure 8: Latin America APAC Automated Material Handling and Storage Systems Industry Revenue (Million), by Country 2024 & 2032
- Figure 9: Latin America APAC Automated Material Handling and Storage Systems Industry Revenue Share (%), by Country 2024 & 2032
- Figure 10: Middle East and Africa APAC Automated Material Handling and Storage Systems Industry Revenue (Million), by Country 2024 & 2032
- Figure 11: Middle East and Africa APAC Automated Material Handling and Storage Systems Industry Revenue Share (%), by Country 2024 & 2032
- Figure 12: North America APAC Automated Material Handling and Storage Systems Industry Revenue (Million), by Product Type 2024 & 2032
- Figure 13: North America APAC Automated Material Handling and Storage Systems Industry Revenue Share (%), by Product Type 2024 & 2032
- Figure 14: North America APAC Automated Material Handling and Storage Systems Industry Revenue (Million), by Equipment Type 2024 & 2032
- Figure 15: North America APAC Automated Material Handling and Storage Systems Industry Revenue Share (%), by Equipment Type 2024 & 2032
- Figure 16: North America APAC Automated Material Handling and Storage Systems Industry Revenue (Million), by End-user Industry 2024 & 2032
- Figure 17: North America APAC Automated Material Handling and Storage Systems Industry Revenue Share (%), by End-user Industry 2024 & 2032
- Figure 18: North America APAC Automated Material Handling and Storage Systems Industry Revenue (Million), by Country 2024 & 2032
- Figure 19: North America APAC Automated Material Handling and Storage Systems Industry Revenue Share (%), by Country 2024 & 2032
- Figure 20: South America APAC Automated Material Handling and Storage Systems Industry Revenue (Million), by Product Type 2024 & 2032
- Figure 21: South America APAC Automated Material Handling and Storage Systems Industry Revenue Share (%), by Product Type 2024 & 2032
- Figure 22: South America APAC Automated Material Handling and Storage Systems Industry Revenue (Million), by Equipment Type 2024 & 2032
- Figure 23: South America APAC Automated Material Handling and Storage Systems Industry Revenue Share (%), by Equipment Type 2024 & 2032
- Figure 24: South America APAC Automated Material Handling and Storage Systems Industry Revenue (Million), by End-user Industry 2024 & 2032
- Figure 25: South America APAC Automated Material Handling and Storage Systems Industry Revenue Share (%), by End-user Industry 2024 & 2032
- Figure 26: South America APAC Automated Material Handling and Storage Systems Industry Revenue (Million), by Country 2024 & 2032
- Figure 27: South America APAC Automated Material Handling and Storage Systems Industry Revenue Share (%), by Country 2024 & 2032
- Figure 28: Europe APAC Automated Material Handling and Storage Systems Industry Revenue (Million), by Product Type 2024 & 2032
- Figure 29: Europe APAC Automated Material Handling and Storage Systems Industry Revenue Share (%), by Product Type 2024 & 2032
- Figure 30: Europe APAC Automated Material Handling and Storage Systems Industry Revenue (Million), by Equipment Type 2024 & 2032
- Figure 31: Europe APAC Automated Material Handling and Storage Systems Industry Revenue Share (%), by Equipment Type 2024 & 2032
- Figure 32: Europe APAC Automated Material Handling and Storage Systems Industry Revenue (Million), by End-user Industry 2024 & 2032
- Figure 33: Europe APAC Automated Material Handling and Storage Systems Industry Revenue Share (%), by End-user Industry 2024 & 2032
- Figure 34: Europe APAC Automated Material Handling and Storage Systems Industry Revenue (Million), by Country 2024 & 2032
- Figure 35: Europe APAC Automated Material Handling and Storage Systems Industry Revenue Share (%), by Country 2024 & 2032
- Figure 36: Middle East & Africa APAC Automated Material Handling and Storage Systems Industry Revenue (Million), by Product Type 2024 & 2032
- Figure 37: Middle East & Africa APAC Automated Material Handling and Storage Systems Industry Revenue Share (%), by Product Type 2024 & 2032
- Figure 38: Middle East & Africa APAC Automated Material Handling and Storage Systems Industry Revenue (Million), by Equipment Type 2024 & 2032
- Figure 39: Middle East & Africa APAC Automated Material Handling and Storage Systems Industry Revenue Share (%), by Equipment Type 2024 & 2032
- Figure 40: Middle East & Africa APAC Automated Material Handling and Storage Systems Industry Revenue (Million), by End-user Industry 2024 & 2032
- Figure 41: Middle East & Africa APAC Automated Material Handling and Storage Systems Industry Revenue Share (%), by End-user Industry 2024 & 2032
- Figure 42: Middle East & Africa APAC Automated Material Handling and Storage Systems Industry Revenue (Million), by Country 2024 & 2032
- Figure 43: Middle East & Africa APAC Automated Material Handling and Storage Systems Industry Revenue Share (%), by Country 2024 & 2032
- Figure 44: Asia Pacific APAC Automated Material Handling and Storage Systems Industry Revenue (Million), by Product Type 2024 & 2032
- Figure 45: Asia Pacific APAC Automated Material Handling and Storage Systems Industry Revenue Share (%), by Product Type 2024 & 2032
- Figure 46: Asia Pacific APAC Automated Material Handling and Storage Systems Industry Revenue (Million), by Equipment Type 2024 & 2032
- Figure 47: Asia Pacific APAC Automated Material Handling and Storage Systems Industry Revenue Share (%), by Equipment Type 2024 & 2032
- Figure 48: Asia Pacific APAC Automated Material Handling and Storage Systems Industry Revenue (Million), by End-user Industry 2024 & 2032
- Figure 49: Asia Pacific APAC Automated Material Handling and Storage Systems Industry Revenue Share (%), by End-user Industry 2024 & 2032
- Figure 50: Asia Pacific APAC Automated Material Handling and Storage Systems Industry Revenue (Million), by Country 2024 & 2032
- Figure 51: Asia Pacific APAC Automated Material Handling and Storage Systems Industry Revenue Share (%), by Country 2024 & 2032
List of Tables
- Table 1: Global APAC Automated Material Handling and Storage Systems Industry Revenue Million Forecast, by Region 2019 & 2032
- Table 2: Global APAC Automated Material Handling and Storage Systems Industry Revenue Million Forecast, by Product Type 2019 & 2032
- Table 3: Global APAC Automated Material Handling and Storage Systems Industry Revenue Million Forecast, by Equipment Type 2019 & 2032
- Table 4: Global APAC Automated Material Handling and Storage Systems Industry Revenue Million Forecast, by End-user Industry 2019 & 2032
- Table 5: Global APAC Automated Material Handling and Storage Systems Industry Revenue Million Forecast, by Region 2019 & 2032
- Table 6: Global APAC Automated Material Handling and Storage Systems Industry Revenue Million Forecast, by Country 2019 & 2032
- Table 7: United States APAC Automated Material Handling and Storage Systems Industry Revenue (Million) Forecast, by Application 2019 & 2032
- Table 8: Canada APAC Automated Material Handling and Storage Systems Industry Revenue (Million) Forecast, by Application 2019 & 2032
- Table 9: Global APAC Automated Material Handling and Storage Systems Industry Revenue Million Forecast, by Country 2019 & 2032
- Table 10: United Kingdom APAC Automated Material Handling and Storage Systems Industry Revenue (Million) Forecast, by Application 2019 & 2032
- Table 11: France APAC Automated Material Handling and Storage Systems Industry Revenue (Million) Forecast, by Application 2019 & 2032
- Table 12: Italy APAC Automated Material Handling and Storage Systems Industry Revenue (Million) Forecast, by Application 2019 & 2032
- Table 13: Germany APAC Automated Material Handling and Storage Systems Industry Revenue (Million) Forecast, by Application 2019 & 2032
- Table 14: Rest of Europe APAC Automated Material Handling and Storage Systems Industry Revenue (Million) Forecast, by Application 2019 & 2032
- Table 15: Global APAC Automated Material Handling and Storage Systems Industry Revenue Million Forecast, by Country 2019 & 2032
- Table 16: China APAC Automated Material Handling and Storage Systems Industry Revenue (Million) Forecast, by Application 2019 & 2032
- Table 17: Japan APAC Automated Material Handling and Storage Systems Industry Revenue (Million) Forecast, by Application 2019 & 2032
- Table 18: India APAC Automated Material Handling and Storage Systems Industry Revenue (Million) Forecast, by Application 2019 & 2032
- Table 19: Rest of Asia Pacific APAC Automated Material Handling and Storage Systems Industry Revenue (Million) Forecast, by Application 2019 & 2032
- Table 20: Global APAC Automated Material Handling and Storage Systems Industry Revenue Million Forecast, by Country 2019 & 2032
- Table 21: Brazil APAC Automated Material Handling and Storage Systems Industry Revenue (Million) Forecast, by Application 2019 & 2032
- Table 22: Argentina APAC Automated Material Handling and Storage Systems Industry Revenue (Million) Forecast, by Application 2019 & 2032
- Table 23: Mexico APAC Automated Material Handling and Storage Systems Industry Revenue (Million) Forecast, by Application 2019 & 2032
- Table 24: Rest of Latin America APAC Automated Material Handling and Storage Systems Industry Revenue (Million) Forecast, by Application 2019 & 2032
- Table 25: Global APAC Automated Material Handling and Storage Systems Industry Revenue Million Forecast, by Country 2019 & 2032
- Table 26: South Africa APAC Automated Material Handling and Storage Systems Industry Revenue (Million) Forecast, by Application 2019 & 2032
- Table 27: Israel APAC Automated Material Handling and Storage Systems Industry Revenue (Million) Forecast, by Application 2019 & 2032
- Table 28: Saudi Arabia APAC Automated Material Handling and Storage Systems Industry Revenue (Million) Forecast, by Application 2019 & 2032
- Table 29: Rest of Middle East and Africa APAC Automated Material Handling and Storage Systems Industry Revenue (Million) Forecast, by Application 2019 & 2032
- Table 30: Global APAC Automated Material Handling and Storage Systems Industry Revenue Million Forecast, by Product Type 2019 & 2032
- Table 31: Global APAC Automated Material Handling and Storage Systems Industry Revenue Million Forecast, by Equipment Type 2019 & 2032
- Table 32: Global APAC Automated Material Handling and Storage Systems Industry Revenue Million Forecast, by End-user Industry 2019 & 2032
- Table 33: Global APAC Automated Material Handling and Storage Systems Industry Revenue Million Forecast, by Country 2019 & 2032
- Table 34: United States APAC Automated Material Handling and Storage Systems Industry Revenue (Million) Forecast, by Application 2019 & 2032
- Table 35: Canada APAC Automated Material Handling and Storage Systems Industry Revenue (Million) Forecast, by Application 2019 & 2032
- Table 36: Mexico APAC Automated Material Handling and Storage Systems Industry Revenue (Million) Forecast, by Application 2019 & 2032
- Table 37: Global APAC Automated Material Handling and Storage Systems Industry Revenue Million Forecast, by Product Type 2019 & 2032
- Table 38: Global APAC Automated Material Handling and Storage Systems Industry Revenue Million Forecast, by Equipment Type 2019 & 2032
- Table 39: Global APAC Automated Material Handling and Storage Systems Industry Revenue Million Forecast, by End-user Industry 2019 & 2032
- Table 40: Global APAC Automated Material Handling and Storage Systems Industry Revenue Million Forecast, by Country 2019 & 2032
- Table 41: Brazil APAC Automated Material Handling and Storage Systems Industry Revenue (Million) Forecast, by Application 2019 & 2032
- Table 42: Argentina APAC Automated Material Handling and Storage Systems Industry Revenue (Million) Forecast, by Application 2019 & 2032
- Table 43: Rest of South America APAC Automated Material Handling and Storage Systems Industry Revenue (Million) Forecast, by Application 2019 & 2032
- Table 44: Global APAC Automated Material Handling and Storage Systems Industry Revenue Million Forecast, by Product Type 2019 & 2032
- Table 45: Global APAC Automated Material Handling and Storage Systems Industry Revenue Million Forecast, by Equipment Type 2019 & 2032
- Table 46: Global APAC Automated Material Handling and Storage Systems Industry Revenue Million Forecast, by End-user Industry 2019 & 2032
- Table 47: Global APAC Automated Material Handling and Storage Systems Industry Revenue Million Forecast, by Country 2019 & 2032
- Table 48: United Kingdom APAC Automated Material Handling and Storage Systems Industry Revenue (Million) Forecast, by Application 2019 & 2032
- Table 49: Germany APAC Automated Material Handling and Storage Systems Industry Revenue (Million) Forecast, by Application 2019 & 2032
- Table 50: France APAC Automated Material Handling and Storage Systems Industry Revenue (Million) Forecast, by Application 2019 & 2032
- Table 51: Italy APAC Automated Material Handling and Storage Systems Industry Revenue (Million) Forecast, by Application 2019 & 2032
- Table 52: Spain APAC Automated Material Handling and Storage Systems Industry Revenue (Million) Forecast, by Application 2019 & 2032
- Table 53: Russia APAC Automated Material Handling and Storage Systems Industry Revenue (Million) Forecast, by Application 2019 & 2032
- Table 54: Benelux APAC Automated Material Handling and Storage Systems Industry Revenue (Million) Forecast, by Application 2019 & 2032
- Table 55: Nordics APAC Automated Material Handling and Storage Systems Industry Revenue (Million) Forecast, by Application 2019 & 2032
- Table 56: Rest of Europe APAC Automated Material Handling and Storage Systems Industry Revenue (Million) Forecast, by Application 2019 & 2032
- Table 57: Global APAC Automated Material Handling and Storage Systems Industry Revenue Million Forecast, by Product Type 2019 & 2032
- Table 58: Global APAC Automated Material Handling and Storage Systems Industry Revenue Million Forecast, by Equipment Type 2019 & 2032
- Table 59: Global APAC Automated Material Handling and Storage Systems Industry Revenue Million Forecast, by End-user Industry 2019 & 2032
- Table 60: Global APAC Automated Material Handling and Storage Systems Industry Revenue Million Forecast, by Country 2019 & 2032
- Table 61: Turkey APAC Automated Material Handling and Storage Systems Industry Revenue (Million) Forecast, by Application 2019 & 2032
- Table 62: Israel APAC Automated Material Handling and Storage Systems Industry Revenue (Million) Forecast, by Application 2019 & 2032
- Table 63: GCC APAC Automated Material Handling and Storage Systems Industry Revenue (Million) Forecast, by Application 2019 & 2032
- Table 64: North Africa APAC Automated Material Handling and Storage Systems Industry Revenue (Million) Forecast, by Application 2019 & 2032
- Table 65: South Africa APAC Automated Material Handling and Storage Systems Industry Revenue (Million) Forecast, by Application 2019 & 2032
- Table 66: Rest of Middle East & Africa APAC Automated Material Handling and Storage Systems Industry Revenue (Million) Forecast, by Application 2019 & 2032
- Table 67: Global APAC Automated Material Handling and Storage Systems Industry Revenue Million Forecast, by Product Type 2019 & 2032
- Table 68: Global APAC Automated Material Handling and Storage Systems Industry Revenue Million Forecast, by Equipment Type 2019 & 2032
- Table 69: Global APAC Automated Material Handling and Storage Systems Industry Revenue Million Forecast, by End-user Industry 2019 & 2032
- Table 70: Global APAC Automated Material Handling and Storage Systems Industry Revenue Million Forecast, by Country 2019 & 2032
- Table 71: China APAC Automated Material Handling and Storage Systems Industry Revenue (Million) Forecast, by Application 2019 & 2032
- Table 72: India APAC Automated Material Handling and Storage Systems Industry Revenue (Million) Forecast, by Application 2019 & 2032
- Table 73: Japan APAC Automated Material Handling and Storage Systems Industry Revenue (Million) Forecast, by Application 2019 & 2032
- Table 74: South Korea APAC Automated Material Handling and Storage Systems Industry Revenue (Million) Forecast, by Application 2019 & 2032
- Table 75: ASEAN APAC Automated Material Handling and Storage Systems Industry Revenue (Million) Forecast, by Application 2019 & 2032
- Table 76: Oceania APAC Automated Material Handling and Storage Systems Industry Revenue (Million) Forecast, by Application 2019 & 2032
- Table 77: Rest of Asia Pacific APAC Automated Material Handling and Storage Systems Industry Revenue (Million) Forecast, by Application 2019 & 2032
Frequently Asked Questions
1. What is the projected Compound Annual Growth Rate (CAGR) of the APAC Automated Material Handling and Storage Systems Industry?
The projected CAGR is approximately 12.30%.
2. Which companies are prominent players in the APAC Automated Material Handling and Storage Systems Industry?
Key companies in the market include System Logistics, Jungheinrich AG, Murata Machinery Ltd, Interroll Group, BEUMER Group GmbH & Co KG, VisionNav Robotics, SSI Schaefer AG, Witron Logistik, KION Group, Kardex Group, JBT Corporation, Honeywell Intelligrated Inc, Daifuku Co Ltd, Toyota Industries Corporation, Kuka AG.
3. What are the main segments of the APAC Automated Material Handling and Storage Systems Industry?
The market segments include Product Type, Equipment Type, End-user Industry.
4. Can you provide details about the market size?
The market size is estimated to be USD XX Million as of 2022.
5. What are some drivers contributing to market growth?
Increasing Technological Advancements Aiding Market Growth; Industry 4.0 Investments driving the demand for automation and material Handling; Rapid Growth of E-commerce.
6. What are the notable trends driving market growth?
Assembly Line to Witness Significant Growth.
7. Are there any restraints impacting market growth?
High Initial Costs; Unavailability of Skilled Workforce.
8. Can you provide examples of recent developments in the market?
April 2022 - KION Battery Systems GmbH (KBS) expanded its production facility at the Karlstein site and set the next milestone in its path of growth and innovation. The company, a partnership between KION GROUP AG and BMZ Holding GmbH, has officially established a second production line for manufacturing 24-volt batteries used in mobile warehouse handling equipment.
9. What pricing options are available for accessing the report?
Pricing options include single-user, multi-user, and enterprise licenses priced at USD 3800, USD 4500, and USD 5800 respectively.
10. Is the market size provided in terms of value or volume?
The market size is provided in terms of value, measured in Million.
11. Are there any specific market keywords associated with the report?
Yes, the market keyword associated with the report is "APAC Automated Material Handling and Storage Systems Industry," which aids in identifying and referencing the specific market segment covered.
12. How do I determine which pricing option suits my needs best?
The pricing options vary based on user requirements and access needs. Individual users may opt for single-user licenses, while businesses requiring broader access may choose multi-user or enterprise licenses for cost-effective access to the report.
13. Are there any additional resources or data provided in the APAC Automated Material Handling and Storage Systems Industry report?
While the report offers comprehensive insights, it's advisable to review the specific contents or supplementary materials provided to ascertain if additional resources or data are available.
14. How can I stay updated on further developments or reports in the APAC Automated Material Handling and Storage Systems Industry?
To stay informed about further developments, trends, and reports in the APAC Automated Material Handling and Storage Systems Industry, consider subscribing to industry newsletters, following relevant companies and organizations, or regularly checking reputable industry news sources and publications.
Methodology
Step 1 - Identification of Relevant Samples Size from Population Database


Step 2 - Approaches for Defining Global Market Size (Value, Volume* & Price*)

Note*: In applicable scenarios
Step 3 - Data Sources
Primary Research
- Web Analytics
- Survey Reports
- Research Institute
- Latest Research Reports
- Opinion Leaders
Secondary Research
- Annual Reports
- White Paper
- Latest Press Release
- Industry Association
- Paid Database
- Investor Presentations

Step 4 - Data Triangulation
Involves using different sources of information in order to increase the validity of a study
These sources are likely to be stakeholders in a program - participants, other researchers, program staff, other community members, and so on.
Then we put all data in single framework & apply various statistical tools to find out the dynamic on the market.
During the analysis stage, feedback from the stakeholder groups would be compared to determine areas of agreement as well as areas of divergence


