
Key Insights
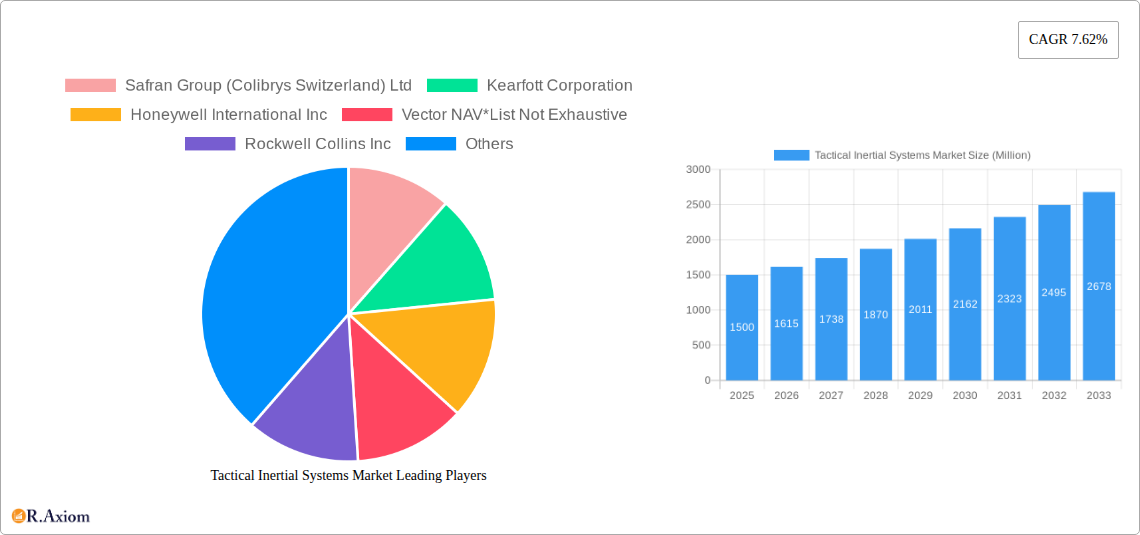
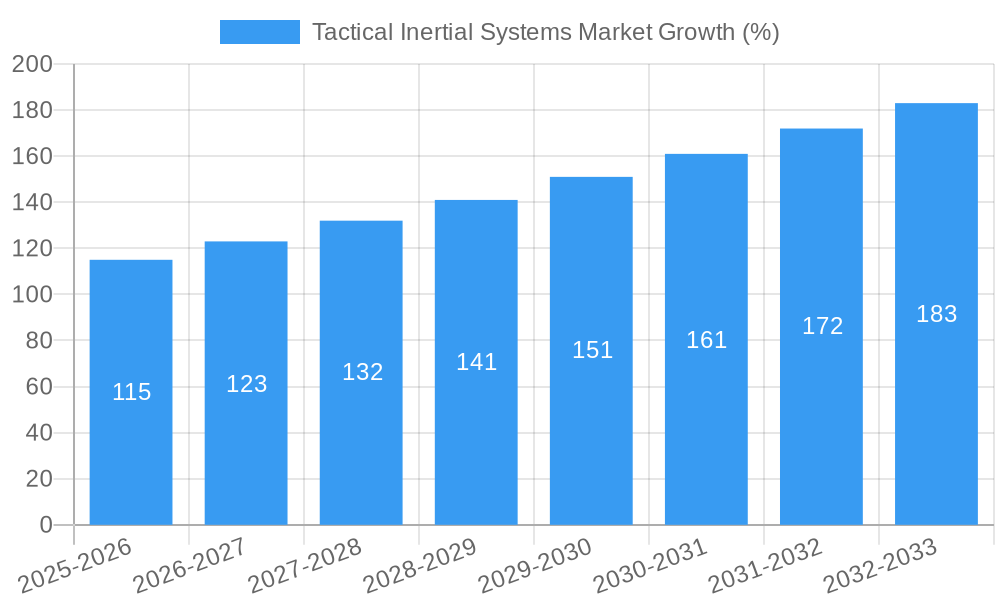
The Tactical Inertial Navigation Systems (TINS) market is experiencing robust growth, driven by increasing demand from aerospace and defense, and marine/naval sectors. The market's Compound Annual Growth Rate (CAGR) of 7.62% from 2019 to 2024 suggests a substantial expansion, projected to continue through 2033. Key drivers include the rising adoption of advanced technologies like MEMS, FOG, and RLG gyroscopes for enhanced precision and reliability in navigation and guidance systems. Furthermore, the miniaturization of components like accelerometers and magnetometers enables integration into smaller, more versatile platforms, fueling market growth. The increasing need for precise positioning in autonomous vehicles, drones, and unmanned underwater vehicles (UUVs) further contributes to the market's expansion. While the market faces restraints such as high initial investment costs and complex integration processes, the strategic advantages offered by TINS in mission-critical applications outweigh these challenges. The market segmentation reveals a significant share held by the aerospace and defense sectors, followed by the marine/naval industry. MEMS technology currently dominates the technology segment, owing to its cost-effectiveness and miniaturization capabilities; however, FOG and RLG technologies are expected to gain traction due to their superior performance in challenging environments. Leading companies like Safran, Honeywell, and Thales are actively involved in developing and supplying advanced TINS solutions, driving innovation and competition within the market. The geographic distribution indicates strong growth across North America, Europe, and Asia-Pacific, with these regions expected to remain key contributors to the market's overall expansion.
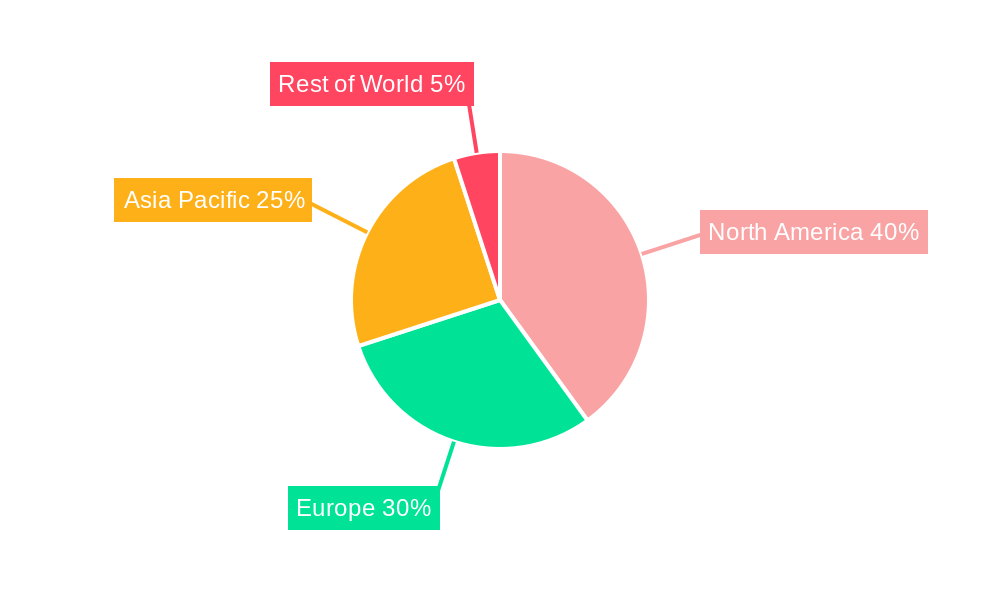
The North American region currently holds the largest market share, driven by substantial defense budgets and technological advancements. However, the Asia-Pacific region is projected to witness the highest growth rate in the coming years, fueled by increasing investments in military modernization and technological advancements. The European market demonstrates consistent growth, driven by both defense and civilian applications of TINS. Further regional analysis reveals variations in growth trajectories due to differences in government regulations, defense spending, and technological adoption rates. Overall, the TINS market is poised for continued growth, with opportunities for innovation and expansion across various segments and geographic regions. This robust market growth is expected to be sustained through the forecast period due to continued investment in military and civilian applications that benefit from the precision and reliability of tactical inertial systems.
Tactical Inertial Systems Market: A Comprehensive Report (2019-2033)
This in-depth report provides a comprehensive analysis of the Tactical Inertial Systems market, covering market size, segmentation, growth drivers, challenges, opportunities, and key players. The study period spans from 2019 to 2033, with 2025 serving as the base and estimated year. The report leverages extensive primary and secondary research to offer actionable insights for industry stakeholders, investors, and strategic decision-makers. The market is segmented by end-user (Aerospace and Defense, Marine/Naval), technology (MEMs, Fiber Optic Gyro (FOG), Ring Laser Gyro (RLG), Other Technologies), and component (Accelerometers, Magnetometers, Gyroscopes, Other Components).
Tactical Inertial Systems Market Concentration & Innovation
This section analyzes the competitive landscape of the Tactical Inertial Systems market, examining market concentration, innovation drivers, regulatory frameworks, product substitutes, end-user trends, and M&A activities.
The market exhibits a moderately concentrated structure with a few dominant players holding significant market share. Safran Group (Colibrys Switzerland) Ltd, Honeywell International Inc, and Thales Group are among the key players, though precise market share figures are proprietary to the full report. The xx% market share held by the top 5 players highlights the consolidation witnessed within this sector. Innovation is driven by the increasing demand for high-precision, miniaturized, and low-power inertial measurement units (IMUs) across various applications.
- Regulatory Frameworks: Stringent regulations regarding safety and performance standards, particularly within the aerospace and defense sectors, significantly impact market growth and technological advancements.
- Product Substitutes: While other navigation technologies exist (e.g., GPS), Tactical Inertial Systems offer crucial advantages in GPS-denied environments, ensuring continuous market demand.
- End-User Trends: The growing demand for autonomous systems and advanced navigation capabilities across both military and commercial sectors fuels market expansion.
- M&A Activities: Recent years have seen several mergers and acquisitions, often driven by companies seeking to expand their product portfolios and geographic reach. The total value of these transactions between 2019 and 2024 is estimated at xx Million. Specific deal values are detailed in the full report. Examples of M&A activities and their impact on the market are detailed within the full report.
Tactical Inertial Systems Market Industry Trends & Insights
The Tactical Inertial Systems market is experiencing robust growth, driven by several key factors. The market is projected to exhibit a Compound Annual Growth Rate (CAGR) of xx% during the forecast period (2025-2033), reaching a market value of xx Million by 2033. This growth is primarily attributed to rising defense budgets globally, increased demand for autonomous vehicles, and the technological advancements in MEMS and fiber optic gyro technologies. The market penetration of MEMS-based IMUs continues to rise due to their cost-effectiveness and miniaturization potential. However, the high cost and complexity associated with FOG and RLG systems limit their widespread adoption in certain applications. Competitive dynamics are intense, with existing players focusing on innovation, partnerships, and strategic acquisitions to strengthen their market positions.
Dominant Markets & Segments in Tactical Inertial Systems Market
The Aerospace and Defense segment dominates the Tactical Inertial Systems market, accounting for xx% of the total market value in 2025. This dominance is driven by the extensive use of inertial navigation systems in military aircraft, missiles, and unmanned aerial vehicles (UAVs). The Marine/Naval sector is another significant end-user segment, fueled by the growing adoption of advanced navigation technologies for autonomous underwater vehicles (AUVs) and surface vessels.
Key Drivers for Aerospace & Defense Dominance:
- High defense spending by major global powers.
- The increasing demand for precise navigation in military operations.
- Stringent requirements for reliable and robust navigation systems.
Key Drivers for Marine/Naval Segment Growth:
- Growing demand for autonomous underwater and surface vessels.
- Investments in naval modernization programs.
- The need for enhanced navigational accuracy and reliability in maritime operations.
Within the technology segment, MEMS-based inertial sensors currently hold the largest market share, primarily due to their cost-effectiveness and miniaturization capabilities. However, FOG and RLG systems are expected to witness significant growth driven by the demand for high-accuracy applications in defense and aerospace. The Accelerometer segment, due to its critical role in various applications, maintains a sizable market share within the component segment.
Tactical Inertial Systems Market Product Developments
Recent advancements in Tactical Inertial Systems focus on developing smaller, lighter, more energy-efficient, and higher-accuracy IMUs using advanced MEMS and FOG technologies. These innovations are aimed at enhancing the performance of autonomous vehicles, UAVs, and other applications that require high precision in navigation and positioning. The integration of advanced algorithms and sensor fusion techniques is also improving the accuracy and reliability of inertial navigation systems. This enhances market fit by allowing for deployment in challenging operational environments.
Report Scope & Segmentation Analysis
This report comprehensively analyzes the Tactical Inertial Systems market across various segments.
End User: Aerospace and Defense, Marine/Naval. The aerospace and defense segment is projected to grow at a CAGR of xx% from 2025 to 2033 due to increased defense budgets and demand for sophisticated navigation systems. The marine/naval segment is expected to grow at a CAGR of xx% driven by the adoption of autonomous navigation systems.
Technology: MEMS, Fiber Optic Gyro (FOG), Ring Laser Gyro (RLG), Other Technologies. The MEMS segment, due to its cost advantage, is the largest segment, but the FOG and RLG segments are expected to grow rapidly due to their higher accuracy.
Component: Accelerometers, Magnetometers, Gyroscopes, Other Components. Accelerometers and gyroscopes are the dominant components within this market. Each segment's growth trajectories and competitive dynamics are further explored within the full report.
Key Drivers of Tactical Inertial Systems Market Growth
The Tactical Inertial Systems market is driven by several factors, including: increasing demand for autonomous systems (driving the need for reliable inertial navigation); technological advancements in MEMS, FOG, and RLG technology (resulting in smaller, lighter, and more energy-efficient systems); and the rising defense budgets globally (particularly in major military powers). Government investments in research and development within the navigation and guidance systems sector further augment growth.
Challenges in the Tactical Inertial Systems Market Sector
The Tactical Inertial Systems market faces several challenges, including the high cost of FOG and RLG technologies; stringent regulatory requirements; and intense competition among established players. Supply chain disruptions can also impact production and delivery timelines. Furthermore, the market's susceptibility to economic downturns remains a considerable concern.
Emerging Opportunities in Tactical Inertial Systems Market
The market presents numerous opportunities, including the growing adoption of autonomous vehicles across diverse sectors; the expanding market for UAVs and other unmanned systems; and the development of high-accuracy, low-power consumption inertial sensors for various applications. The integration of advanced AI and machine learning algorithms into inertial navigation systems offers significant potential for further market expansion.
Leading Players in the Tactical Inertial Systems Market Market
- Safran Group (Colibrys Switzerland) Ltd
- Kearfott Corporation
- Honeywell International Inc
- Vector NAV
- Rockwell Collins Inc
- Sparton Corporation
- Xsens Technologies BV
- Thales Group
- Invensense Inc (TDK Corporation)
- KVH Industries Inc
- Epson Europe Electronic
- Ixblue
- Analog Devices Inc
- Northrop Grumman Corporation
Key Developments in Tactical Inertial Systems Market Industry
- July 2022: Honeywell and Civitanavi Systems announced a collaboration to develop inertial measurement units (IMU), attitude heading reference systems, and inertial navigation systems for commercial and defense applications. This partnership expands product offerings and market reach.
- January 2023: TDK Corporation launched a new IMU (IIM-20670) targeting industrial applications requiring extreme stability. This enhances the InvenSense SmartIndustrial sensor platform, driving adoption in new market sectors.
Strategic Outlook for Tactical Inertial Systems Market Market
The Tactical Inertial Systems market is poised for sustained growth, driven by ongoing technological advancements, increasing demand across various sectors, and rising defense spending. Strategic partnerships, acquisitions, and continuous product innovation will be crucial for companies to maintain a competitive edge in this rapidly evolving market. The market's future potential is significant, with opportunities for growth across diverse end-user segments and applications.
Tactical Inertial Systems Market Segmentation
-
1. End User
- 1.1. Aerospace and Defense
- 1.2. Marine/Naval
-
2. Technology
- 2.1. MEMs
- 2.2. Fiber Optic Gyro (FOG)
- 2.3. Ring Laser Gyro (RLG)
- 2.4. Other Technologies
-
3. Component
- 3.1. Accelerometers
- 3.2. Magnetometers
- 3.3. Gyroscopes
- 3.4. Other Components
Tactical Inertial Systems Market Segmentation By Geography
-
1. North America
- 1.1. United States
- 1.2. Canada
-
2. Europe
- 2.1. United Kingdom
- 2.2. Germany
- 2.3. France
- 2.4. Rest of Europe
-
3. Asia Pacific
- 3.1. China
- 3.2. India
- 3.3. Japan
- 3.4. Rest of Asia Pacific
-
4. Rest of the World
- 4.1. Latin America
- 4.2. Middle East and Africa
Tactical Inertial Systems Market REPORT HIGHLIGHTS
| Aspects | Details |
|---|---|
| Study Period | 2019-2033 |
| Base Year | 2024 |
| Estimated Year | 2025 |
| Forecast Period | 2025-2033 |
| Historical Period | 2019-2024 |
| Growth Rate | CAGR of 7.62% from 2019-2033 |
| Segmentation |
|
Table of Contents
- 1. Introduction
- 1.1. Research Scope
- 1.2. Market Segmentation
- 1.3. Research Methodology
- 1.4. Definitions and Assumptions
- 2. Executive Summary
- 2.1. Introduction
- 3. Market Dynamics
- 3.1. Introduction
- 3.2. Market Drivers
- 3.2.1. Inclination of Growth in Defense and Aerospace
- 3.3. Market Restrains
- 3.3.1. Operational Complexity Coupled with High Maintenance Costs
- 3.4. Market Trends
- 3.4.1. The Accelerometer Segment is Expected to Hold the Highest Market Share
- 4. Market Factor Analysis
- 4.1. Porters Five Forces
- 4.2. Supply/Value Chain
- 4.3. PESTEL analysis
- 4.4. Market Entropy
- 4.5. Patent/Trademark Analysis
- 5. Global Tactical Inertial Systems Market Analysis, Insights and Forecast, 2019-2031
- 5.1. Market Analysis, Insights and Forecast - by End User
- 5.1.1. Aerospace and Defense
- 5.1.2. Marine/Naval
- 5.2. Market Analysis, Insights and Forecast - by Technology
- 5.2.1. MEMs
- 5.2.2. Fiber Optic Gyro (FOG)
- 5.2.3. Ring Laser Gyro (RLG)
- 5.2.4. Other Technologies
- 5.3. Market Analysis, Insights and Forecast - by Component
- 5.3.1. Accelerometers
- 5.3.2. Magnetometers
- 5.3.3. Gyroscopes
- 5.3.4. Other Components
- 5.4. Market Analysis, Insights and Forecast - by Region
- 5.4.1. North America
- 5.4.2. Europe
- 5.4.3. Asia Pacific
- 5.4.4. Rest of the World
- 5.1. Market Analysis, Insights and Forecast - by End User
- 6. North America Tactical Inertial Systems Market Analysis, Insights and Forecast, 2019-2031
- 6.1. Market Analysis, Insights and Forecast - by End User
- 6.1.1. Aerospace and Defense
- 6.1.2. Marine/Naval
- 6.2. Market Analysis, Insights and Forecast - by Technology
- 6.2.1. MEMs
- 6.2.2. Fiber Optic Gyro (FOG)
- 6.2.3. Ring Laser Gyro (RLG)
- 6.2.4. Other Technologies
- 6.3. Market Analysis, Insights and Forecast - by Component
- 6.3.1. Accelerometers
- 6.3.2. Magnetometers
- 6.3.3. Gyroscopes
- 6.3.4. Other Components
- 6.1. Market Analysis, Insights and Forecast - by End User
- 7. Europe Tactical Inertial Systems Market Analysis, Insights and Forecast, 2019-2031
- 7.1. Market Analysis, Insights and Forecast - by End User
- 7.1.1. Aerospace and Defense
- 7.1.2. Marine/Naval
- 7.2. Market Analysis, Insights and Forecast - by Technology
- 7.2.1. MEMs
- 7.2.2. Fiber Optic Gyro (FOG)
- 7.2.3. Ring Laser Gyro (RLG)
- 7.2.4. Other Technologies
- 7.3. Market Analysis, Insights and Forecast - by Component
- 7.3.1. Accelerometers
- 7.3.2. Magnetometers
- 7.3.3. Gyroscopes
- 7.3.4. Other Components
- 7.1. Market Analysis, Insights and Forecast - by End User
- 8. Asia Pacific Tactical Inertial Systems Market Analysis, Insights and Forecast, 2019-2031
- 8.1. Market Analysis, Insights and Forecast - by End User
- 8.1.1. Aerospace and Defense
- 8.1.2. Marine/Naval
- 8.2. Market Analysis, Insights and Forecast - by Technology
- 8.2.1. MEMs
- 8.2.2. Fiber Optic Gyro (FOG)
- 8.2.3. Ring Laser Gyro (RLG)
- 8.2.4. Other Technologies
- 8.3. Market Analysis, Insights and Forecast - by Component
- 8.3.1. Accelerometers
- 8.3.2. Magnetometers
- 8.3.3. Gyroscopes
- 8.3.4. Other Components
- 8.1. Market Analysis, Insights and Forecast - by End User
- 9. Rest of the World Tactical Inertial Systems Market Analysis, Insights and Forecast, 2019-2031
- 9.1. Market Analysis, Insights and Forecast - by End User
- 9.1.1. Aerospace and Defense
- 9.1.2. Marine/Naval
- 9.2. Market Analysis, Insights and Forecast - by Technology
- 9.2.1. MEMs
- 9.2.2. Fiber Optic Gyro (FOG)
- 9.2.3. Ring Laser Gyro (RLG)
- 9.2.4. Other Technologies
- 9.3. Market Analysis, Insights and Forecast - by Component
- 9.3.1. Accelerometers
- 9.3.2. Magnetometers
- 9.3.3. Gyroscopes
- 9.3.4. Other Components
- 9.1. Market Analysis, Insights and Forecast - by End User
- 10. North America Tactical Inertial Systems Market Analysis, Insights and Forecast, 2019-2031
- 10.1. Market Analysis, Insights and Forecast - By Country/Sub-region
- 10.1.1 United States
- 10.1.2 Canada
- 10.1.3 Mexico
- 11. Europe Tactical Inertial Systems Market Analysis, Insights and Forecast, 2019-2031
- 11.1. Market Analysis, Insights and Forecast - By Country/Sub-region
- 11.1.1 Germany
- 11.1.2 United Kingdom
- 11.1.3 France
- 11.1.4 Spain
- 11.1.5 Italy
- 11.1.6 Spain
- 11.1.7 Belgium
- 11.1.8 Netherland
- 11.1.9 Nordics
- 11.1.10 Rest of Europe
- 12. Asia Pacific Tactical Inertial Systems Market Analysis, Insights and Forecast, 2019-2031
- 12.1. Market Analysis, Insights and Forecast - By Country/Sub-region
- 12.1.1 China
- 12.1.2 Japan
- 12.1.3 India
- 12.1.4 South Korea
- 12.1.5 Southeast Asia
- 12.1.6 Australia
- 12.1.7 Indonesia
- 12.1.8 Phillipes
- 12.1.9 Singapore
- 12.1.10 Thailandc
- 12.1.11 Rest of Asia Pacific
- 13. South America Tactical Inertial Systems Market Analysis, Insights and Forecast, 2019-2031
- 13.1. Market Analysis, Insights and Forecast - By Country/Sub-region
- 13.1.1 Brazil
- 13.1.2 Argentina
- 13.1.3 Peru
- 13.1.4 Chile
- 13.1.5 Colombia
- 13.1.6 Ecuador
- 13.1.7 Venezuela
- 13.1.8 Rest of South America
- 14. North America Tactical Inertial Systems Market Analysis, Insights and Forecast, 2019-2031
- 14.1. Market Analysis, Insights and Forecast - By Country/Sub-region
- 14.1.1 United States
- 14.1.2 Canada
- 14.1.3 Mexico
- 15. MEA Tactical Inertial Systems Market Analysis, Insights and Forecast, 2019-2031
- 15.1. Market Analysis, Insights and Forecast - By Country/Sub-region
- 15.1.1 United Arab Emirates
- 15.1.2 Saudi Arabia
- 15.1.3 South Africa
- 15.1.4 Rest of Middle East and Africa
- 16. Competitive Analysis
- 16.1. Global Market Share Analysis 2024
- 16.2. Company Profiles
- 16.2.1 Safran Group (Colibrys Switzerland) Ltd
- 16.2.1.1. Overview
- 16.2.1.2. Products
- 16.2.1.3. SWOT Analysis
- 16.2.1.4. Recent Developments
- 16.2.1.5. Financials (Based on Availability)
- 16.2.2 Kearfott Corporation
- 16.2.2.1. Overview
- 16.2.2.2. Products
- 16.2.2.3. SWOT Analysis
- 16.2.2.4. Recent Developments
- 16.2.2.5. Financials (Based on Availability)
- 16.2.3 Honeywell International Inc
- 16.2.3.1. Overview
- 16.2.3.2. Products
- 16.2.3.3. SWOT Analysis
- 16.2.3.4. Recent Developments
- 16.2.3.5. Financials (Based on Availability)
- 16.2.4 Vector NAV*List Not Exhaustive
- 16.2.4.1. Overview
- 16.2.4.2. Products
- 16.2.4.3. SWOT Analysis
- 16.2.4.4. Recent Developments
- 16.2.4.5. Financials (Based on Availability)
- 16.2.5 Rockwell Collins Inc
- 16.2.5.1. Overview
- 16.2.5.2. Products
- 16.2.5.3. SWOT Analysis
- 16.2.5.4. Recent Developments
- 16.2.5.5. Financials (Based on Availability)
- 16.2.6 Sparton Corporation
- 16.2.6.1. Overview
- 16.2.6.2. Products
- 16.2.6.3. SWOT Analysis
- 16.2.6.4. Recent Developments
- 16.2.6.5. Financials (Based on Availability)
- 16.2.7 Xsens Technologies BV
- 16.2.7.1. Overview
- 16.2.7.2. Products
- 16.2.7.3. SWOT Analysis
- 16.2.7.4. Recent Developments
- 16.2.7.5. Financials (Based on Availability)
- 16.2.8 Thales Group
- 16.2.8.1. Overview
- 16.2.8.2. Products
- 16.2.8.3. SWOT Analysis
- 16.2.8.4. Recent Developments
- 16.2.8.5. Financials (Based on Availability)
- 16.2.9 Invensense Inc (TDK Corporation)
- 16.2.9.1. Overview
- 16.2.9.2. Products
- 16.2.9.3. SWOT Analysis
- 16.2.9.4. Recent Developments
- 16.2.9.5. Financials (Based on Availability)
- 16.2.10 KVH Industries Inc
- 16.2.10.1. Overview
- 16.2.10.2. Products
- 16.2.10.3. SWOT Analysis
- 16.2.10.4. Recent Developments
- 16.2.10.5. Financials (Based on Availability)
- 16.2.11 Epson Europe Electronic
- 16.2.11.1. Overview
- 16.2.11.2. Products
- 16.2.11.3. SWOT Analysis
- 16.2.11.4. Recent Developments
- 16.2.11.5. Financials (Based on Availability)
- 16.2.12 Ixbluesas
- 16.2.12.1. Overview
- 16.2.12.2. Products
- 16.2.12.3. SWOT Analysis
- 16.2.12.4. Recent Developments
- 16.2.12.5. Financials (Based on Availability)
- 16.2.13 Analog Devices Inc
- 16.2.13.1. Overview
- 16.2.13.2. Products
- 16.2.13.3. SWOT Analysis
- 16.2.13.4. Recent Developments
- 16.2.13.5. Financials (Based on Availability)
- 16.2.14 Northrop Grumman Corporation
- 16.2.14.1. Overview
- 16.2.14.2. Products
- 16.2.14.3. SWOT Analysis
- 16.2.14.4. Recent Developments
- 16.2.14.5. Financials (Based on Availability)
- 16.2.1 Safran Group (Colibrys Switzerland) Ltd
List of Figures
- Figure 1: Global Tactical Inertial Systems Market Revenue Breakdown (Million, %) by Region 2024 & 2032
- Figure 2: North America Tactical Inertial Systems Market Revenue (Million), by Country 2024 & 2032
- Figure 3: North America Tactical Inertial Systems Market Revenue Share (%), by Country 2024 & 2032
- Figure 4: Europe Tactical Inertial Systems Market Revenue (Million), by Country 2024 & 2032
- Figure 5: Europe Tactical Inertial Systems Market Revenue Share (%), by Country 2024 & 2032
- Figure 6: Asia Pacific Tactical Inertial Systems Market Revenue (Million), by Country 2024 & 2032
- Figure 7: Asia Pacific Tactical Inertial Systems Market Revenue Share (%), by Country 2024 & 2032
- Figure 8: South America Tactical Inertial Systems Market Revenue (Million), by Country 2024 & 2032
- Figure 9: South America Tactical Inertial Systems Market Revenue Share (%), by Country 2024 & 2032
- Figure 10: North America Tactical Inertial Systems Market Revenue (Million), by Country 2024 & 2032
- Figure 11: North America Tactical Inertial Systems Market Revenue Share (%), by Country 2024 & 2032
- Figure 12: MEA Tactical Inertial Systems Market Revenue (Million), by Country 2024 & 2032
- Figure 13: MEA Tactical Inertial Systems Market Revenue Share (%), by Country 2024 & 2032
- Figure 14: North America Tactical Inertial Systems Market Revenue (Million), by End User 2024 & 2032
- Figure 15: North America Tactical Inertial Systems Market Revenue Share (%), by End User 2024 & 2032
- Figure 16: North America Tactical Inertial Systems Market Revenue (Million), by Technology 2024 & 2032
- Figure 17: North America Tactical Inertial Systems Market Revenue Share (%), by Technology 2024 & 2032
- Figure 18: North America Tactical Inertial Systems Market Revenue (Million), by Component 2024 & 2032
- Figure 19: North America Tactical Inertial Systems Market Revenue Share (%), by Component 2024 & 2032
- Figure 20: North America Tactical Inertial Systems Market Revenue (Million), by Country 2024 & 2032
- Figure 21: North America Tactical Inertial Systems Market Revenue Share (%), by Country 2024 & 2032
- Figure 22: Europe Tactical Inertial Systems Market Revenue (Million), by End User 2024 & 2032
- Figure 23: Europe Tactical Inertial Systems Market Revenue Share (%), by End User 2024 & 2032
- Figure 24: Europe Tactical Inertial Systems Market Revenue (Million), by Technology 2024 & 2032
- Figure 25: Europe Tactical Inertial Systems Market Revenue Share (%), by Technology 2024 & 2032
- Figure 26: Europe Tactical Inertial Systems Market Revenue (Million), by Component 2024 & 2032
- Figure 27: Europe Tactical Inertial Systems Market Revenue Share (%), by Component 2024 & 2032
- Figure 28: Europe Tactical Inertial Systems Market Revenue (Million), by Country 2024 & 2032
- Figure 29: Europe Tactical Inertial Systems Market Revenue Share (%), by Country 2024 & 2032
- Figure 30: Asia Pacific Tactical Inertial Systems Market Revenue (Million), by End User 2024 & 2032
- Figure 31: Asia Pacific Tactical Inertial Systems Market Revenue Share (%), by End User 2024 & 2032
- Figure 32: Asia Pacific Tactical Inertial Systems Market Revenue (Million), by Technology 2024 & 2032
- Figure 33: Asia Pacific Tactical Inertial Systems Market Revenue Share (%), by Technology 2024 & 2032
- Figure 34: Asia Pacific Tactical Inertial Systems Market Revenue (Million), by Component 2024 & 2032
- Figure 35: Asia Pacific Tactical Inertial Systems Market Revenue Share (%), by Component 2024 & 2032
- Figure 36: Asia Pacific Tactical Inertial Systems Market Revenue (Million), by Country 2024 & 2032
- Figure 37: Asia Pacific Tactical Inertial Systems Market Revenue Share (%), by Country 2024 & 2032
- Figure 38: Rest of the World Tactical Inertial Systems Market Revenue (Million), by End User 2024 & 2032
- Figure 39: Rest of the World Tactical Inertial Systems Market Revenue Share (%), by End User 2024 & 2032
- Figure 40: Rest of the World Tactical Inertial Systems Market Revenue (Million), by Technology 2024 & 2032
- Figure 41: Rest of the World Tactical Inertial Systems Market Revenue Share (%), by Technology 2024 & 2032
- Figure 42: Rest of the World Tactical Inertial Systems Market Revenue (Million), by Component 2024 & 2032
- Figure 43: Rest of the World Tactical Inertial Systems Market Revenue Share (%), by Component 2024 & 2032
- Figure 44: Rest of the World Tactical Inertial Systems Market Revenue (Million), by Country 2024 & 2032
- Figure 45: Rest of the World Tactical Inertial Systems Market Revenue Share (%), by Country 2024 & 2032
List of Tables
- Table 1: Global Tactical Inertial Systems Market Revenue Million Forecast, by Region 2019 & 2032
- Table 2: Global Tactical Inertial Systems Market Revenue Million Forecast, by End User 2019 & 2032
- Table 3: Global Tactical Inertial Systems Market Revenue Million Forecast, by Technology 2019 & 2032
- Table 4: Global Tactical Inertial Systems Market Revenue Million Forecast, by Component 2019 & 2032
- Table 5: Global Tactical Inertial Systems Market Revenue Million Forecast, by Region 2019 & 2032
- Table 6: Global Tactical Inertial Systems Market Revenue Million Forecast, by Country 2019 & 2032
- Table 7: United States Tactical Inertial Systems Market Revenue (Million) Forecast, by Application 2019 & 2032
- Table 8: Canada Tactical Inertial Systems Market Revenue (Million) Forecast, by Application 2019 & 2032
- Table 9: Mexico Tactical Inertial Systems Market Revenue (Million) Forecast, by Application 2019 & 2032
- Table 10: Global Tactical Inertial Systems Market Revenue Million Forecast, by Country 2019 & 2032
- Table 11: Germany Tactical Inertial Systems Market Revenue (Million) Forecast, by Application 2019 & 2032
- Table 12: United Kingdom Tactical Inertial Systems Market Revenue (Million) Forecast, by Application 2019 & 2032
- Table 13: France Tactical Inertial Systems Market Revenue (Million) Forecast, by Application 2019 & 2032
- Table 14: Spain Tactical Inertial Systems Market Revenue (Million) Forecast, by Application 2019 & 2032
- Table 15: Italy Tactical Inertial Systems Market Revenue (Million) Forecast, by Application 2019 & 2032
- Table 16: Spain Tactical Inertial Systems Market Revenue (Million) Forecast, by Application 2019 & 2032
- Table 17: Belgium Tactical Inertial Systems Market Revenue (Million) Forecast, by Application 2019 & 2032
- Table 18: Netherland Tactical Inertial Systems Market Revenue (Million) Forecast, by Application 2019 & 2032
- Table 19: Nordics Tactical Inertial Systems Market Revenue (Million) Forecast, by Application 2019 & 2032
- Table 20: Rest of Europe Tactical Inertial Systems Market Revenue (Million) Forecast, by Application 2019 & 2032
- Table 21: Global Tactical Inertial Systems Market Revenue Million Forecast, by Country 2019 & 2032
- Table 22: China Tactical Inertial Systems Market Revenue (Million) Forecast, by Application 2019 & 2032
- Table 23: Japan Tactical Inertial Systems Market Revenue (Million) Forecast, by Application 2019 & 2032
- Table 24: India Tactical Inertial Systems Market Revenue (Million) Forecast, by Application 2019 & 2032
- Table 25: South Korea Tactical Inertial Systems Market Revenue (Million) Forecast, by Application 2019 & 2032
- Table 26: Southeast Asia Tactical Inertial Systems Market Revenue (Million) Forecast, by Application 2019 & 2032
- Table 27: Australia Tactical Inertial Systems Market Revenue (Million) Forecast, by Application 2019 & 2032
- Table 28: Indonesia Tactical Inertial Systems Market Revenue (Million) Forecast, by Application 2019 & 2032
- Table 29: Phillipes Tactical Inertial Systems Market Revenue (Million) Forecast, by Application 2019 & 2032
- Table 30: Singapore Tactical Inertial Systems Market Revenue (Million) Forecast, by Application 2019 & 2032
- Table 31: Thailandc Tactical Inertial Systems Market Revenue (Million) Forecast, by Application 2019 & 2032
- Table 32: Rest of Asia Pacific Tactical Inertial Systems Market Revenue (Million) Forecast, by Application 2019 & 2032
- Table 33: Global Tactical Inertial Systems Market Revenue Million Forecast, by Country 2019 & 2032
- Table 34: Brazil Tactical Inertial Systems Market Revenue (Million) Forecast, by Application 2019 & 2032
- Table 35: Argentina Tactical Inertial Systems Market Revenue (Million) Forecast, by Application 2019 & 2032
- Table 36: Peru Tactical Inertial Systems Market Revenue (Million) Forecast, by Application 2019 & 2032
- Table 37: Chile Tactical Inertial Systems Market Revenue (Million) Forecast, by Application 2019 & 2032
- Table 38: Colombia Tactical Inertial Systems Market Revenue (Million) Forecast, by Application 2019 & 2032
- Table 39: Ecuador Tactical Inertial Systems Market Revenue (Million) Forecast, by Application 2019 & 2032
- Table 40: Venezuela Tactical Inertial Systems Market Revenue (Million) Forecast, by Application 2019 & 2032
- Table 41: Rest of South America Tactical Inertial Systems Market Revenue (Million) Forecast, by Application 2019 & 2032
- Table 42: Global Tactical Inertial Systems Market Revenue Million Forecast, by Country 2019 & 2032
- Table 43: United States Tactical Inertial Systems Market Revenue (Million) Forecast, by Application 2019 & 2032
- Table 44: Canada Tactical Inertial Systems Market Revenue (Million) Forecast, by Application 2019 & 2032
- Table 45: Mexico Tactical Inertial Systems Market Revenue (Million) Forecast, by Application 2019 & 2032
- Table 46: Global Tactical Inertial Systems Market Revenue Million Forecast, by Country 2019 & 2032
- Table 47: United Arab Emirates Tactical Inertial Systems Market Revenue (Million) Forecast, by Application 2019 & 2032
- Table 48: Saudi Arabia Tactical Inertial Systems Market Revenue (Million) Forecast, by Application 2019 & 2032
- Table 49: South Africa Tactical Inertial Systems Market Revenue (Million) Forecast, by Application 2019 & 2032
- Table 50: Rest of Middle East and Africa Tactical Inertial Systems Market Revenue (Million) Forecast, by Application 2019 & 2032
- Table 51: Global Tactical Inertial Systems Market Revenue Million Forecast, by End User 2019 & 2032
- Table 52: Global Tactical Inertial Systems Market Revenue Million Forecast, by Technology 2019 & 2032
- Table 53: Global Tactical Inertial Systems Market Revenue Million Forecast, by Component 2019 & 2032
- Table 54: Global Tactical Inertial Systems Market Revenue Million Forecast, by Country 2019 & 2032
- Table 55: United States Tactical Inertial Systems Market Revenue (Million) Forecast, by Application 2019 & 2032
- Table 56: Canada Tactical Inertial Systems Market Revenue (Million) Forecast, by Application 2019 & 2032
- Table 57: Global Tactical Inertial Systems Market Revenue Million Forecast, by End User 2019 & 2032
- Table 58: Global Tactical Inertial Systems Market Revenue Million Forecast, by Technology 2019 & 2032
- Table 59: Global Tactical Inertial Systems Market Revenue Million Forecast, by Component 2019 & 2032
- Table 60: Global Tactical Inertial Systems Market Revenue Million Forecast, by Country 2019 & 2032
- Table 61: United Kingdom Tactical Inertial Systems Market Revenue (Million) Forecast, by Application 2019 & 2032
- Table 62: Germany Tactical Inertial Systems Market Revenue (Million) Forecast, by Application 2019 & 2032
- Table 63: France Tactical Inertial Systems Market Revenue (Million) Forecast, by Application 2019 & 2032
- Table 64: Rest of Europe Tactical Inertial Systems Market Revenue (Million) Forecast, by Application 2019 & 2032
- Table 65: Global Tactical Inertial Systems Market Revenue Million Forecast, by End User 2019 & 2032
- Table 66: Global Tactical Inertial Systems Market Revenue Million Forecast, by Technology 2019 & 2032
- Table 67: Global Tactical Inertial Systems Market Revenue Million Forecast, by Component 2019 & 2032
- Table 68: Global Tactical Inertial Systems Market Revenue Million Forecast, by Country 2019 & 2032
- Table 69: China Tactical Inertial Systems Market Revenue (Million) Forecast, by Application 2019 & 2032
- Table 70: India Tactical Inertial Systems Market Revenue (Million) Forecast, by Application 2019 & 2032
- Table 71: Japan Tactical Inertial Systems Market Revenue (Million) Forecast, by Application 2019 & 2032
- Table 72: Rest of Asia Pacific Tactical Inertial Systems Market Revenue (Million) Forecast, by Application 2019 & 2032
- Table 73: Global Tactical Inertial Systems Market Revenue Million Forecast, by End User 2019 & 2032
- Table 74: Global Tactical Inertial Systems Market Revenue Million Forecast, by Technology 2019 & 2032
- Table 75: Global Tactical Inertial Systems Market Revenue Million Forecast, by Component 2019 & 2032
- Table 76: Global Tactical Inertial Systems Market Revenue Million Forecast, by Country 2019 & 2032
- Table 77: Latin America Tactical Inertial Systems Market Revenue (Million) Forecast, by Application 2019 & 2032
- Table 78: Middle East and Africa Tactical Inertial Systems Market Revenue (Million) Forecast, by Application 2019 & 2032
Frequently Asked Questions
1. What is the projected Compound Annual Growth Rate (CAGR) of the Tactical Inertial Systems Market?
The projected CAGR is approximately 7.62%.
2. Which companies are prominent players in the Tactical Inertial Systems Market?
Key companies in the market include Safran Group (Colibrys Switzerland) Ltd, Kearfott Corporation, Honeywell International Inc, Vector NAV*List Not Exhaustive, Rockwell Collins Inc, Sparton Corporation, Xsens Technologies BV, Thales Group, Invensense Inc (TDK Corporation), KVH Industries Inc, Epson Europe Electronic, Ixbluesas, Analog Devices Inc, Northrop Grumman Corporation.
3. What are the main segments of the Tactical Inertial Systems Market?
The market segments include End User, Technology, Component.
4. Can you provide details about the market size?
The market size is estimated to be USD XX Million as of 2022.
5. What are some drivers contributing to market growth?
Inclination of Growth in Defense and Aerospace.
6. What are the notable trends driving market growth?
The Accelerometer Segment is Expected to Hold the Highest Market Share.
7. Are there any restraints impacting market growth?
Operational Complexity Coupled with High Maintenance Costs.
8. Can you provide examples of recent developments in the market?
January 2023 - TDK Corporation announced the expansion of the InvenSense SmartIndustrial sensor platform family, with the launch of a new IMU which targets industrial applications that require extreme stability over temperature and great vibration immunity. The IIM-20670 features a robust monolithic 6-axis IMU, 3-axis accelerometer, and 3-axis gyroscope, with shock robustness and the capability to simultaneously measure all the six axes with a current consumption below 10 mA under all operating conditions.
9. What pricing options are available for accessing the report?
Pricing options include single-user, multi-user, and enterprise licenses priced at USD 4750, USD 5250, and USD 8750 respectively.
10. Is the market size provided in terms of value or volume?
The market size is provided in terms of value, measured in Million.
11. Are there any specific market keywords associated with the report?
Yes, the market keyword associated with the report is "Tactical Inertial Systems Market," which aids in identifying and referencing the specific market segment covered.
12. How do I determine which pricing option suits my needs best?
The pricing options vary based on user requirements and access needs. Individual users may opt for single-user licenses, while businesses requiring broader access may choose multi-user or enterprise licenses for cost-effective access to the report.
13. Are there any additional resources or data provided in the Tactical Inertial Systems Market report?
While the report offers comprehensive insights, it's advisable to review the specific contents or supplementary materials provided to ascertain if additional resources or data are available.
14. How can I stay updated on further developments or reports in the Tactical Inertial Systems Market?
To stay informed about further developments, trends, and reports in the Tactical Inertial Systems Market, consider subscribing to industry newsletters, following relevant companies and organizations, or regularly checking reputable industry news sources and publications.
Methodology
Step 1 - Identification of Relevant Samples Size from Population Database


Step 2 - Approaches for Defining Global Market Size (Value, Volume* & Price*)

Note*: In applicable scenarios
Step 3 - Data Sources
Primary Research
- Web Analytics
- Survey Reports
- Research Institute
- Latest Research Reports
- Opinion Leaders
Secondary Research
- Annual Reports
- White Paper
- Latest Press Release
- Industry Association
- Paid Database
- Investor Presentations

Step 4 - Data Triangulation
Involves using different sources of information in order to increase the validity of a study
These sources are likely to be stakeholders in a program - participants, other researchers, program staff, other community members, and so on.
Then we put all data in single framework & apply various statistical tools to find out the dynamic on the market.
During the analysis stage, feedback from the stakeholder groups would be compared to determine areas of agreement as well as areas of divergence


