
Key Insights
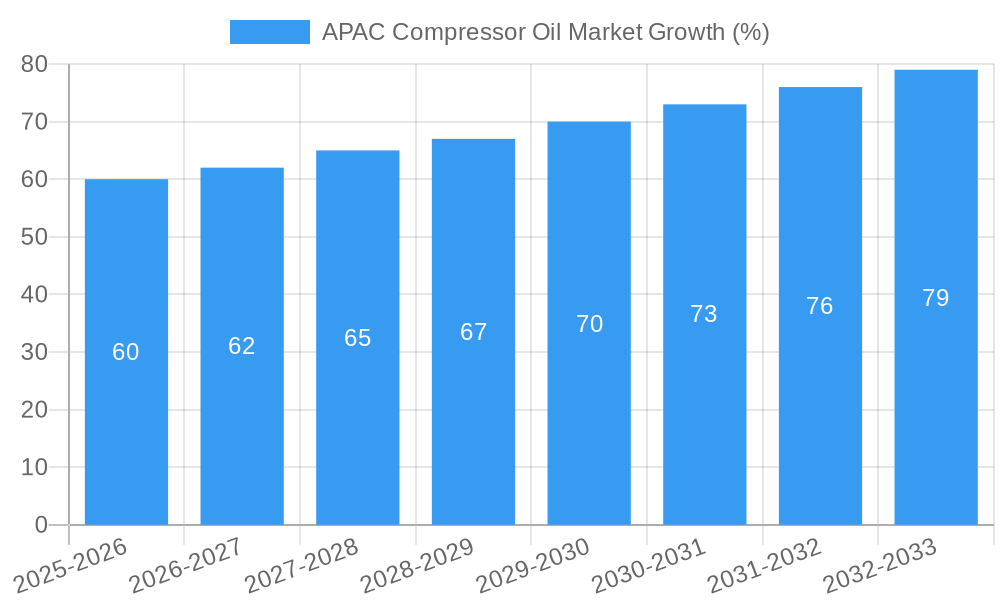
The Asia-Pacific (APAC) compressor oil market presents a compelling growth opportunity, driven by the region's burgeoning industrialization and expanding manufacturing sectors. The market's Compound Annual Growth Rate (CAGR) of 3.97% from 2019-2024 indicates steady expansion, projected to continue into the forecast period (2025-2033). Key drivers include the increasing demand for energy-efficient compressors across diverse industries such as chemical and petrochemical, oil and gas, and manufacturing. The rising adoption of synthetic compressor oils, offering superior performance and extended lifespan compared to mineral oils, further fuels market growth. While economic fluctuations and potential raw material price volatility pose some restraints, the long-term outlook remains positive, particularly given the increasing emphasis on industrial automation and the growth of emerging economies within the APAC region. Significant growth is expected from countries like China, India, and South Korea, fueled by robust industrial expansion and infrastructure development projects. The segmentation of the market into synthetic, mineral, and other base oils reflects the evolving preferences of end-users seeking optimized performance and cost-effectiveness. The diverse end-user industries create a broad base for continued growth, with significant potential within manufacturing, chemical processing, and the energy sector. Competition among major players like Chevron, Sinopec, and Shell is likely to intensify, driving innovation and further shaping market dynamics.
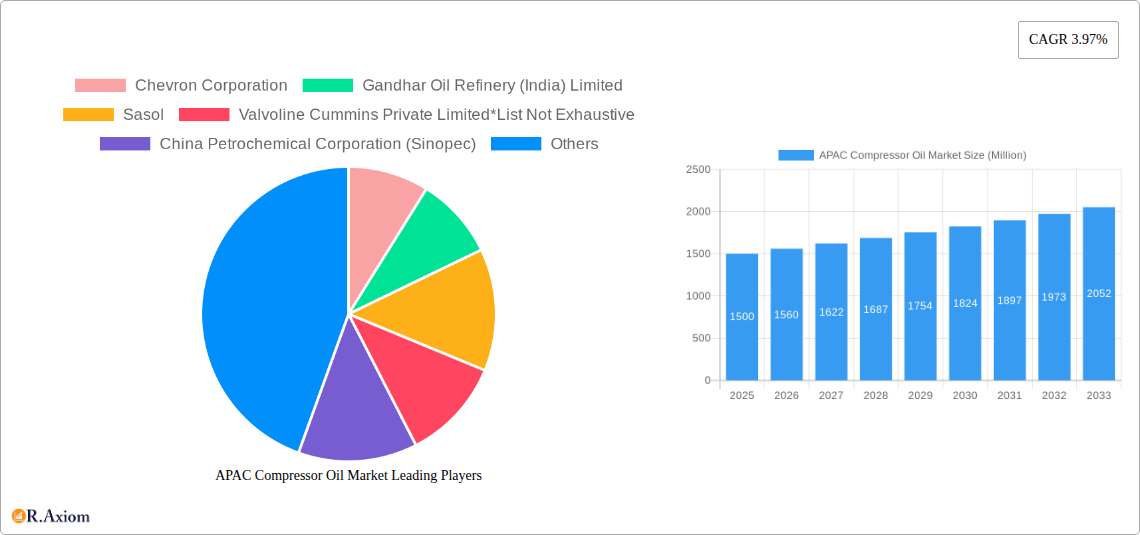
The specific composition of the APAC market within the overall global market size is not provided, preventing a precise numeric analysis. However, given APAC's significant industrial growth and the global CAGR of 3.97%, it's reasonable to estimate that the APAC region accounts for a substantial portion (potentially 30-40%) of the overall market, reflecting its considerable industrial activity. Considering the regional breakdown and global market size (estimated based on industry averages), the projected growth can be extrapolated for APAC. The dominance of key players like Sinopec, a significant player in the Chinese market, further underscores the regional market's considerable size and potential. This estimation accounts for both historical and projected growth, assuming consistent market expansion across the forecast period. Further detailed market research would be required for precise quantification of APAC's market size.
This detailed report provides a comprehensive analysis of the Asia-Pacific (APAC) compressor oil market, offering invaluable insights for industry stakeholders. Covering the period from 2019 to 2033, with a focus on 2025, this report dissects market dynamics, identifies key players, and forecasts future trends. The study incorporates rigorous data analysis, leveraging both historical and projected figures to provide a clear picture of this dynamic market segment.
APAC Compressor Oil Market Market Concentration & Innovation
This section analyzes the competitive landscape of the APAC compressor oil market, examining market concentration, innovation drivers, regulatory influences, and market dynamics. We delve into the impact of mergers and acquisitions (M&A) activities on market share distribution. Key metrics like market share held by leading players and the financial value of significant M&A deals are presented. We evaluate the role of innovation in driving market growth, considering factors such as the development of new formulations (synthetic, biodegradable oils), technological advancements in compressor design, and the introduction of environmentally friendly products. The analysis also considers the influence of regulatory frameworks concerning environmental protection and product safety. Furthermore, we explore the competitive pressures exerted by substitute products and emerging technologies. The shifting preferences of end-users and their impact on market demand are also explored.
- Market Concentration: The APAC compressor oil market exhibits a moderately concentrated structure, with a few major players holding significant market share. xx% of the market is controlled by the top five players.
- Innovation Drivers: The development of high-performance synthetic oils, biodegradable alternatives, and environmentally compliant formulations are key drivers. Technological advancements in compressor technology also influence oil demand.
- Regulatory Frameworks: Environmental regulations play a significant role, driving the adoption of eco-friendly compressor oils. Product safety standards also influence market dynamics.
- Product Substitutes: The presence of alternative lubricants and potential technological advancements could pose a competitive threat.
- End-User Trends: The growth of various end-user industries such as manufacturing, chemical processing, and oil & gas fuels demand for specialized compressor oils.
- M&A Activities: Recent M&A activities have primarily focused on expanding market reach and enhancing product portfolios. The total value of M&A deals in the last five years is estimated at xx Million.
APAC Compressor Oil Market Industry Trends & Insights
This section examines the overarching trends shaping the APAC compressor oil market. We analyze the market's Compound Annual Growth Rate (CAGR) during the historical and forecast periods, examining factors influencing its trajectory. Technological disruptions, evolving consumer preferences (e.g., preference for sustainable products), and the competitive landscape are analyzed in detail. Market penetration rates for different oil types (synthetic vs. mineral) are presented, and the influence of macroeconomic factors is examined.
The APAC compressor oil market is experiencing significant growth driven by increasing industrialization across the region. Demand from key sectors such as manufacturing, oil and gas, and chemical processing is a major growth catalyst. The market penetration of synthetic compressor oils is increasing due to their superior performance characteristics. However, the cost factor continues to influence consumer preference. The CAGR for the market is projected at xx% during the forecast period (2025-2033). The shift towards sustainable and eco-friendly lubricants is also gaining traction. Competitive dynamics involve intense competition among major players, with a focus on brand building, product differentiation, and price competitiveness.
Dominant Markets & Segments in APAC Compressor Oil Market
This section pinpoints the dominant regions, countries, and segments within the APAC compressor oil market. We analyze the factors driving the dominance of specific segments. This includes detailed analyses of market share, growth potential, and influencing factors.
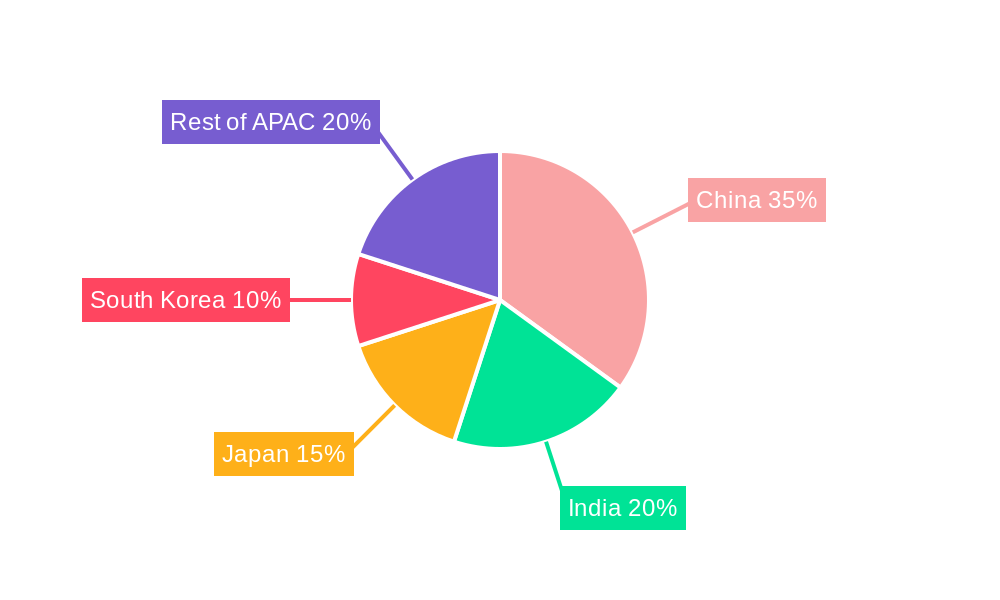
- Leading Region/Country: China is expected to remain the dominant market, driven by its robust industrial growth and expanding manufacturing sector. India also shows substantial growth potential.
- Base Oil Segmentation:
- Synthetic: This segment is experiencing the fastest growth due to superior performance and extended lifespan. Key drivers include technological advancements and higher adoption in demanding applications.
- Mineral: This segment still holds a significant market share, primarily due to its lower cost. However, its growth is slower compared to synthetic oils.
- Other Base Oils: This segment comprises semi-synthetic, biodegradable, and other specialized oils, with increasing demand driven by environmental concerns and specific application needs.
- End-User Industry Segmentation:
- Manufacturing: This segment is the largest consumer of compressor oils, driven by the growth of various manufacturing industries.
- Chemical and Petrochemical: The chemical and petrochemical industry is a significant consumer of compressor oils due to its demanding operational requirements.
- Oil and Gas: This sector utilizes specialized compressor oils for its demanding applications.
- Mining: This sector is a significant user of compressor oils due to the extensive use of compressed air in mining operations.
- Marine: This segment is characterized by a growing demand for high-performance compressor oils suitable for marine environments.
- Other End-User Industries: This includes food processing, power generation, and other industries, with a steady and growing demand for compressor oils.
APAC Compressor Oil Market Product Developments
Recent product developments emphasize the adoption of advanced technologies to enhance performance, extend lifespan, and improve environmental sustainability. This includes the introduction of new synthetic formulations, biodegradable options, and oils designed for specific applications (e.g., high-temperature, dusty environments). These innovations provide competitive advantages by offering enhanced performance, extended equipment lifespan, and reduced maintenance costs. The market is witnessing a clear trend towards specialized compressor oils catering to specific industry needs.
Report Scope & Segmentation Analysis
This report comprehensively analyzes the APAC compressor oil market, segmenting it by base oil type (Synthetic, Mineral, Other Base Oils) and end-user industry (Manufacturing, Chemical and Petrochemical, Oil and Gas, Mining, Marine, Other). Each segment's market size, growth projections, and competitive dynamics are assessed. The report provides a detailed breakdown of the market's composition and anticipates future trends based on current market behavior and growth forecasts.
Key Drivers of APAC Compressor Oil Market Growth
The APAC compressor oil market's growth is driven by several factors: rapid industrialization across the region, increasing demand from key end-user sectors (manufacturing, oil & gas, chemicals), and the growing adoption of advanced compressor technologies. Furthermore, favorable government policies promoting industrial growth contribute positively. The rising awareness of environmental concerns is fueling demand for eco-friendly compressor oils.
Challenges in the APAC Compressor Oil Market Sector
Challenges include fluctuations in crude oil prices, which directly impact production costs. Stringent environmental regulations can increase compliance costs. Intense competition among established players and the emergence of new entrants create competitive pressures. Supply chain disruptions can negatively affect production and distribution, leading to potential shortages and price volatility.
Emerging Opportunities in APAP Compressor Oil Market
Emerging opportunities lie in the growing demand for high-performance synthetic oils, the increasing focus on sustainable and biodegradable options, and the expansion into new and emerging markets within APAC. Technological advancements in compressor technology create opportunities for specialized oil formulations. The increasing focus on energy efficiency creates a demand for compressor oils that improve efficiency.
Leading Players in the APAC Compressor Oil Market Market
- Chevron Corporation
- Gandhar Oil Refinery (India) Limited
- Sasol
- Valvoline Cummins Private Limited
- China Petrochemical Corporation (Sinopec)
- TotalEnergies SE
- HP Lubricants
- Exxon Mobil Corporation
- Shell Plc
- Indian Oil Corporation Ltd
- FUCHS
Key Developments in APAC Compressor Oil Market Industry
- November 2022: Valvoline Cummins Private Limited launched Valcomp Compressor Oil Synth 68, a synthetic oil for extended use in dusty environments.
- April 2023: Exxon Mobil Corporation announced a USD 109.36 Million investment in a lubricant plant in Maharashtra, India, with an annual capacity of 159 Million liters.
Strategic Outlook for APAC Compressor Oil Market Market
The APAC compressor oil market is poised for continued growth, driven by industrial expansion and the increasing adoption of advanced technologies. The shift towards sustainable and eco-friendly lubricants will shape future market dynamics. Opportunities exist for companies that can innovate, offer superior products, and adapt to changing regulatory landscapes. The focus on high-performance and specialized oils will continue to drive growth in the coming years.
APAC Compressor Oil Market Segmentation
-
1. Base Oil
- 1.1. Synthetic
- 1.2. Mineral
- 1.3. Other Ba
-
2. End-User Industry
- 2.1. Manufacturing
- 2.2. Chemical and Petrochemical
- 2.3. Oil and Gas
- 2.4. Mining
- 2.5. Marine
- 2.6. Other En
-
3. Geography
- 3.1. China
- 3.2. India
- 3.3. Japan
- 3.4. South Korea
- 3.5. ASEAN Countries
- 3.6. Rest of Asia-Pacific
APAC Compressor Oil Market Segmentation By Geography
- 1. China
- 2. India
- 3. Japan
- 4. South Korea
- 5. ASEAN Countries
- 6. Rest of Asia Pacific
APAC Compressor Oil Market REPORT HIGHLIGHTS
| Aspects | Details |
|---|---|
| Study Period | 2019-2033 |
| Base Year | 2024 |
| Estimated Year | 2025 |
| Forecast Period | 2025-2033 |
| Historical Period | 2019-2024 |
| Growth Rate | CAGR of 3.97% from 2019-2033 |
| Segmentation |
|
Table of Contents
- 1. Introduction
- 1.1. Research Scope
- 1.2. Market Segmentation
- 1.3. Research Methodology
- 1.4. Definitions and Assumptions
- 2. Executive Summary
- 2.1. Introduction
- 3. Market Dynamics
- 3.1. Introduction
- 3.2. Market Drivers
- 3.2.1. Increasing Investments in the Oil and Gas Industry; Growing Demand from the Manufacturing Industry; Other Drivers
- 3.3. Market Restrains
- 3.3.1. Growing Popularity of Oil Free Compressors; Other Restraints
- 3.4. Market Trends
- 3.4.1. Increasing Investments in the Oil and Gas Industry
- 4. Market Factor Analysis
- 4.1. Porters Five Forces
- 4.2. Supply/Value Chain
- 4.3. PESTEL analysis
- 4.4. Market Entropy
- 4.5. Patent/Trademark Analysis
- 5. Global APAC Compressor Oil Market Analysis, Insights and Forecast, 2019-2031
- 5.1. Market Analysis, Insights and Forecast - by Base Oil
- 5.1.1. Synthetic
- 5.1.2. Mineral
- 5.1.3. Other Ba
- 5.2. Market Analysis, Insights and Forecast - by End-User Industry
- 5.2.1. Manufacturing
- 5.2.2. Chemical and Petrochemical
- 5.2.3. Oil and Gas
- 5.2.4. Mining
- 5.2.5. Marine
- 5.2.6. Other En
- 5.3. Market Analysis, Insights and Forecast - by Geography
- 5.3.1. China
- 5.3.2. India
- 5.3.3. Japan
- 5.3.4. South Korea
- 5.3.5. ASEAN Countries
- 5.3.6. Rest of Asia-Pacific
- 5.4. Market Analysis, Insights and Forecast - by Region
- 5.4.1. China
- 5.4.2. India
- 5.4.3. Japan
- 5.4.4. South Korea
- 5.4.5. ASEAN Countries
- 5.4.6. Rest of Asia Pacific
- 5.1. Market Analysis, Insights and Forecast - by Base Oil
- 6. China APAC Compressor Oil Market Analysis, Insights and Forecast, 2019-2031
- 6.1. Market Analysis, Insights and Forecast - by Base Oil
- 6.1.1. Synthetic
- 6.1.2. Mineral
- 6.1.3. Other Ba
- 6.2. Market Analysis, Insights and Forecast - by End-User Industry
- 6.2.1. Manufacturing
- 6.2.2. Chemical and Petrochemical
- 6.2.3. Oil and Gas
- 6.2.4. Mining
- 6.2.5. Marine
- 6.2.6. Other En
- 6.3. Market Analysis, Insights and Forecast - by Geography
- 6.3.1. China
- 6.3.2. India
- 6.3.3. Japan
- 6.3.4. South Korea
- 6.3.5. ASEAN Countries
- 6.3.6. Rest of Asia-Pacific
- 6.1. Market Analysis, Insights and Forecast - by Base Oil
- 7. India APAC Compressor Oil Market Analysis, Insights and Forecast, 2019-2031
- 7.1. Market Analysis, Insights and Forecast - by Base Oil
- 7.1.1. Synthetic
- 7.1.2. Mineral
- 7.1.3. Other Ba
- 7.2. Market Analysis, Insights and Forecast - by End-User Industry
- 7.2.1. Manufacturing
- 7.2.2. Chemical and Petrochemical
- 7.2.3. Oil and Gas
- 7.2.4. Mining
- 7.2.5. Marine
- 7.2.6. Other En
- 7.3. Market Analysis, Insights and Forecast - by Geography
- 7.3.1. China
- 7.3.2. India
- 7.3.3. Japan
- 7.3.4. South Korea
- 7.3.5. ASEAN Countries
- 7.3.6. Rest of Asia-Pacific
- 7.1. Market Analysis, Insights and Forecast - by Base Oil
- 8. Japan APAC Compressor Oil Market Analysis, Insights and Forecast, 2019-2031
- 8.1. Market Analysis, Insights and Forecast - by Base Oil
- 8.1.1. Synthetic
- 8.1.2. Mineral
- 8.1.3. Other Ba
- 8.2. Market Analysis, Insights and Forecast - by End-User Industry
- 8.2.1. Manufacturing
- 8.2.2. Chemical and Petrochemical
- 8.2.3. Oil and Gas
- 8.2.4. Mining
- 8.2.5. Marine
- 8.2.6. Other En
- 8.3. Market Analysis, Insights and Forecast - by Geography
- 8.3.1. China
- 8.3.2. India
- 8.3.3. Japan
- 8.3.4. South Korea
- 8.3.5. ASEAN Countries
- 8.3.6. Rest of Asia-Pacific
- 8.1. Market Analysis, Insights and Forecast - by Base Oil
- 9. South Korea APAC Compressor Oil Market Analysis, Insights and Forecast, 2019-2031
- 9.1. Market Analysis, Insights and Forecast - by Base Oil
- 9.1.1. Synthetic
- 9.1.2. Mineral
- 9.1.3. Other Ba
- 9.2. Market Analysis, Insights and Forecast - by End-User Industry
- 9.2.1. Manufacturing
- 9.2.2. Chemical and Petrochemical
- 9.2.3. Oil and Gas
- 9.2.4. Mining
- 9.2.5. Marine
- 9.2.6. Other En
- 9.3. Market Analysis, Insights and Forecast - by Geography
- 9.3.1. China
- 9.3.2. India
- 9.3.3. Japan
- 9.3.4. South Korea
- 9.3.5. ASEAN Countries
- 9.3.6. Rest of Asia-Pacific
- 9.1. Market Analysis, Insights and Forecast - by Base Oil
- 10. ASEAN Countries APAC Compressor Oil Market Analysis, Insights and Forecast, 2019-2031
- 10.1. Market Analysis, Insights and Forecast - by Base Oil
- 10.1.1. Synthetic
- 10.1.2. Mineral
- 10.1.3. Other Ba
- 10.2. Market Analysis, Insights and Forecast - by End-User Industry
- 10.2.1. Manufacturing
- 10.2.2. Chemical and Petrochemical
- 10.2.3. Oil and Gas
- 10.2.4. Mining
- 10.2.5. Marine
- 10.2.6. Other En
- 10.3. Market Analysis, Insights and Forecast - by Geography
- 10.3.1. China
- 10.3.2. India
- 10.3.3. Japan
- 10.3.4. South Korea
- 10.3.5. ASEAN Countries
- 10.3.6. Rest of Asia-Pacific
- 10.1. Market Analysis, Insights and Forecast - by Base Oil
- 11. Rest of Asia Pacific APAC Compressor Oil Market Analysis, Insights and Forecast, 2019-2031
- 11.1. Market Analysis, Insights and Forecast - by Base Oil
- 11.1.1. Synthetic
- 11.1.2. Mineral
- 11.1.3. Other Ba
- 11.2. Market Analysis, Insights and Forecast - by End-User Industry
- 11.2.1. Manufacturing
- 11.2.2. Chemical and Petrochemical
- 11.2.3. Oil and Gas
- 11.2.4. Mining
- 11.2.5. Marine
- 11.2.6. Other En
- 11.3. Market Analysis, Insights and Forecast - by Geography
- 11.3.1. China
- 11.3.2. India
- 11.3.3. Japan
- 11.3.4. South Korea
- 11.3.5. ASEAN Countries
- 11.3.6. Rest of Asia-Pacific
- 11.1. Market Analysis, Insights and Forecast - by Base Oil
- 12. North America APAC Compressor Oil Market Analysis, Insights and Forecast, 2019-2031
- 12.1. Market Analysis, Insights and Forecast - By Country/Sub-region
- 12.1.1 United States
- 12.1.2 Canada
- 12.1.3 Mexico
- 13. Europe APAC Compressor Oil Market Analysis, Insights and Forecast, 2019-2031
- 13.1. Market Analysis, Insights and Forecast - By Country/Sub-region
- 13.1.1 Germany
- 13.1.2 United Kingdom
- 13.1.3 France
- 13.1.4 Spain
- 13.1.5 Italy
- 13.1.6 Spain
- 13.1.7 Belgium
- 13.1.8 Netherland
- 13.1.9 Nordics
- 13.1.10 Rest of Europe
- 14. Asia Pacific APAC Compressor Oil Market Analysis, Insights and Forecast, 2019-2031
- 14.1. Market Analysis, Insights and Forecast - By Country/Sub-region
- 14.1.1 China
- 14.1.2 Japan
- 14.1.3 India
- 14.1.4 South Korea
- 14.1.5 Southeast Asia
- 14.1.6 Australia
- 14.1.7 Indonesia
- 14.1.8 Phillipes
- 14.1.9 Singapore
- 14.1.10 Thailandc
- 14.1.11 Rest of Asia Pacific
- 15. South America APAC Compressor Oil Market Analysis, Insights and Forecast, 2019-2031
- 15.1. Market Analysis, Insights and Forecast - By Country/Sub-region
- 15.1.1 Brazil
- 15.1.2 Argentina
- 15.1.3 Peru
- 15.1.4 Chile
- 15.1.5 Colombia
- 15.1.6 Ecuador
- 15.1.7 Venezuela
- 15.1.8 Rest of South America
- 16. North America APAC Compressor Oil Market Analysis, Insights and Forecast, 2019-2031
- 16.1. Market Analysis, Insights and Forecast - By Country/Sub-region
- 16.1.1 United States
- 16.1.2 Canada
- 16.1.3 Mexico
- 17. MEA APAC Compressor Oil Market Analysis, Insights and Forecast, 2019-2031
- 17.1. Market Analysis, Insights and Forecast - By Country/Sub-region
- 17.1.1 United Arab Emirates
- 17.1.2 Saudi Arabia
- 17.1.3 South Africa
- 17.1.4 Rest of Middle East and Africa
- 18. Competitive Analysis
- 18.1. Global Market Share Analysis 2024
- 18.2. Company Profiles
- 18.2.1 Chevron Corporation
- 18.2.1.1. Overview
- 18.2.1.2. Products
- 18.2.1.3. SWOT Analysis
- 18.2.1.4. Recent Developments
- 18.2.1.5. Financials (Based on Availability)
- 18.2.2 Gandhar Oil Refinery (India) Limited
- 18.2.2.1. Overview
- 18.2.2.2. Products
- 18.2.2.3. SWOT Analysis
- 18.2.2.4. Recent Developments
- 18.2.2.5. Financials (Based on Availability)
- 18.2.3 Sasol
- 18.2.3.1. Overview
- 18.2.3.2. Products
- 18.2.3.3. SWOT Analysis
- 18.2.3.4. Recent Developments
- 18.2.3.5. Financials (Based on Availability)
- 18.2.4 Valvoline Cummins Private Limited*List Not Exhaustive
- 18.2.4.1. Overview
- 18.2.4.2. Products
- 18.2.4.3. SWOT Analysis
- 18.2.4.4. Recent Developments
- 18.2.4.5. Financials (Based on Availability)
- 18.2.5 China Petrochemical Corporation (Sinopec)
- 18.2.5.1. Overview
- 18.2.5.2. Products
- 18.2.5.3. SWOT Analysis
- 18.2.5.4. Recent Developments
- 18.2.5.5. Financials (Based on Availability)
- 18.2.6 TotalEnergies SE
- 18.2.6.1. Overview
- 18.2.6.2. Products
- 18.2.6.3. SWOT Analysis
- 18.2.6.4. Recent Developments
- 18.2.6.5. Financials (Based on Availability)
- 18.2.7 HP Lubricants
- 18.2.7.1. Overview
- 18.2.7.2. Products
- 18.2.7.3. SWOT Analysis
- 18.2.7.4. Recent Developments
- 18.2.7.5. Financials (Based on Availability)
- 18.2.8 Exxon Mobil Corporation
- 18.2.8.1. Overview
- 18.2.8.2. Products
- 18.2.8.3. SWOT Analysis
- 18.2.8.4. Recent Developments
- 18.2.8.5. Financials (Based on Availability)
- 18.2.9 Shell Plc
- 18.2.9.1. Overview
- 18.2.9.2. Products
- 18.2.9.3. SWOT Analysis
- 18.2.9.4. Recent Developments
- 18.2.9.5. Financials (Based on Availability)
- 18.2.10 Indian Oil Corporation Ltd
- 18.2.10.1. Overview
- 18.2.10.2. Products
- 18.2.10.3. SWOT Analysis
- 18.2.10.4. Recent Developments
- 18.2.10.5. Financials (Based on Availability)
- 18.2.11 FUCHS
- 18.2.11.1. Overview
- 18.2.11.2. Products
- 18.2.11.3. SWOT Analysis
- 18.2.11.4. Recent Developments
- 18.2.11.5. Financials (Based on Availability)
- 18.2.1 Chevron Corporation
List of Figures
- Figure 1: Global APAC Compressor Oil Market Revenue Breakdown (Million, %) by Region 2024 & 2032
- Figure 2: Global APAC Compressor Oil Market Volume Breakdown (Million, %) by Region 2024 & 2032
- Figure 3: North America APAC Compressor Oil Market Revenue (Million), by Country 2024 & 2032
- Figure 4: North America APAC Compressor Oil Market Volume (Million), by Country 2024 & 2032
- Figure 5: North America APAC Compressor Oil Market Revenue Share (%), by Country 2024 & 2032
- Figure 6: North America APAC Compressor Oil Market Volume Share (%), by Country 2024 & 2032
- Figure 7: Europe APAC Compressor Oil Market Revenue (Million), by Country 2024 & 2032
- Figure 8: Europe APAC Compressor Oil Market Volume (Million), by Country 2024 & 2032
- Figure 9: Europe APAC Compressor Oil Market Revenue Share (%), by Country 2024 & 2032
- Figure 10: Europe APAC Compressor Oil Market Volume Share (%), by Country 2024 & 2032
- Figure 11: Asia Pacific APAC Compressor Oil Market Revenue (Million), by Country 2024 & 2032
- Figure 12: Asia Pacific APAC Compressor Oil Market Volume (Million), by Country 2024 & 2032
- Figure 13: Asia Pacific APAC Compressor Oil Market Revenue Share (%), by Country 2024 & 2032
- Figure 14: Asia Pacific APAC Compressor Oil Market Volume Share (%), by Country 2024 & 2032
- Figure 15: South America APAC Compressor Oil Market Revenue (Million), by Country 2024 & 2032
- Figure 16: South America APAC Compressor Oil Market Volume (Million), by Country 2024 & 2032
- Figure 17: South America APAC Compressor Oil Market Revenue Share (%), by Country 2024 & 2032
- Figure 18: South America APAC Compressor Oil Market Volume Share (%), by Country 2024 & 2032
- Figure 19: North America APAC Compressor Oil Market Revenue (Million), by Country 2024 & 2032
- Figure 20: North America APAC Compressor Oil Market Volume (Million), by Country 2024 & 2032
- Figure 21: North America APAC Compressor Oil Market Revenue Share (%), by Country 2024 & 2032
- Figure 22: North America APAC Compressor Oil Market Volume Share (%), by Country 2024 & 2032
- Figure 23: MEA APAC Compressor Oil Market Revenue (Million), by Country 2024 & 2032
- Figure 24: MEA APAC Compressor Oil Market Volume (Million), by Country 2024 & 2032
- Figure 25: MEA APAC Compressor Oil Market Revenue Share (%), by Country 2024 & 2032
- Figure 26: MEA APAC Compressor Oil Market Volume Share (%), by Country 2024 & 2032
- Figure 27: China APAC Compressor Oil Market Revenue (Million), by Base Oil 2024 & 2032
- Figure 28: China APAC Compressor Oil Market Volume (Million), by Base Oil 2024 & 2032
- Figure 29: China APAC Compressor Oil Market Revenue Share (%), by Base Oil 2024 & 2032
- Figure 30: China APAC Compressor Oil Market Volume Share (%), by Base Oil 2024 & 2032
- Figure 31: China APAC Compressor Oil Market Revenue (Million), by End-User Industry 2024 & 2032
- Figure 32: China APAC Compressor Oil Market Volume (Million), by End-User Industry 2024 & 2032
- Figure 33: China APAC Compressor Oil Market Revenue Share (%), by End-User Industry 2024 & 2032
- Figure 34: China APAC Compressor Oil Market Volume Share (%), by End-User Industry 2024 & 2032
- Figure 35: China APAC Compressor Oil Market Revenue (Million), by Geography 2024 & 2032
- Figure 36: China APAC Compressor Oil Market Volume (Million), by Geography 2024 & 2032
- Figure 37: China APAC Compressor Oil Market Revenue Share (%), by Geography 2024 & 2032
- Figure 38: China APAC Compressor Oil Market Volume Share (%), by Geography 2024 & 2032
- Figure 39: China APAC Compressor Oil Market Revenue (Million), by Country 2024 & 2032
- Figure 40: China APAC Compressor Oil Market Volume (Million), by Country 2024 & 2032
- Figure 41: China APAC Compressor Oil Market Revenue Share (%), by Country 2024 & 2032
- Figure 42: China APAC Compressor Oil Market Volume Share (%), by Country 2024 & 2032
- Figure 43: India APAC Compressor Oil Market Revenue (Million), by Base Oil 2024 & 2032
- Figure 44: India APAC Compressor Oil Market Volume (Million), by Base Oil 2024 & 2032
- Figure 45: India APAC Compressor Oil Market Revenue Share (%), by Base Oil 2024 & 2032
- Figure 46: India APAC Compressor Oil Market Volume Share (%), by Base Oil 2024 & 2032
- Figure 47: India APAC Compressor Oil Market Revenue (Million), by End-User Industry 2024 & 2032
- Figure 48: India APAC Compressor Oil Market Volume (Million), by End-User Industry 2024 & 2032
- Figure 49: India APAC Compressor Oil Market Revenue Share (%), by End-User Industry 2024 & 2032
- Figure 50: India APAC Compressor Oil Market Volume Share (%), by End-User Industry 2024 & 2032
- Figure 51: India APAC Compressor Oil Market Revenue (Million), by Geography 2024 & 2032
- Figure 52: India APAC Compressor Oil Market Volume (Million), by Geography 2024 & 2032
- Figure 53: India APAC Compressor Oil Market Revenue Share (%), by Geography 2024 & 2032
- Figure 54: India APAC Compressor Oil Market Volume Share (%), by Geography 2024 & 2032
- Figure 55: India APAC Compressor Oil Market Revenue (Million), by Country 2024 & 2032
- Figure 56: India APAC Compressor Oil Market Volume (Million), by Country 2024 & 2032
- Figure 57: India APAC Compressor Oil Market Revenue Share (%), by Country 2024 & 2032
- Figure 58: India APAC Compressor Oil Market Volume Share (%), by Country 2024 & 2032
- Figure 59: Japan APAC Compressor Oil Market Revenue (Million), by Base Oil 2024 & 2032
- Figure 60: Japan APAC Compressor Oil Market Volume (Million), by Base Oil 2024 & 2032
- Figure 61: Japan APAC Compressor Oil Market Revenue Share (%), by Base Oil 2024 & 2032
- Figure 62: Japan APAC Compressor Oil Market Volume Share (%), by Base Oil 2024 & 2032
- Figure 63: Japan APAC Compressor Oil Market Revenue (Million), by End-User Industry 2024 & 2032
- Figure 64: Japan APAC Compressor Oil Market Volume (Million), by End-User Industry 2024 & 2032
- Figure 65: Japan APAC Compressor Oil Market Revenue Share (%), by End-User Industry 2024 & 2032
- Figure 66: Japan APAC Compressor Oil Market Volume Share (%), by End-User Industry 2024 & 2032
- Figure 67: Japan APAC Compressor Oil Market Revenue (Million), by Geography 2024 & 2032
- Figure 68: Japan APAC Compressor Oil Market Volume (Million), by Geography 2024 & 2032
- Figure 69: Japan APAC Compressor Oil Market Revenue Share (%), by Geography 2024 & 2032
- Figure 70: Japan APAC Compressor Oil Market Volume Share (%), by Geography 2024 & 2032
- Figure 71: Japan APAC Compressor Oil Market Revenue (Million), by Country 2024 & 2032
- Figure 72: Japan APAC Compressor Oil Market Volume (Million), by Country 2024 & 2032
- Figure 73: Japan APAC Compressor Oil Market Revenue Share (%), by Country 2024 & 2032
- Figure 74: Japan APAC Compressor Oil Market Volume Share (%), by Country 2024 & 2032
- Figure 75: South Korea APAC Compressor Oil Market Revenue (Million), by Base Oil 2024 & 2032
- Figure 76: South Korea APAC Compressor Oil Market Volume (Million), by Base Oil 2024 & 2032
- Figure 77: South Korea APAC Compressor Oil Market Revenue Share (%), by Base Oil 2024 & 2032
- Figure 78: South Korea APAC Compressor Oil Market Volume Share (%), by Base Oil 2024 & 2032
- Figure 79: South Korea APAC Compressor Oil Market Revenue (Million), by End-User Industry 2024 & 2032
- Figure 80: South Korea APAC Compressor Oil Market Volume (Million), by End-User Industry 2024 & 2032
- Figure 81: South Korea APAC Compressor Oil Market Revenue Share (%), by End-User Industry 2024 & 2032
- Figure 82: South Korea APAC Compressor Oil Market Volume Share (%), by End-User Industry 2024 & 2032
- Figure 83: South Korea APAC Compressor Oil Market Revenue (Million), by Geography 2024 & 2032
- Figure 84: South Korea APAC Compressor Oil Market Volume (Million), by Geography 2024 & 2032
- Figure 85: South Korea APAC Compressor Oil Market Revenue Share (%), by Geography 2024 & 2032
- Figure 86: South Korea APAC Compressor Oil Market Volume Share (%), by Geography 2024 & 2032
- Figure 87: South Korea APAC Compressor Oil Market Revenue (Million), by Country 2024 & 2032
- Figure 88: South Korea APAC Compressor Oil Market Volume (Million), by Country 2024 & 2032
- Figure 89: South Korea APAC Compressor Oil Market Revenue Share (%), by Country 2024 & 2032
- Figure 90: South Korea APAC Compressor Oil Market Volume Share (%), by Country 2024 & 2032
- Figure 91: ASEAN Countries APAC Compressor Oil Market Revenue (Million), by Base Oil 2024 & 2032
- Figure 92: ASEAN Countries APAC Compressor Oil Market Volume (Million), by Base Oil 2024 & 2032
- Figure 93: ASEAN Countries APAC Compressor Oil Market Revenue Share (%), by Base Oil 2024 & 2032
- Figure 94: ASEAN Countries APAC Compressor Oil Market Volume Share (%), by Base Oil 2024 & 2032
- Figure 95: ASEAN Countries APAC Compressor Oil Market Revenue (Million), by End-User Industry 2024 & 2032
- Figure 96: ASEAN Countries APAC Compressor Oil Market Volume (Million), by End-User Industry 2024 & 2032
- Figure 97: ASEAN Countries APAC Compressor Oil Market Revenue Share (%), by End-User Industry 2024 & 2032
- Figure 98: ASEAN Countries APAC Compressor Oil Market Volume Share (%), by End-User Industry 2024 & 2032
- Figure 99: ASEAN Countries APAC Compressor Oil Market Revenue (Million), by Geography 2024 & 2032
- Figure 100: ASEAN Countries APAC Compressor Oil Market Volume (Million), by Geography 2024 & 2032
- Figure 101: ASEAN Countries APAC Compressor Oil Market Revenue Share (%), by Geography 2024 & 2032
- Figure 102: ASEAN Countries APAC Compressor Oil Market Volume Share (%), by Geography 2024 & 2032
- Figure 103: ASEAN Countries APAC Compressor Oil Market Revenue (Million), by Country 2024 & 2032
- Figure 104: ASEAN Countries APAC Compressor Oil Market Volume (Million), by Country 2024 & 2032
- Figure 105: ASEAN Countries APAC Compressor Oil Market Revenue Share (%), by Country 2024 & 2032
- Figure 106: ASEAN Countries APAC Compressor Oil Market Volume Share (%), by Country 2024 & 2032
- Figure 107: Rest of Asia Pacific APAC Compressor Oil Market Revenue (Million), by Base Oil 2024 & 2032
- Figure 108: Rest of Asia Pacific APAC Compressor Oil Market Volume (Million), by Base Oil 2024 & 2032
- Figure 109: Rest of Asia Pacific APAC Compressor Oil Market Revenue Share (%), by Base Oil 2024 & 2032
- Figure 110: Rest of Asia Pacific APAC Compressor Oil Market Volume Share (%), by Base Oil 2024 & 2032
- Figure 111: Rest of Asia Pacific APAC Compressor Oil Market Revenue (Million), by End-User Industry 2024 & 2032
- Figure 112: Rest of Asia Pacific APAC Compressor Oil Market Volume (Million), by End-User Industry 2024 & 2032
- Figure 113: Rest of Asia Pacific APAC Compressor Oil Market Revenue Share (%), by End-User Industry 2024 & 2032
- Figure 114: Rest of Asia Pacific APAC Compressor Oil Market Volume Share (%), by End-User Industry 2024 & 2032
- Figure 115: Rest of Asia Pacific APAC Compressor Oil Market Revenue (Million), by Geography 2024 & 2032
- Figure 116: Rest of Asia Pacific APAC Compressor Oil Market Volume (Million), by Geography 2024 & 2032
- Figure 117: Rest of Asia Pacific APAC Compressor Oil Market Revenue Share (%), by Geography 2024 & 2032
- Figure 118: Rest of Asia Pacific APAC Compressor Oil Market Volume Share (%), by Geography 2024 & 2032
- Figure 119: Rest of Asia Pacific APAC Compressor Oil Market Revenue (Million), by Country 2024 & 2032
- Figure 120: Rest of Asia Pacific APAC Compressor Oil Market Volume (Million), by Country 2024 & 2032
- Figure 121: Rest of Asia Pacific APAC Compressor Oil Market Revenue Share (%), by Country 2024 & 2032
- Figure 122: Rest of Asia Pacific APAC Compressor Oil Market Volume Share (%), by Country 2024 & 2032
List of Tables
- Table 1: Global APAC Compressor Oil Market Revenue Million Forecast, by Region 2019 & 2032
- Table 2: Global APAC Compressor Oil Market Volume Million Forecast, by Region 2019 & 2032
- Table 3: Global APAC Compressor Oil Market Revenue Million Forecast, by Base Oil 2019 & 2032
- Table 4: Global APAC Compressor Oil Market Volume Million Forecast, by Base Oil 2019 & 2032
- Table 5: Global APAC Compressor Oil Market Revenue Million Forecast, by End-User Industry 2019 & 2032
- Table 6: Global APAC Compressor Oil Market Volume Million Forecast, by End-User Industry 2019 & 2032
- Table 7: Global APAC Compressor Oil Market Revenue Million Forecast, by Geography 2019 & 2032
- Table 8: Global APAC Compressor Oil Market Volume Million Forecast, by Geography 2019 & 2032
- Table 9: Global APAC Compressor Oil Market Revenue Million Forecast, by Region 2019 & 2032
- Table 10: Global APAC Compressor Oil Market Volume Million Forecast, by Region 2019 & 2032
- Table 11: Global APAC Compressor Oil Market Revenue Million Forecast, by Country 2019 & 2032
- Table 12: Global APAC Compressor Oil Market Volume Million Forecast, by Country 2019 & 2032
- Table 13: United States APAC Compressor Oil Market Revenue (Million) Forecast, by Application 2019 & 2032
- Table 14: United States APAC Compressor Oil Market Volume (Million) Forecast, by Application 2019 & 2032
- Table 15: Canada APAC Compressor Oil Market Revenue (Million) Forecast, by Application 2019 & 2032
- Table 16: Canada APAC Compressor Oil Market Volume (Million) Forecast, by Application 2019 & 2032
- Table 17: Mexico APAC Compressor Oil Market Revenue (Million) Forecast, by Application 2019 & 2032
- Table 18: Mexico APAC Compressor Oil Market Volume (Million) Forecast, by Application 2019 & 2032
- Table 19: Global APAC Compressor Oil Market Revenue Million Forecast, by Country 2019 & 2032
- Table 20: Global APAC Compressor Oil Market Volume Million Forecast, by Country 2019 & 2032
- Table 21: Germany APAC Compressor Oil Market Revenue (Million) Forecast, by Application 2019 & 2032
- Table 22: Germany APAC Compressor Oil Market Volume (Million) Forecast, by Application 2019 & 2032
- Table 23: United Kingdom APAC Compressor Oil Market Revenue (Million) Forecast, by Application 2019 & 2032
- Table 24: United Kingdom APAC Compressor Oil Market Volume (Million) Forecast, by Application 2019 & 2032
- Table 25: France APAC Compressor Oil Market Revenue (Million) Forecast, by Application 2019 & 2032
- Table 26: France APAC Compressor Oil Market Volume (Million) Forecast, by Application 2019 & 2032
- Table 27: Spain APAC Compressor Oil Market Revenue (Million) Forecast, by Application 2019 & 2032
- Table 28: Spain APAC Compressor Oil Market Volume (Million) Forecast, by Application 2019 & 2032
- Table 29: Italy APAC Compressor Oil Market Revenue (Million) Forecast, by Application 2019 & 2032
- Table 30: Italy APAC Compressor Oil Market Volume (Million) Forecast, by Application 2019 & 2032
- Table 31: Spain APAC Compressor Oil Market Revenue (Million) Forecast, by Application 2019 & 2032
- Table 32: Spain APAC Compressor Oil Market Volume (Million) Forecast, by Application 2019 & 2032
- Table 33: Belgium APAC Compressor Oil Market Revenue (Million) Forecast, by Application 2019 & 2032
- Table 34: Belgium APAC Compressor Oil Market Volume (Million) Forecast, by Application 2019 & 2032
- Table 35: Netherland APAC Compressor Oil Market Revenue (Million) Forecast, by Application 2019 & 2032
- Table 36: Netherland APAC Compressor Oil Market Volume (Million) Forecast, by Application 2019 & 2032
- Table 37: Nordics APAC Compressor Oil Market Revenue (Million) Forecast, by Application 2019 & 2032
- Table 38: Nordics APAC Compressor Oil Market Volume (Million) Forecast, by Application 2019 & 2032
- Table 39: Rest of Europe APAC Compressor Oil Market Revenue (Million) Forecast, by Application 2019 & 2032
- Table 40: Rest of Europe APAC Compressor Oil Market Volume (Million) Forecast, by Application 2019 & 2032
- Table 41: Global APAC Compressor Oil Market Revenue Million Forecast, by Country 2019 & 2032
- Table 42: Global APAC Compressor Oil Market Volume Million Forecast, by Country 2019 & 2032
- Table 43: China APAC Compressor Oil Market Revenue (Million) Forecast, by Application 2019 & 2032
- Table 44: China APAC Compressor Oil Market Volume (Million) Forecast, by Application 2019 & 2032
- Table 45: Japan APAC Compressor Oil Market Revenue (Million) Forecast, by Application 2019 & 2032
- Table 46: Japan APAC Compressor Oil Market Volume (Million) Forecast, by Application 2019 & 2032
- Table 47: India APAC Compressor Oil Market Revenue (Million) Forecast, by Application 2019 & 2032
- Table 48: India APAC Compressor Oil Market Volume (Million) Forecast, by Application 2019 & 2032
- Table 49: South Korea APAC Compressor Oil Market Revenue (Million) Forecast, by Application 2019 & 2032
- Table 50: South Korea APAC Compressor Oil Market Volume (Million) Forecast, by Application 2019 & 2032
- Table 51: Southeast Asia APAC Compressor Oil Market Revenue (Million) Forecast, by Application 2019 & 2032
- Table 52: Southeast Asia APAC Compressor Oil Market Volume (Million) Forecast, by Application 2019 & 2032
- Table 53: Australia APAC Compressor Oil Market Revenue (Million) Forecast, by Application 2019 & 2032
- Table 54: Australia APAC Compressor Oil Market Volume (Million) Forecast, by Application 2019 & 2032
- Table 55: Indonesia APAC Compressor Oil Market Revenue (Million) Forecast, by Application 2019 & 2032
- Table 56: Indonesia APAC Compressor Oil Market Volume (Million) Forecast, by Application 2019 & 2032
- Table 57: Phillipes APAC Compressor Oil Market Revenue (Million) Forecast, by Application 2019 & 2032
- Table 58: Phillipes APAC Compressor Oil Market Volume (Million) Forecast, by Application 2019 & 2032
- Table 59: Singapore APAC Compressor Oil Market Revenue (Million) Forecast, by Application 2019 & 2032
- Table 60: Singapore APAC Compressor Oil Market Volume (Million) Forecast, by Application 2019 & 2032
- Table 61: Thailandc APAC Compressor Oil Market Revenue (Million) Forecast, by Application 2019 & 2032
- Table 62: Thailandc APAC Compressor Oil Market Volume (Million) Forecast, by Application 2019 & 2032
- Table 63: Rest of Asia Pacific APAC Compressor Oil Market Revenue (Million) Forecast, by Application 2019 & 2032
- Table 64: Rest of Asia Pacific APAC Compressor Oil Market Volume (Million) Forecast, by Application 2019 & 2032
- Table 65: Global APAC Compressor Oil Market Revenue Million Forecast, by Country 2019 & 2032
- Table 66: Global APAC Compressor Oil Market Volume Million Forecast, by Country 2019 & 2032
- Table 67: Brazil APAC Compressor Oil Market Revenue (Million) Forecast, by Application 2019 & 2032
- Table 68: Brazil APAC Compressor Oil Market Volume (Million) Forecast, by Application 2019 & 2032
- Table 69: Argentina APAC Compressor Oil Market Revenue (Million) Forecast, by Application 2019 & 2032
- Table 70: Argentina APAC Compressor Oil Market Volume (Million) Forecast, by Application 2019 & 2032
- Table 71: Peru APAC Compressor Oil Market Revenue (Million) Forecast, by Application 2019 & 2032
- Table 72: Peru APAC Compressor Oil Market Volume (Million) Forecast, by Application 2019 & 2032
- Table 73: Chile APAC Compressor Oil Market Revenue (Million) Forecast, by Application 2019 & 2032
- Table 74: Chile APAC Compressor Oil Market Volume (Million) Forecast, by Application 2019 & 2032
- Table 75: Colombia APAC Compressor Oil Market Revenue (Million) Forecast, by Application 2019 & 2032
- Table 76: Colombia APAC Compressor Oil Market Volume (Million) Forecast, by Application 2019 & 2032
- Table 77: Ecuador APAC Compressor Oil Market Revenue (Million) Forecast, by Application 2019 & 2032
- Table 78: Ecuador APAC Compressor Oil Market Volume (Million) Forecast, by Application 2019 & 2032
- Table 79: Venezuela APAC Compressor Oil Market Revenue (Million) Forecast, by Application 2019 & 2032
- Table 80: Venezuela APAC Compressor Oil Market Volume (Million) Forecast, by Application 2019 & 2032
- Table 81: Rest of South America APAC Compressor Oil Market Revenue (Million) Forecast, by Application 2019 & 2032
- Table 82: Rest of South America APAC Compressor Oil Market Volume (Million) Forecast, by Application 2019 & 2032
- Table 83: Global APAC Compressor Oil Market Revenue Million Forecast, by Country 2019 & 2032
- Table 84: Global APAC Compressor Oil Market Volume Million Forecast, by Country 2019 & 2032
- Table 85: United States APAC Compressor Oil Market Revenue (Million) Forecast, by Application 2019 & 2032
- Table 86: United States APAC Compressor Oil Market Volume (Million) Forecast, by Application 2019 & 2032
- Table 87: Canada APAC Compressor Oil Market Revenue (Million) Forecast, by Application 2019 & 2032
- Table 88: Canada APAC Compressor Oil Market Volume (Million) Forecast, by Application 2019 & 2032
- Table 89: Mexico APAC Compressor Oil Market Revenue (Million) Forecast, by Application 2019 & 2032
- Table 90: Mexico APAC Compressor Oil Market Volume (Million) Forecast, by Application 2019 & 2032
- Table 91: Global APAC Compressor Oil Market Revenue Million Forecast, by Country 2019 & 2032
- Table 92: Global APAC Compressor Oil Market Volume Million Forecast, by Country 2019 & 2032
- Table 93: United Arab Emirates APAC Compressor Oil Market Revenue (Million) Forecast, by Application 2019 & 2032
- Table 94: United Arab Emirates APAC Compressor Oil Market Volume (Million) Forecast, by Application 2019 & 2032
- Table 95: Saudi Arabia APAC Compressor Oil Market Revenue (Million) Forecast, by Application 2019 & 2032
- Table 96: Saudi Arabia APAC Compressor Oil Market Volume (Million) Forecast, by Application 2019 & 2032
- Table 97: South Africa APAC Compressor Oil Market Revenue (Million) Forecast, by Application 2019 & 2032
- Table 98: South Africa APAC Compressor Oil Market Volume (Million) Forecast, by Application 2019 & 2032
- Table 99: Rest of Middle East and Africa APAC Compressor Oil Market Revenue (Million) Forecast, by Application 2019 & 2032
- Table 100: Rest of Middle East and Africa APAC Compressor Oil Market Volume (Million) Forecast, by Application 2019 & 2032
- Table 101: Global APAC Compressor Oil Market Revenue Million Forecast, by Base Oil 2019 & 2032
- Table 102: Global APAC Compressor Oil Market Volume Million Forecast, by Base Oil 2019 & 2032
- Table 103: Global APAC Compressor Oil Market Revenue Million Forecast, by End-User Industry 2019 & 2032
- Table 104: Global APAC Compressor Oil Market Volume Million Forecast, by End-User Industry 2019 & 2032
- Table 105: Global APAC Compressor Oil Market Revenue Million Forecast, by Geography 2019 & 2032
- Table 106: Global APAC Compressor Oil Market Volume Million Forecast, by Geography 2019 & 2032
- Table 107: Global APAC Compressor Oil Market Revenue Million Forecast, by Country 2019 & 2032
- Table 108: Global APAC Compressor Oil Market Volume Million Forecast, by Country 2019 & 2032
- Table 109: Global APAC Compressor Oil Market Revenue Million Forecast, by Base Oil 2019 & 2032
- Table 110: Global APAC Compressor Oil Market Volume Million Forecast, by Base Oil 2019 & 2032
- Table 111: Global APAC Compressor Oil Market Revenue Million Forecast, by End-User Industry 2019 & 2032
- Table 112: Global APAC Compressor Oil Market Volume Million Forecast, by End-User Industry 2019 & 2032
- Table 113: Global APAC Compressor Oil Market Revenue Million Forecast, by Geography 2019 & 2032
- Table 114: Global APAC Compressor Oil Market Volume Million Forecast, by Geography 2019 & 2032
- Table 115: Global APAC Compressor Oil Market Revenue Million Forecast, by Country 2019 & 2032
- Table 116: Global APAC Compressor Oil Market Volume Million Forecast, by Country 2019 & 2032
- Table 117: Global APAC Compressor Oil Market Revenue Million Forecast, by Base Oil 2019 & 2032
- Table 118: Global APAC Compressor Oil Market Volume Million Forecast, by Base Oil 2019 & 2032
- Table 119: Global APAC Compressor Oil Market Revenue Million Forecast, by End-User Industry 2019 & 2032
- Table 120: Global APAC Compressor Oil Market Volume Million Forecast, by End-User Industry 2019 & 2032
- Table 121: Global APAC Compressor Oil Market Revenue Million Forecast, by Geography 2019 & 2032
- Table 122: Global APAC Compressor Oil Market Volume Million Forecast, by Geography 2019 & 2032
- Table 123: Global APAC Compressor Oil Market Revenue Million Forecast, by Country 2019 & 2032
- Table 124: Global APAC Compressor Oil Market Volume Million Forecast, by Country 2019 & 2032
- Table 125: Global APAC Compressor Oil Market Revenue Million Forecast, by Base Oil 2019 & 2032
- Table 126: Global APAC Compressor Oil Market Volume Million Forecast, by Base Oil 2019 & 2032
- Table 127: Global APAC Compressor Oil Market Revenue Million Forecast, by End-User Industry 2019 & 2032
- Table 128: Global APAC Compressor Oil Market Volume Million Forecast, by End-User Industry 2019 & 2032
- Table 129: Global APAC Compressor Oil Market Revenue Million Forecast, by Geography 2019 & 2032
- Table 130: Global APAC Compressor Oil Market Volume Million Forecast, by Geography 2019 & 2032
- Table 131: Global APAC Compressor Oil Market Revenue Million Forecast, by Country 2019 & 2032
- Table 132: Global APAC Compressor Oil Market Volume Million Forecast, by Country 2019 & 2032
- Table 133: Global APAC Compressor Oil Market Revenue Million Forecast, by Base Oil 2019 & 2032
- Table 134: Global APAC Compressor Oil Market Volume Million Forecast, by Base Oil 2019 & 2032
- Table 135: Global APAC Compressor Oil Market Revenue Million Forecast, by End-User Industry 2019 & 2032
- Table 136: Global APAC Compressor Oil Market Volume Million Forecast, by End-User Industry 2019 & 2032
- Table 137: Global APAC Compressor Oil Market Revenue Million Forecast, by Geography 2019 & 2032
- Table 138: Global APAC Compressor Oil Market Volume Million Forecast, by Geography 2019 & 2032
- Table 139: Global APAC Compressor Oil Market Revenue Million Forecast, by Country 2019 & 2032
- Table 140: Global APAC Compressor Oil Market Volume Million Forecast, by Country 2019 & 2032
- Table 141: Global APAC Compressor Oil Market Revenue Million Forecast, by Base Oil 2019 & 2032
- Table 142: Global APAC Compressor Oil Market Volume Million Forecast, by Base Oil 2019 & 2032
- Table 143: Global APAC Compressor Oil Market Revenue Million Forecast, by End-User Industry 2019 & 2032
- Table 144: Global APAC Compressor Oil Market Volume Million Forecast, by End-User Industry 2019 & 2032
- Table 145: Global APAC Compressor Oil Market Revenue Million Forecast, by Geography 2019 & 2032
- Table 146: Global APAC Compressor Oil Market Volume Million Forecast, by Geography 2019 & 2032
- Table 147: Global APAC Compressor Oil Market Revenue Million Forecast, by Country 2019 & 2032
- Table 148: Global APAC Compressor Oil Market Volume Million Forecast, by Country 2019 & 2032
Frequently Asked Questions
1. What is the projected Compound Annual Growth Rate (CAGR) of the APAC Compressor Oil Market?
The projected CAGR is approximately 3.97%.
2. Which companies are prominent players in the APAC Compressor Oil Market?
Key companies in the market include Chevron Corporation, Gandhar Oil Refinery (India) Limited, Sasol, Valvoline Cummins Private Limited*List Not Exhaustive, China Petrochemical Corporation (Sinopec), TotalEnergies SE, HP Lubricants, Exxon Mobil Corporation, Shell Plc, Indian Oil Corporation Ltd, FUCHS.
3. What are the main segments of the APAC Compressor Oil Market?
The market segments include Base Oil, End-User Industry, Geography.
4. Can you provide details about the market size?
The market size is estimated to be USD XX Million as of 2022.
5. What are some drivers contributing to market growth?
Increasing Investments in the Oil and Gas Industry; Growing Demand from the Manufacturing Industry; Other Drivers.
6. What are the notable trends driving market growth?
Increasing Investments in the Oil and Gas Industry.
7. Are there any restraints impacting market growth?
Growing Popularity of Oil Free Compressors; Other Restraints.
8. Can you provide examples of recent developments in the market?
April 2023: Exxon Mobil Corporation announced an investment of INR 9 billion USD 109.36 million) to develop a lubricant plant in Maharashtra, India. Once operational, the plant is anticipated to have the capacity to manufacture 159 million liters of finished lubricants annually to meet the domestic demand from industrial sectors such as manufacturing, steel, power, mining, and others. The plant is expected to begin operations by the end of 2025.
9. What pricing options are available for accessing the report?
Pricing options include single-user, multi-user, and enterprise licenses priced at USD 4750, USD 5250, and USD 8750 respectively.
10. Is the market size provided in terms of value or volume?
The market size is provided in terms of value, measured in Million and volume, measured in Million.
11. Are there any specific market keywords associated with the report?
Yes, the market keyword associated with the report is "APAC Compressor Oil Market," which aids in identifying and referencing the specific market segment covered.
12. How do I determine which pricing option suits my needs best?
The pricing options vary based on user requirements and access needs. Individual users may opt for single-user licenses, while businesses requiring broader access may choose multi-user or enterprise licenses for cost-effective access to the report.
13. Are there any additional resources or data provided in the APAC Compressor Oil Market report?
While the report offers comprehensive insights, it's advisable to review the specific contents or supplementary materials provided to ascertain if additional resources or data are available.
14. How can I stay updated on further developments or reports in the APAC Compressor Oil Market?
To stay informed about further developments, trends, and reports in the APAC Compressor Oil Market, consider subscribing to industry newsletters, following relevant companies and organizations, or regularly checking reputable industry news sources and publications.
Methodology
Step 1 - Identification of Relevant Samples Size from Population Database


Step 2 - Approaches for Defining Global Market Size (Value, Volume* & Price*)

Note*: In applicable scenarios
Step 3 - Data Sources
Primary Research
- Web Analytics
- Survey Reports
- Research Institute
- Latest Research Reports
- Opinion Leaders
Secondary Research
- Annual Reports
- White Paper
- Latest Press Release
- Industry Association
- Paid Database
- Investor Presentations

Step 4 - Data Triangulation
Involves using different sources of information in order to increase the validity of a study
These sources are likely to be stakeholders in a program - participants, other researchers, program staff, other community members, and so on.
Then we put all data in single framework & apply various statistical tools to find out the dynamic on the market.
During the analysis stage, feedback from the stakeholder groups would be compared to determine areas of agreement as well as areas of divergence


